

Abstract
Aims
The proportion of patients hospitalized for heart failure (HF) with preserved left ventricular ejection fraction (LVEF) is rising, but no approved treatment exists, in part owing to incomplete characterization of this particular HF phenotype. In order to better define the characteristics of HF phenotypes in Finland, a large cohort with 12 years' follow‐up time was analysed.
Methods and results
Patients diagnosed between 2005 and 2017 at the Hospital District of Southwest Finland were stratified according to LVEF measure and N‐terminal pro‐B‐type natriuretic peptide (NT‐proBNP) levels. For this retrospective registry study, previously diagnosed HF patients were defined as follows: patients with reduced ejection fraction (HFrEF; LVEF ≤ 40%; n = 4042), mid‐range ejection fraction (HFmrEF; LVEF > 40–50% and NT‐proBNP ≥ 125 pg/mL; n = 1468), and preserved ejection fraction (HFpEF; LVEF > 50% and NT‐proBNP ≥ 125 pg/mL; n = 3122) and followed up for 15 022, 4962, and 10 097 patient‐years, respectively. Cardiovascular (CV) hospitalization and mortality, influence of pre‐selected covariates on hospitalization and mortality, and the proportion of HFpEF and HFmrEF patients with a drop in LVEF to HFrEF phenotype were analysed. All data were extracted from the electronic patient register. HFrEF patients were rehospitalized slightly earlier than HFpEF/HFmrEF patients, but the second, third, and fourth rehospitalization rates did not differ between the subgroups. Female gender and better kidney function were associated with reduced rehospitalizations in HFmrEF and HFrEF, with a non‐significant trend in HFpEF. Each additional hospitalization was associated with a two‐fold increased risk of death and 2.2‐ to 2.3‐fold increased risk of CV death. All‐cause mortality was higher in patients with HFpEF. Although CV mortality was less frequent in HFpEF patients, it was associated with increased NT‐proBNP concentrations at index in all patient groups. During the 10 years following the index date, 26% of HFmrEF patients and 10% of HFpEF patients progressed to an HFrEF phenotype.
Conclusions
These findings suggest that disease progression, in terms of increased frequency of hospitalizations, and the relationship between increased number of hospitalizations and mortality are similar by LVEF phenotypes. These data highlight the importance of effective treatments that can reduce hospitalizations and suggest a role for monitoring NT‐proBNP levels in the management of HFpEF patients in particular.
Keywords: Heart failure, Hospitalization, Left ventricular ejection fraction, Long‐term follow‐up, Mortality, Real‐world study
Introduction
Heart failure (HF) is associated with a large disease burden evidenced by a high mortality rate and frequent hospitalization periods. 1 , 2 , 3 HF patients are typically characterized according to the measure of left ventricular ejection fraction (LVEF) on the basis of echocardiogram. 4 , 5 LVEF is usually between 50% and 75% in healthy persons. 6 , 7 A standard cut‐off value of 40% is often applied for abnormal LVEF, and such HF patients are designated as having HF with reduced ejection fraction (HFrEF, LVEF ≤ 40%). However, HF patients may also have normal, preserved ejection fraction (HFpEF patients, LVEF > 50%) or can be classified as mid‐range patients (HFmrEF, LVEF 40–50%). 4 , 5 , 8 , 9 LVEF values can vary between measurements and over time, and a small number of patients undergo transitions between the phenotypes, although data on this, particularly over extended follow‐up periods, are sparse. 10 , 11 , 12 , 13 , 14
Additional laboratory measures are usually needed to exclude non‐HF diagnosis in patients with symptoms and clinical features of HF but accompanied by preserved/mid‐range values of LVEF. In these cases, the concentration of N‐terminal pro‐B‐type natriuretic peptide (NT‐proBNP) is additionally determined with a negative cut‐off value of 125 pg/mL in non‐acute patients and 300 pg/mL in acute patients. 4 , 5 , 9
While HFrEF has been extensively studied and approved treatment options exist for this patient group, knowledge on HFpEF has remained elusive. Currently, no approved treatment exists for HFpEF. 4 , 5 , 15 , 16 Recently, it was reported that therapeutics currently targeting HFrEF can be also beneficial for HFpEF patients in the high‐risk window. 17 , 18
HFpEF already accounts for around half of HF patients and is becoming the most prevalent form of HF. 19 , 20 Compared with HFrEF, HFpEF patients are older, more often women, and have a higher prevalence of co‐morbidities. 19 , 20 , 21 Therefore, it is important to increase the understanding of HF outcomes and mortality across different phenotypes, in particular the less well‐understood HFpEF, both to support the development of new treatments and to help with predicting and managing increasing health care costs. Previous studies have investigated the relationship between cardiovascular (CV) hospitalizations and mortality in HF; however, these have mainly assessed HF patients as an overall group or had a limited number of HFpEF patients in the analyses. 18 , 20 , 22 , 23 , 24 , 25 Furthermore, the knowledge on Finnish HF patients has remained limited.
In order to better define the progression of HF within the different HF phenotypes in Finland, and to better understand the effect of repeated hospitalizations to the prognosis of the disease in different HF phenotypes, a large cohort of HFpEF, HFmrEF, and HFrEF patients of the Hospital District of Southwest Finland (HDSWF) was utilized in this study. The patients at high risk of CV hospitalization and mortality, the association between CV hospitalizations and mortality, and the proportion of patients with a drop in LVEF to HFrEF phenotype were determined. In general, this study adds to existing scientific knowledge by providing real‐world data specific for HFpEF and HFmrEF subgroups from a large, robust data source.
Methods
Patient inclusion criteria
Patients diagnosed with HF between 2005 and 2017 at the speciality care of the HDSWF were considered for this study. All data were extracted from the speciality care electronic patient register of HDSWF. Inclusion criteria were (i) one of the following International Classification of Diseases, 10th Revision (ICD‐10) codes: HF (I50), cardiomyopathies (I42.0, I42.6, I42.8, and I42.9), hypertension‐induced heart disease (−I11.0, I13.0, and I13.2); (ii) 18 years at the time of the first diagnosis; (iii) resident of the HDSWF; (iv) LVEF values available; and (v) NT‐proBNP ≥ 125 pg/mL, for those with LVEF > 40%.
For all analyses, the index was defined as the date of the first recorded diagnosis code during the study period starting from 1 January 2005, and patients were followed up from that date onwards until 31 December 2017 or death. Data on LVEF were extracted through text mining and required to be at most 3 months apart from index to be used for subgroup stratification by LVEF. To further retrospectively stratify diagnosed HF patients into subgroups, a cut‐off value of LVEF 40% was used for HFrEF (LVEF ≤ 40%). The remaining patients with an available LVEF value (>40%) and available NT‐proBNP values exceeding the cut‐off level ≥ 125 pg/mL were defined in this study into as the following subgroups: HFpEF (LVEF > 50%) and HFmrEF (LVEF > 40–50%) (Figure 1). Other echocardiographic features to validate the HFpEF/HFmrEF patient selection were not available.
Figure 1.

Cohort formation overview. HFmrEF, heart failure with mid‐range ejection fraction; HFpEF, heart failure with preserved ejection fraction; HFrEF, heart failure with reduced ejection fraction; ICD‐10, International Classification of Diseases, 10th Revision; LVEF, left ventricular ejection fraction; NT‐proBNP, N‐terminal pro‐B‐type natriuretic peptide.
The study was approved by the Turku University Hospital administration (permission number 118/2018) and was conducted in accordance with the Declaration of Helsinki. 26
Statistical analyses
Both immediate and main causes of death were assessed. Analyses on CV mortality were based on cause of death diagnoses, I20–I79, in the death certificate. CV‐related hospitalizations were defined as hospitalizations recorded with diagnosis codes I20–I79 as main diagnoses during the inpatient stay. Also, the most common diagnoses related to all‐cause and CV‐related hospitalizations and deaths were assessed. Differences in the frequency of diagnoses between the HFpEF and HFmrEF patients, and HFpEF and HFrEF patients were compared using the χ 2 test.
Patient characteristics associated with hospitalizations and mortality as well as the effect of recurrent hospitalizations on risk of mortality were assessed in multivariable Cox proportional hazards models. For overall survival, the outcome was defined as death (event) or end of study (censoring event). For CV mortality, the outcome was defined as CV‐related death (event), death by other cause (censoring event), or end of study (censoring event). All models were adjusted for age at index and gender and stratified by the patient subgroup defined by the LVEF at baseline. The hazard ratios (HRs), 95% confidence intervals, and P values corresponding to each covariate from the results of the Cox models are reported. Additionally, the timing of recurrent CV hospitalizations was assessed by Kaplan–Meier fits. Differences in mortality and hospitalization rates between the patient subgroups were tested using the log‐rank test on the basis of the Kaplan–Meier estimates.
When predicting all‐cause mortality and CV mortality, the hospitalizations were included as a continuous, time‐varying variable, taking integer values from 0 to 4, while rehospitalizations after the fourth event were not considered. The number of hospitalizations was set to 0 for every patient at index. Hospitalization periods that started on the same day as the previous one ended were considered as one continuous hospitalization. When predicting the risk of rehospitalization with patient characteristics, a recurrent event extension of the Cox model was utilized, where the outcome can occur multiple times per patient. Death and the end of follow‐up (31 December 2017) were treated as censoring events. The baseline characteristics included NT‐proBNP, LVEF, haemoglobin (HB), potassium, and C‐reactive protein as continuous variables; and chronic kidney disease class Chronic Kidney Disease Epidemiology Collaboration, type 2 diabetes (T2D), chronic obstructive pulmonary disease (COPD), hypertension, and atrial fibrillation and flutter as categorical variables. The values of NT‐proBNP, HB, and C‐reactive protein were obtained from the laboratory measurement records in a 6 month time window around the index. The values of NT‐proBNP and C‐reactive protein were log‐transformed (base 2) in order to remedy the skewed distributions of these variables. The co‐morbidities were assessed at any time prior to and 3 months after the index for records of E11 (T2D), J44 (COPD), I48 (hypertension), and I10 (atrial fibrillation and flutter).
LVEF measures over time were extracted through text mining of the electronic patient records. The number of unique LVEF measurements per patient is reported in the Table S1. The cumulative incidence that expresses the risk of an event in a specific time duration of both the deaths and drops in LVEF along with the number of non‐censored patients with no events was estimated, visualized, and tabulated, stratified by the patient subgroup.
In all statistical analyses, a P value < 0.05 was considered statistically significant. All statistical analyses were run using R version 3.5.1 on RStudio Server version 1.1.463, under Ubuntu version 16.04.4 LTS.
Results
Cohort formation and characteristics of the patients
Of the studied population, 92.3% of patients were included based on ICD‐10 code I50, and 7.6% were included based on other ICD‐10 codes (cardiomyopathy: I42.0, I42.6, I42.8, and I42.9; hypertension‐induced heart disease: I11.0, I13.0, and I13.2). Out of the 20 878 patients included in the study on the basis of an ICD‐10 and other primary inclusion criteria, 10 389 (50%) had an available LVEF measure. A total of 4042 patients were observed to have LVEF ≤ 40% and were considered as HFrEF patients. From the remaining patients (LVEF > 40%), 4590 had available NT‐proBNP value exceeding the applied cut‐off level (≥125 pg/mL) and were further divided into HFpEF and HFmrEF subgroups according to their LVEF (Figure 1). The follow‐up time was 15 022, 4962, and 10 097 patient‐years for HFrEF, HFmrEF, and HFpEF subgroups, respectively.
HFpEF patients were more frequently female and, on average, 5 years older than HFrEF patients (Table 1). Diagnoses of co‐morbidities, for example, atrial fibrillation and flutter, and hypertension were also more common in HFpEF patients (Table 1).
Table 1.
Baseline characteristics of patients with heart failure stratified by left ventricular ejection fraction (LVEF) into HFrEF (≤40%), HFmrEF (>40–50%), and HFpEF (>50%) phenotypes.
| Variable | HFrEF | HFmrEF | HFpEF | Missing (%) | P value (P vs. r) * | P value (P vs. mr) * | |
|---|---|---|---|---|---|---|---|
| n | 4042 | 1468 | 3122 | ||||
| Female, n (%) | 1242 (30.7) | 626 (42.6) | 1755 (56.2) | 0.0 | <0.001 | <0.001 | |
| Age, years, mean (SD) | 70.76 (12.25) | 74.21 (11.58) | 75.20 (10.98) | 0.0 | <0.001 | 0.005 | |
| LVEF at index, mean (SD) | 31.29 (6.95) | 46.56 (2.80) | 62.70 (7.46) | 0.0 | <0.001 | <0.001 | |
| P‐proBNP, pg/mL, median [IQR] | 4580.00 [2060.00, 9765.00] | 3470.00 [1510.00, 7515.00] | 2700.00 [1200.00, 5770.00] | 10.9 | <0.001 | <0.001 | |
| P‐proBNP < 125 pg/mL (n) | 29 (0.9) | 0 (0.0) | 0 (0.0) | 10.9 | <0.001 | — | |
| P‐proBNP < 300 pg/mL (n) | 84 (2.7) | 46 (3.1) | 158 (5.1) | 10.9 | <0.001 | 0.004 | |
| Haemoglobin, mg/L, median [IQR] | 134.00 [120.00, 147.00] | 127.00 [113.00, 141.00] | 123.00 [109.00, 137.00] | 1.0 | <0.001 | <0.001 | |
| Potassium, mmol/L, median [IQR] | 4.10 [3.80, 4.40] | 4.10 [3.80, 4.40] | 4.10 [3.80, 4.50] | 0.7 | 0.001 | 0.333 | |
| C‐reactive protein, mg/L, median [IQR] | 10.00 [4.00, 28.00] | 10.00 [4.00, 28.00] | 10.00 [4.00, 35.00] | 5.9 | 0.005 | 0.107 | |
| Creatinine, μmol/L, median [IQR] | 93.00 [76.00, 115.00] | 91.00 [74.00, 117.00] | 86.00 [70.00, 114.00] | 0.6 | <0.001 | <0.001 | |
| CKD‐EPI eGFR, mL/min/1.73 m2, median [IQR] | 66.47 [48.96, 83.40] | 62.66 [46.34, 79.66] | 64.23 [45.02, 82.07] | 0.6 | <0.001 | 0.392 | |
| CKD, n (%) | 1 | 656 (16.4) | 181 (12.4) | 423 (13.6) | 0.6 | <0.001 | 0.320 |
| 2 | 1751 (43.8) | 620 (42.4) | 1329 (42.7) | ||||
| 3 | 1305 (32.6) | 529 (36.2) | 1048 (33.6) | ||||
| 4 | 216 (5.4) | 107 (7.3) | 242 (7.8) | ||||
| 5 | 73 (1.8) | 26 (1.8) | 73 (2.3) | ||||
| Diabetes (E11), n (%) | 1054 (26.1) | 420 (28.6) | 872 (27.9) | 0.0 | 0.084 | 0.658 | |
| COPD (J44), n (%) | 410 (10.1) | 151 (10.3) | 352 (11.3) | 0.0 | 0.133 | 0.342 | |
| Atrial fibrillation and flutter (I48), n (%) | 1768 (43.7) | 802 (54.6) | 1694 (54.3) | 0.0 | <0.001 | 0.838 | |
| Hypertension (I10), n (%) | 1805 (44.7) | 810 (55.2) | 2000 (64.1) | 0.0 | <0.001 | <0.001 | |
CKD, chronic kidney disease; CKD‐EPI, Chronic Kidney Disease Epidemiology Collaboration [equation for estimated glomerular filtration rate (eGFR)]; COPD, chronic obstructive pulmonary disease; HFmrEF, HF with mid‐range ejection fraction; HFpEF, HF with preserved ejection fraction; HFrEF, HF with reduced ejection fraction; IQR, inter‐quartile range; P‐proBNP, plasma N‐terminal pro‐B‐type natriuretic peptide; SD, standard deviation.
P vs. r, HFpEF vs. HFrEF; P vs. mr, HFpEF vs. HFmrEF.
Timing of hospitalization
HF patients were followed up for up to four rehospitalizations. The most common main diagnoses associated with CV hospitalizations in HF patients as a group were HF, atrial fibrillation and flutter, acute myocardial infarction, atherosclerosis, and chronic ischaemic heart disease (Table S2, shown for the 10 most prevalent diagnoses). However, there were statistically significant differences in the frequency of diagnoses between HFpEF and HFmrEF or HFrEF patients (Table S2). Compared with HFrEF or HFmrEF, atrial fibrillation and flutter were more often recorded during hospitalizations among HFpEF patients (16% vs. 12% in HFrEF/HFmrEF) (Table S2). However, hospitalized HFpEF patients were less often diagnosed with chronic ischaemic heart disease (7% in HFpEF vs. 11% in HFmrEF and 14% in HFrEF) and angina pectoris (2% in HFpEF vs. 3% in HFrEF and 4% in HFmrEF) (Table S2). In addition, the frequency of atherosclerosis, nonrheumatic aortic valve disorders, cardiomyopathy, and paroxysmal tachycardia‐related hospitalizations was significantly different between hospitalized HFpEF and HFrEF (Table S2).
The Kaplan–Meier estimates show that there was a statistically significant difference in the first rehospitalization rate among the HF subgroups with HFrEF patients being rehospitalized slightly earlier at any time point during the 5 years following the index, compared with HFpEF and HFmrEF patients (P = 0.005, Figure 2 and Table S3). However, the subsequent rehospitalization rates did not differ between the subgroups (Figure S1), although an increase in the CV hospitalization rate in each group was noted for those that had at least one rehospitalization event reported (Figure 3 and Table S3).
Figure 2.

Kaplan–Meier fit of the time until the first rehospitalization in heart failure patients stratified into HFrEF (red), HFmrEF (blue), and HFpEF (black) phenotypes. The ‘Number at risk’ table represents the number of patients who have not yet undergone their next rehospitalization (the event described in the corresponding plot). HFmrEF, heart failure with mid‐range ejection fraction; HFpEF, heart failure with preserved ejection fraction; HFrEF, heart failure with reduced ejection fraction.
Figure 3.
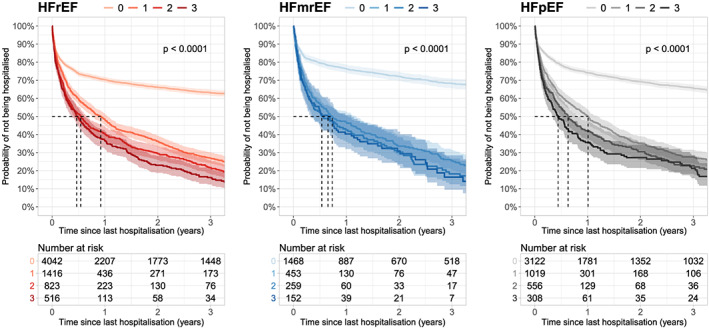
Kaplan–Meier fit of time to next rehospitalization event among heart failure patients stratified by the number of previous hospitalization events and LVEF phenotype. HFmrEF, heart failure with mid‐range ejection fraction; HFpEF, heart failure with preserved ejection fraction; HFrEF, heart failure with reduced ejection fraction; LVEF, left ventricular ejection fraction.
During the 5 years following the index, 40% of HFrEF patients were rehospitalized, while the corresponding numbers for HFpEF and HFmrEF patients were 39% and 37%, respectively (Table S3, the first rehospitalization event). Of those patients who were hospitalized once, a second CV rehospitalization occurred in 82% of HFrEF patients during the following 5 years of the first rehospitalization, while the corresponding numbers were 82% and 85% for HFpEF and HFmrEF patients, respectively (Table S3, second rehospitalization event).
Factors associated with recurrent hospitalizations
The effect of pre‐selected variables of interest on hospitalizations was assessed in a Cox proportional hazards model using recurrent event extension and including up to four CV hospitalizations. The analysis shows that rehospitalization in HFmrEF and HFrEF patients is less likely in women and in patients with higher estimated glomerular filtration rate at the selected significance level (Table 2). Diabetes was associated with increased risk of rehospitalization in HFrEF at the selected significance level (Table 2). In addition, HFrEF patients with atrial fibrillation were less likely to be rehospitalized than were HFrEF patients in sinus rhythm, although this is likely affected by a competing risk with death confounding the association (Table 2). The competing risk with death may also explain the findings for COPD in HFmrEF patients. In HFpEF patients, none of the tested variables were significantly associated with the risk of CV rehospitalization.
Table 2.
Cox regression model of factors associated with cardiovascular rehospitalizations in heart failure patients stratified by left ventricular ejection fraction (LVEF) into HFrEF (≤40%), HFmrEF (>40–50%), and HFpEF (>50%) phenotypes.
| Variable | HFrEF | HFmrEF | HFpEF | |||
|---|---|---|---|---|---|---|
| HR (95% CI) | P value | HR (95% CI) | P value | HR (95% CI) | P value | |
| Age | 1 (0.99–1.01) | 0.460 | 0.99 (0.98–1.00) | 0.130 | 0.99 (0.98–1.00) | 0.180 |
| Atrial fibrillation and flutter (I48) | 0.77 (0.65–0.92) | 0.004 | 0.83 (0.64–1.06) | 0.140 | 0.97 (0.81–1.16) | 0.750 |
| COPD (J44) | 1.07 (0.83–1.37) | 0.600 | 0.67 (0.45–0.99) | 0.046 | 0.88 (0.68–1.13) | 0.310 |
| Diabetes (E11) | 1.2 (1.00–1.45) | 0.049 | 0.97 (0.74–1.26) | 0.810 | 1.1 (0.89–1.35) | 0.370 |
| LVEF at index | 1.01 (0.99–1.02) | 0.230 | 1.03 (0.98–1.07) | 0.230 | 1.01 (0.99–1.02) | 0.390 |
| eGFR | 0.99 (0.99–1.00) | 0.018 | 0.99 (0.99–1.00) | 0.003 | 1 (0.99–1.00) | 0.380 |
| Gender = Female | 0.65 (0.54–0.79) | <0.001 | 0.76 (0.59–0.99) | 0.039 | 0.85 (0.7–1.02) | 0.080 |
| HB | 1 (1–1.01) | 0.830 | 1.01 (1.00–1.01) | 0.150 | 1 (1–1.01) | 0.730 |
| Hypertension (I10) | 0.97 (0.81–1.16) | 0.740 | 1.08 (0.84–1.39) | 0.540 | 1.04 (0.86–1.25) | 0.700 |
| Potassium | 0.99 (0.85–1.15) | 0.880 | 1.19 (0.93–1.52) | 0.180 | 0.96 (0.83–1.12) | 0.630 |
| log2(NT‐proBNP) | 0.97 (0.92–1.03) | 0.360 | 0.96 (0.89–1.05) | 0.370 | 1.02 (0.96–1.08) | 0.540 |
| log2(C‐reactive protein) | 0.93 (0.89–0.97) | 0.001 | 0.99 (0.92–1.06) | 0.730 | 0.97 (0.92–1.02) | 0.240 |
COPD, chronic obstructive pulmonary disease; CI, confidence interval; eGFR, estimated glomerular filtration rate; HB, haemoglobin; HFmrEF, HF with mid‐range ejection fraction; HFpEF, HF with preserved ejection fraction; HFrEF, HF with reduced ejection fraction; HR, hazard ratio; NT‐proBNP, N‐terminal pro‐B‐type natriuretic peptide.
Cardiovascular and all‐cause mortality
According to the instructions given by the Finnish authorities to the physicians for the fulfilment of death certificates, the main cause of death should be the disease that has put into action the events resulting in death; that is, for HF patients, this could be COPD or myocardial infarction. Symptomatic disorders, such as HF, are not allowed as a main cause of death, if the aetiology of the condition is known. In addition, an immediate cause of death is given if it differs from the main cause. Accordingly, the most prevalent cause associated with CV mortality in all HF phenotypes was chronic ischaemic heart disease, followed by acute myocardial infarction (Table S2, shown for the 10 most prevalent causes of CV death). While cardiomyopathy was the third most prevalent cause associated with CV mortality in HFrEF, it was only the 10th most prevalent in HFpEF patients. In fact, statistically significant differences in the frequency of almost all prevalent diagnoses associated with CV mortality were observed between HFpEF and HFrEF phenotypes. In comparison, such significant differences were not observed between HFpEF and HFmrEF (Table S2). Compared with HFrEF, chronic ischaemic heart disease (44% vs. 50%), acute myocardial infarction (21% vs. 26%), and cardiomyopathy (2% vs. 9%) were less frequent causes of CV death in HFpEF (Table S2). On the other hand, aortic and mitral valve disorders (together 15% vs. 5%) and other remaining causes of CV death with significantly different prevalences were more frequent in HFpEF compared with HFrEF.
Chronic ischaemic heart disease (37% in HFpEF, 46% in HFrEF, and 45% in HFmrEF) and acute myocardial infarction (18% in HFpEF, 23% in HFrEF, and 20% in HFmrEF) were also the most common diagnoses associated with all‐cause mortality in HF patients as a group (Table S2). Significant differences were mostly observed between HFpEF and HFrEF phenotypes only (Table S2).
The timing of all‐cause mortality and CV mortality assessed by Kaplan–Meier fits is presented in Table S4 and illustrated in Figure 4. Patients with HFpEF had the poorest overall survival, whereas the causes of deaths were less likely associated with CV events compared with HFmrEF and HFrEF (Figure 4, and Table S4).
Figure 4.

All‐cause mortality (left) and CV mortality (right) in heart failure patients stratified by LVEF phenotype. CV, cardiovascular; HFmrEF, heart failure with mid‐range ejection fraction; HFpEF, heart failure with preserved ejection fraction; HFrEF, heart failure with reduced ejection fraction; LVEF, left ventricular ejection fraction.
To conclude, HFpEF phenotype clearly differs from HFrEF in terms of the distribution of causes of death.
Factors affecting the risk of all‐cause mortality and cardiovascular mortality
In all patient groups, each additional hospitalization was associated with a two‐fold increased risk of death and a 2.2‐ to 2.3‐fold increase in the risk of CV death (Table 3). This association was similar between HFrEF, HFmrEF, and HFpEF. Demographic and clinical factors associated with all‐cause and CV mortality in each group are shown in Table 4. Assessed factors associated with all‐cause mortality were higher age and NT‐proBNP concentrations, where a doubling (log2) in concentration was associated with an increased risk of death (HR 1.13 in HFmrEF, 1.18 in HFpEF, and 1.14 in HFrEF; Table 4). In addition, female gender was associated with a risk reduction in all groups (Table 4). The same factors remained significant when assessing CV mortality, even if the relationship between NT‐proBNP and CV mortality was stronger than that for all‐cause mortality (HR 1.18 in HFmrEF, 1.28 in HFpEF, and 1.18 in HFrEF; Table 4).
Table 3.
Cox regression model of the association of rehospitalizations, age, and gender with all‐cause mortality and CV mortality in heart failure patients stratified by left ventricular ejection fraction into HFrEF (≤40%), HFmrEF (>40–50%), and HFpEF (>50%) phenotypes.
| Type | Group | Variable | HR (95% CI) | P value |
|---|---|---|---|---|
| All‐cause mortality | HFrEF | Number of rehospitalizations | 2.06 (1.98–2.15) | <0.001 |
| Gender = Female | 0.94 (0.84–1.05) | 0.280 | ||
| Age | 1.06 (1.05–1.06) | <0.001 | ||
| HFmrEF | Number of rehospitalizations | 2.00 (1.87–2.14) | <0.001 | |
| Gender = Female | 0.77 (0.64–0.93) | 0.006 | ||
| Age | 1.06 (1.05–1.07) | <0.001 | ||
| HFpEF | Number of rehospitalizations | 2.03 (1.93–2.13) | <0.001 | |
| Gender = Female | 0.82 (0.72–0.92) | 0.001 | ||
| Age | 1.05 (1.04–1.05) | <0.001 | ||
| CV mortality | HFrEF | Number of rehospitalizations | 2.26 (2.15–2.36) | <0.001 |
| Gender = Female | 0.93 (0.81–1.06) | 0.290 | ||
| Age | 1.06 (1.05–1.07) | <0.001 | ||
| HFmrEF | Number of rehospitalizations | 2.23 (2.06–2.41) | <0.001 | |
| Gender = Female | 0.79 (0.63–1.00) | 0.049 | ||
| Age | 1.07 (1.05–1.08) | <0.001 | ||
| HFpEF | Number of rehospitalizations | 2.24 (2.12–2.38) | <0.001 | |
| Gender = Female | 0.82 (0.7–0.97) | 0.019 | ||
| Age | 1.06 (1.05–1.07) | <0.001 |
CI, confidence interval; HFmrEF, HF with mid‐range ejection fraction; HFpEF, HF with preserved ejection fraction; HFrEF, HF with reduced ejection fraction; HR, hazard ratio.
Table 4.
Cox regression model of demographic and clinical factors associated with all‐cause and cardiovascular (CV) mortality in heart failure patients stratified by left ventricular ejection fraction (LVEF) into HFrEF (≤40%), HFmrEF (>40–50%), and HFpEF (>50%) phenotypes.
| Variable | HFrEF | HFmrEF | HFpEF | |||
|---|---|---|---|---|---|---|
| HR (95% CI) | P value | HR (95% CI) | P value | HR (95% CI) | P value | |
| All‐cause mortality | ||||||
| Age, years | 1.05 (1.04–1.05) | <0.001 | 1.06 (1.05–1.07) | <0.001 | 1.05 (1.04–1.06) | <0.001 |
| Atrial fibrillation and flutter (I48) | 0.89 (0.81–0.99) | 0.031 | 0.89 (0.76–1.03) | 0.11 | 0.93 (0.84–1.03) | 0.15 |
| COPD (J44) | 1.47 (1.27–1.7) | <0.001 | 1.64 (1.3–2.07) | <0.001 | 1.52 (1.3–1.76) | <0.001 |
| Diabetes (E11) | 1.36 (1.21–1.52) | <0.001 | 1.06 (0.89–1.25) | 0.54 | 1.13 (1.01–1.27) | 0.031 |
| LVEF at index | 1 (0.99–1) | 0.44 | 1.01 (0.98–1.04) | 0.41 | 1 (1–1.01) | 0.21 |
| eGFR (mL/min/1.72 m2) | 0.99 (0.99–1) | <0.001 | 1 (0.99–1) | 0.062 | 1 (1–1) | 0.19 |
| Gender = Female | 0.85 (0.76–0.96) | 0.006 | 0.71 (0.61–0.83) | <0.001 | 0.77 (0.7–0.86) | <0.001 |
| Haemoglobin (mg/L) | 0.99 (0.99–0.99) | <0.001 | 0.99 (0.99–0.99) | <0.001 | 0.99 (0.99–1) | <0.001 |
| Hypertension (I10) | 0.9 (0.81–1) | 0.042 | 0.99 (0.85–1.16) | 0.9 | 0.87 (0.78–0.96) | 0.008 |
| Potassium (mmol/L) | 1.03 (0.93–1.14) | 0.63 | 1.08 (0.93–1.25) | 0.34 | 1.05 (0.96–1.15) | 0.26 |
| log2(NT‐proBNP) | 1.14 (1.1–1.19) | <0.001 | 1.13 (1.08–1.19) | <0.001 | 1.18 (1.14–1.22) | <0.001 |
| log2(C‐reactive protein) | 1.06 (1.03–1.09) | <0.001 | 1.04 (1–1.08) | 0.067 | 1.06 (1.03–1.08) | <0.001 |
| CV mortality | ||||||
| Age, years | 1.05 (1.05–1.06) | <0.001 | 1.06 (1.05–1.08) | <0.001 | 1.07 (1.06–1.08) | <0.001 |
| Atrial fibrillation and flutter (I48) | 0.87 (0.77–0.98) | 0.021 | 0.84 (0.69–1.01) | 0.066 | 0.9 (0.79–1.03) | 0.120 |
| COPD (J44) | 1.12 (0.92–1.36) | 0.250 | 1.2 (0.87–1.66) | 0.280 | 1.14 (0.91–1.44) | 0.250 |
| Diabetes (E11) | 1.52 (1.33–1.74) | <0.001 | 1.21 (0.98–1.49) | 0.078 | 1.34 (1.16–1.56) | <0.001 |
| LVEF at index | 0.99 (0.98–1) | 0.140 | 1.02 (0.98–1.05) | 0.330 | 1 (0.99–1.01) | 0.400 |
| eGFR | 0.99 (0.99–0.99) | <0.001 | 1 (0.99–1) | 0.056 | 1 (0.99–1) | 0.110 |
| Gender = Female | 0.83 (0.72–0.95) | 0.005 | 0.72 (0.59–0.88) | 0.001 | 0.75 (0.65–0.86) | <0.001 |
| Haemoglobin (mg/L) | 0.99 (0.99–1) | <0.001 | 0.99 (0.99–1) | 0.050 | 1 (0.99–1) | 0.022 |
| Hypertension (I10) | 0.82 (0.72–0.93) | 0.002 | 1.01 (0.83–1.23) | 0.880 | 0.83 (0.72–0.95) | 0.008 |
| Potassium (mmol/L) | 1.03 (0.91–1.16) | 0.620 | 1.12 (0.94–1.35) | 0.210 | 1.07 (0.95–1.2) | 0.280 |
| log2(NT‐proBNP) | 1.18 (1.13–1.23) | <0.001 | 1.18 (1.11–1.26) | <0.001 | 1.28 (1.22–1.34) | <0.001 |
| log2(C‐reactive protein) | 1.04 (1–1.07) | 0.030 | 1.04 (0.99–1.09) | 0.130 | 1.03 (1–1.06) | 0.059 |
CI, confidence interval; COPD, chronic obstructive pulmonary disease; eGFR, estimated glomerular filtration rate; HFmrEF, HF with mid‐range ejection fraction; HFpEF, HF with preserved ejection fraction; HFrEF, HF with reduced ejection fraction; HR, hazard ratio; NT‐proBNP, N‐terminal pro‐B‐type natriuretic peptide.
Left ventricular ejection fraction phenotype changes over time
The dynamics of LVEF measurements in HFpEF and HFmrEF patients towards the HFrEF phenotype was evaluated by plotting LVEF measures progressing below the LVEF cut‐off value against follow‐up time stratified by patient group and gender (Figure S2). The plot shows that LVEF measure is dynamic also in this patient cohort, in HFmrEF patients in particular. In addition, patients are as a group rather heterogeneous in terms of the pattern of assessed LVEF changes recorded over time (Figure S2).
The probability of LVEF dropping to ≤40% in the patients with HFmrEF and HFpEF at index was analysed in a model together with death as a competing outcome (see Methods). In Figure S3, the cumulative incidence of deaths or a drop in LVEF to ≤40% is presented. Five years after the index, 50% of HFpEF patients had died and 8% had progressed to an HFrEF phenotype (LVEF ≤ 40%), whereas in the HFmrEF group, the corresponding numbers were 41% and 22%, respectively (Figure S3 and Table S5). After 10 years of follow‐up, 10% in the HFpEF group had an LVEF ≤ 40% recorded; however, there is likely to be a greater influence of the competing risk of death as 70% of patients had died by this time point (Figure S3 and Table S5). Results of a competing risk model analogous to Cox model highlighted the protective association of female gender and age with the LVEF drop, although the protective association of higher age can be associated with a competing outcome, which is increased death among older patients (Table S6).
Discussion
This study was carried out to increase the epidemiological understanding of HF patients across the LVEF range with an emphasis on the potentially specific characteristics of the less well‐understood HFpEF phenotype.
Here, hospitalization and mortality of HF patients, stratified by LVEF into HFpEF (>50%), HFmrEF (>40–50%), and HFrEF (≤40%) phenotypes, were determined by utilizing a large, robust electronic patient register of HDSWF. The analyses of 8632 patients, including 4590 patients with LVEF > 50% or >40–50%, showed the association of recurrent hospitalizations with mortality in HF patients and revealed similarities but also differences between the HF phenotypes.
Hospitalization and mortality
Hospitalizations were frequent among the HF patients, with 39% of HFpEF patients hospitalized at least once due to a CV cause within 5 years from index, which was close to the corresponding estimate for HFrEF and HFmrEF patients (40% and 37%, respectively) and previously published estimates (reviewed in Dunlay et al. 19 and Oktay et al. 20 ). Of note, in this patient cohort, the proportion of HF hospitalizations due to HFrEF was lower than in the previous broad report (47% in 2010). 27 This could be due to the difference in the number of patients studied, but it may also reflect the observed decreasing trend for the hospitalization in HFrEF, as this study included patients diagnosed within 2005–2017. Hospitalized HFpEF patients differed from HFrEF patients in terms of the frequency of most prevalent diagnoses associated with CV hospitalizations.
The rate of rehospitalization increased after the first rehospitalization, with a median time decreasing from not reached for the first rehospitalization to 1.0, 0.6, and 0.4 years for the second, third, and fourth rehospitalizations, respectively, in HFpEF patients. A similar increase in the event rate of recurrent hospitalizations was also evident in the other HF phenotypes. This is in line with the known epidemiology of HF, 20 but this study adds to scientific knowledge with the longer follow‐up time and specific insight on HFpEF patients.
Analysing factors associated with CV rehospitalization, female gender, and better kidney function were found to be protective against rehospitalizations in HFmrEF and HFrEF. However, in the HFpEF group, the factors assessed were not associated with rehospitalizations, although a trend for the protective role of female gender was observed also in this patient group (HR 0.85, P value = 0.080). The factors assessed were pre‐selected, which may introduce a bias of excluding potential HFpEF‐specific risk factors from the analysis.
These findings suggest that disease progression, with increasing frequency of hospitalizations over time, is similar by LVEF phenotype, but there may be some differences in patient characteristics and their relation to disease severity.
Unadjusted all‐cause mortality was higher in patients with HFpEF (46% alive at 5 years) compared with HFmrEF or HFrEF groups (49% and 51% alive at 5 years, respectively). CV‐related causes of death were less prevalent in HFpEF patients than in the other groups, which is in line with previous studies. 19 Although CV mortality was less frequent in HFpEF patients, it was highly associated with NT‐proBNP concentrations, where a doubling (log2) in a concentration clearly increased the risk of CV mortality. Interestingly, this increase in risk was higher in HFpEF than in HFmrEF or HFrEF. In all subgroups, NT‐proBNP was associated with an increased risk of all‐cause mortality as well. This is in line with the previous 1 year study showing that NT‐proBNP, independent of LVEF, is a strong predictor of mortality in consecutively hospitalized HFpEF and HFrEF patients stratified using a single cut‐off value of LVEF (45%). 28
Rehospitalizations were strongly associated with all‐cause and CV mortality in all LVEF subgroups when adjusted for age and gender. The relationship was consistent between the HF subgroups. The relationship between history of prior hospitalizations and increased risk of mortality has been observed before in HF patients, both in clinical trials and in real‐world data. 18 , 22 , 23 , 24 , 25 However, studies to date have mainly focused on overall HF patients, with a paucity of data specific to HFpEF and HFmrEF. In a recent observational study utilizing a large cohort of HF patients of the Clinical Practice Research Datalink database in the UK, the increased risk of CV mortality with rehospitalizations was shown in HF patients as a group, with an increase in HR of 2.8–6.3 for the first, second, and fourth rehospitalizations (21). This is lower than the corresponding HR of 2.2–24 in our study. Recent data from the large multicentre PARAGON‐HF trial in HFpEF patients 17 , 29 showed that patients who were recently hospitalized or had multiple prior hospitalizations were associated with higher risk of overall rehospitalization and CV death. 18 Lee et al. 25 and later Bello et al. 24 also included data specific to HFpEF patients, although with variable LVEF cut‐off level. Lee et al. followed up newly admitted HF patients (n = 3008 and 1187 for HFrEF and HFpEF, respectively) and reported that in HFpEF, the adjusted relative CV mortality rate increased from 3.7 for the first rehospitalization to 9.7 for the fourth rehospitalization in HFpEF and was also close to that in HFrEF patients (3.8–12.6). 25 Bello et al. reported an analysis of the CHARM trial and followed up HF patients stratified according to the history of hospitalizations before the enrolment (n = 4572 and 3021 for HFrEF and HFpEF, respectively). The increased risk of CV death or HF hospitalization due to prior history of hospitalizations was similar between the phenotypes (adjusted HR 1.56–1.59), although higher event rates were observed for HFrEF. 24 Variable risk ratios may be attributable to differences in study design and, potentially, in patient characteristics and setting. Importantly, this study adds to existing scientific knowledge by providing data specific for HFpEF and HFmrEF subgroups from a large, robust real‐world data source.
Progression from heart failure with preserved ejection fraction/heart failure with mid‐range ejection fraction to heart failure with reduced ejection fraction (left ventricular ejection fraction drop)
To our knowledge, this study is one of only a few studies with robust data over an extensive follow‐up period (10 years) assessing the LVEF decline in both HFpEF and HFmrEF patients, giving new perspectives on LVEF stability over time. Indeed, this study shows that during the 10 years following the index date, 26% of HFmrEF patients and 10% of HFpEF patients had progressed to an HFrEF phenotype (LVEF ≤ 40%). However, death was a competing risk as an outcome, and a significant proportion of patients with HFmrEF/HFpEF died within the study period. Previous reports on the dynamics of LVEF in HFpEF and/or HFmrEF patients have shown that a range of patients do undergo dynamic changes in LVEF, but the results on the relative number of patients (HFpEF in particular) have been variable. 10 , 11 , 12 , 13 , 14 It is unclear whether this discrepancy is due to the differences in the follow‐up, number of patients, or lack of fixed prospective protocols for LVEF measurements. In addition, LVEF measure of each patient can be affected by medications, co‐morbidities, gender, ethnicity, and natural dynamics of the value. Here, LVEF measures were text mined and not recorded using fixed protocol. Also, the effects of co‐morbidities and therapy were not evaluated, and other echocardiographic features were not available to validate the accurate LVEF status in each measurement.
Compared with prospective reports 11 , 12 and the current study (10 years' follow‐up of 3122 HFpEF and 1468 HFmrEF patients), previous retrospective studies with limited follow‐up (5 years) and number of patients (n = 559/1613) observed significantly more patients dropping from HFpEF to HFrEF phenotype (33% in Clarke et al. 13 ; 25% in Dunlay et al. 14 ). A prospective study by Lupón et al. 12 found that during the follow‐up of up to 11 years, only 1.6% of HFpEF patients progressed to HFrEF (and 9.5% to HFmrEF). These data were from a small cohort (n = 126) and may have been associated with selection bias owing to requirement for active consent. Tsuji et al. 11 investigated more HFpEF patients (n = 2154), but with a limited prospective follow‐up (3 years), and observed that 4% of HFpEF patients transitioned to HFrEF phenotype (and 8% to HFmrEF), which is close to the estimate of the current study (7% by 3 years and 10% by 10 years).
Both short‐term and long‐term follow‐up studies reporting on the dynamic changes in LVEF of HFmrEF patients suggest that these patients may undergo phenotype transition in either direction with 21–25% and 36–45% of HFmrEF patients changing to HFrEF and HFpEF phenotypes, respectively. 10 , 11 The current, retrospective study only assessed the transition from HFmrEF to HFrEF phenotype but from a large data source. Nevertheless, the number of patients (26% by 10 years) progressing was almost comparable with the previous, prospective studies with limited number of patients (n = 187 and 596).
Limitations and conclusions
There are several limitations typically associated with retrospective database analyses, as well as those associated with cohort selection. These include the risk that some information may not have been consistently recorded for all patients, potentially affecting the population size and other outcomes. Other limitations include that the HFpEF group was selected based on a diagnosis, elevated NT‐proBNP, and LVEF data. However, other echocardiographic features to validate the HFpEF patient selection were not available.
To conclude, in HF patients, and HFpEF patients especially, there is a large unmet need to effectively manage the condition. CV rehospitalizations and higher NT‐proBNP levels were significantly associated with all‐cause and CV mortality. Clinically, this indicates that patients with high NT‐proBNP and history of hospitalizations represent higher risk groups. In addition, this retrospective study gives a more robust estimate from a large cohort on LVEF decline. In the future, larger, preferably prospective, patient cohorts should be utilized and extend to the assessment of the prognostic impact of dynamic LVEF changes.
Conflict of interest
J.H., R.S., S.C., and C.P. are employed by Novartis. MIL and ST are employed by Medaffcon Oy (Espoo, Finland). Heikki Ukkonen has nothing to declare.
Funding
This work was supported by Novartis Pharmaceuticals.
Supporting information
Figure S1. Kaplan–Meier fit of the timing of all analysed recurrent hospitalisations events (1st‐4th) stratified by LVEF into HFrEF (red), HFpEF (black), and HFmrEF (blue) phenotypes. The ‘Number at risk’ table represents the number of patients that have not yet undergone their next rehospitalisation (the event described in the corresponding plot).
Figure S2 Visualisation of the LVEF progression below 40% in heart failure patients stratified by LVEF phenotype and gender. The patients are ordered by the length of follow up i.e. time since index until end of follow up (death or study end). Multiple patients had LVEF measurements prior to index (time point 0). Blue line, LVEF >40% in the latest measurement; red line, LVEF <40% in the latest measurement.
Figure S3 Competing risk plot of the cumulative incidence of mortality (red line) compared to an event with a drop in LVEF to ≤40% (black line) in heart failure patients with HFmrEF (solid line) and HFpEF (dashed line) phenotype at index. The cumulative incidence expresses the proportion of patients in which a specific event occurs. Numbers at the bottom of the graph represent the number of patients with no events (death, a drop in LVEF to ≤40%, or end of follow up) at each time point.
Table S1 Number of left ventricular ejection fraction measurements per patient
Table S2 Ten most frequent main diagnoses associated with cardiovascular (CV) hospitalisations, all‐cause mortality, and CV mortality in heart failure patients stratified by left ventricular ejection fraction into HFrEF (≤40%), HFmrEF (>40–50%), and HFpEF (>50%) phenotypes.
Table S3 Kaplan–Meier fit of the probabilities of not being hospitalised given 0, 1, 2, and 3 previous rehospitalisations, among heart failure patients stratified by left ventricular ejection fraction into HFrEF (≤40%), HFmrEF (>40–50%), and HFpEF (>50%) phenotypes.
Table S4 Kaplan–Meier estimates of all‐cause mortality and cardiovascular (CV) mortality in heart failure patients stratified by left ventricular ejection fraction into HFrEF (≤40%), HFmrEF (>40–50%), and HFpEF (>50%) phenotypes.
Table S5 Cumulative incidence of deaths and drop in left ventricular ejection fraction (LVEF) to ≤40% in heart failure patients with HFpEF or HFmrEF phenotype at index.
Table S6 The association of gender, age and left ventricular ejection fraction (LVEF) at index with the risk of LVEF dropping to ≤40% in HFmrEF and HFpEF patients in the competing risk model.
Acknowledgements
Raquel Lahoz is acknowledged for valuable advice and review of the manuscript. Kristiina Uusi‐Rauva is acknowledged for providing medical writing services on behalf of Medaffcon (Espoo, Finland). Juha‐Matti Varjonen at Auria Clinical Informatics is acknowledged for data extraction.
Huusko, J. , Tuominen, S. , Studer, R. , Corda, S. , Proudfoot, C. , Lassenius, M. , and Ukkonen, H. (2020) Recurrent hospitalizations are associated with increased mortality across the ejection fraction range in heart failure. ESC Heart Failure, 7: 2406–2417. 10.1002/ehf2.12792.
References
- 1. Chang PP, Wruck LM, Shahar E, Rossi JS, Loehr LR, Russell SD, Agarwal SK, Konety SH, Rodriguez CJ, Rosamond WD. Trends in hospitalizations and survival of acute decompensated heart failure in four US communities (2005–2014): ARIC Study Community Surveillance. Circulation 2018; 138: 12–24. [DOI] [PMC free article] [PubMed] [Google Scholar]
- 2. Benjamin EJ, Muntner P, Alonso A, Bittencourt MS, Callaway CW, Carson AP, Chamberlain AM, Chang AR, Cheng S, Das SR, Delling FN, Djousse L, Elkind MSV, Ferguson JF, Fornage M, Jordan LC, Khan SS, Kissela BM, Knutson KL, Kwan TW, Lackland DT, Lewis TT, Lichtman JH, Longenecker CT, Loop MS, Lutsey PL, Martin SS, Matsushita K, Moran AE, Mussolino ME, O'Flaherty M, Pandey A, Perak AM, Rosamond WD, Roth GA, Sampson UKA, Satou GM, Schroeder EB, Shah SH, Spartano NL, Stokes A, Tirschwell DL, Tsao CW, Turakhia MP, VanWagner LB, Wilkins JT, Wong SS, Virani SS. Heart disease and stroke statistics—2019 update: a report from the American Heart Association. Circulation 2019; 139: e56–e528. [DOI] [PubMed] [Google Scholar]
- 3. Cook C, Cole G, Asaria P, Jabbour R, Francis DP. The annual global economic burden of heart failure. Int J Cardiol 2014; 171: 368–376. [DOI] [PubMed] [Google Scholar]
- 4. Ponikowski P, Voors AA, Anker SD, Bueno H, Cleland JGF, Coats AJS, Falk V, González‐Juanatey JR, Harjola VP, Jankowska EA, Jessup M, Linde C, Nihoyannopoulos P, Parissis JT, Pieske B, Riley JP, Rosano GMC, Ruilope LM, Ruschitzka F, Rutten FH, van der Meer P, Authors/Task Force Members, Document Reviewers . 2016 ESC Guidelines for the diagnosis and treatment of acute and chronic heart failure: the Task Force for the diagnosis and treatment of acute and chronic heart failure of the European Society of Cardiology (ESC). Developed with the spec. Eur J Heart Fail 2016; 18: 891–975. [DOI] [PubMed] [Google Scholar]
- 5. Yancy CW, Jessup M, Bozkurt B, Butler J, Casey DE, Drazner MH, Fonarow GC, Geraci SA, Horwich T, Januzzi JL, Johnson MR, Kasper EK, Levy WC, Masoudi FA, McBride PE, McMurray JJV, Mitchell JE, Peterson PN, Riegel B, Sam F, Stevenson LW, Tang WHW, Tsai EJ, Wilkoff BL. 2013 ACCF/AHA Guideline for the Management of Heart Failure. J Am Coll Cardiol 2013; 62: e147–e239. [DOI] [PubMed] [Google Scholar]
- 6. Lang RM, Badano LP, Mor‐Avi V, Afilalo J, Armstrong A, Ernande L, Flachskampf FA, Foster E, Goldstein SA, Kuznetsova T, Lancellotti P, Muraru D, Picard MH, Rietzschel ER, Rudski L, Spencer KT, Tsang W, Voigt JU. Recommendations for cardiac chamber quantification by echocardiography in adults: an update from the American Society of Echocardiography and the European Association of Cardiovascular Imaging. Eur Heart J Cardiovasc Imaging 2015; 16: 233–271. [DOI] [PubMed] [Google Scholar]
- 7. Poppe KK, Doughty RN, Gardin JM, Hobbs FDR, McMurray JJV, Nagueh SF, Senior R, Thomas L, Whalley GA, Aune E, Brown A. Ethnic‐specific normative reference values for echocardiographic LA and LV size, LV mass, and systolic function. JACC Cardiovasc Imaging 2015; 8: 656–665. [DOI] [PubMed] [Google Scholar]
- 8. Borlaug BA, Redfield MM. Diastolic and systolic heart failure are distinct phenotypes within the heart failure spectrum. Circulation 2011; 123: 2006–2014. [DOI] [PMC free article] [PubMed] [Google Scholar]
- 9. The Finnish Medical Society Duodecim, The Finnish Cardiac Society . Heart Failure. Current Care Guidelines. [Internet]. [cited 2019. Oct 18]. Available from: https://www.kaypahoito.fi/hoi50113
- 10. Lupón J, Gavidia‐Bovadilla G, Ferrer E, de Antonio M, Perera‐Lluna A, López‐Ayerbe J, Domingo M, Núñez J, Zamora E, Moliner P, Díaz‐Ruata P, Santesmases J, Bayés‐Genís A. Dynamic trajectories of left ventricular ejection fraction in heart failure. J Am Coll Cardiol 2018; 72: 591–601. [DOI] [PubMed] [Google Scholar]
- 11. Tsuji K, Sakata Y, Nochioka K, Miura M, Yamauchi T, Onose T, Abe R, Oikawa T, Kasahara S, Sato M, Shiroto T, Takahashi J, Miyata S, Shimokawa H, CHART‐2 Investigators . Characterization of heart failure patients with mid‐range left ventricular ejection fraction—a report from the CHART‐2 Study: characterization of HFmrEF. Eur J Heart Fail 2017; 19: 1258–1269. [DOI] [PubMed] [Google Scholar]
- 12. Lupón J, Gavidia‐Bovadilla G, Ferrer E, de Antonio M, Perera‐Lluna A, López‐Ayerbe J, Domingo M, Núñez J, Zamora E, Moliner P, Santiago‐Vacas E, Santesmases J, Bayés‐Genis A. Heart failure with preserved ejection fraction infrequently evolves toward a reduced phenotype in long‐term survivors: a long‐term prospective longitudinal study. Circ Heart Fail 2019; 12: e005652. [DOI] [PubMed] [Google Scholar]
- 13. Clarke CL, Grunwald GK, Allen LA, Barón AE, Peterson PN, Brand DW, Magid DJ, Masoudi FA. Natural history of left ventricular ejection fraction in patients with heart failure. Circ Cardiovasc Qual Outcomes 2013; 6: 680–686. [DOI] [PMC free article] [PubMed] [Google Scholar]
- 14. Dunlay SM, Roger VL, Weston SA, Jiang R, Redfield MM. Longitudinal changes in ejection fraction in heart failure patients with preserved and reduced ejection fraction. Circ Heart Fail 2012; 5: 720–726. [DOI] [PMC free article] [PubMed] [Google Scholar]
- 15. Yancy CW, Jessup M, Bozkurt B, Butler J, Casey DE, Colvin MM, Drazner MH, Filippatos GS, Fonarow GC, Givertz MM, Hollenberg SM. 2017 ACC/AHA/HFSA Focused Update of the 2013 ACCF/AHA Guideline for the Management of Heart Failure: A Report of the American College of Cardiology/American Heart Association Task Force on Clinical Practice Guidelines and the Heart Failure Society of America. Circulation 2017; 136: e137–e161. [DOI] [PubMed] [Google Scholar]
- 16. Center for Drug Evaluation and Research, Center for Biologics Evaluation and Research . Treatment for Heart Failure: Endpoints for Drug Development Guidance for Industry [Internet]. U.S. Food and Drug Administration. 2019. http://www.fda.gov/regulatory-information/search-fda-guidance-documents/treatment-heart-failure-endpoints-drug-development-guidance-industry (18 October 2019).
- 17. Solomon S, McMurray J, Anand I, Ge J, Lam C, Maggioni A, Martinez F, Packer M, Pfeffer MA, Pieske B, Redfield MM, Rouleau JL, van Veldhuisen D, Zannad F, Zile MR, Desai AS, Claggett B, Jhund PS, Boytsov SA, Comin‐Colet J, Cleland J, Düngen HD, Goncalvesova E, Katova T, Kerr Saraiva JF, Lelonek M, Merkely B, Senni M, Shah SJ, Zhou J, Rizkala AR, Gong J, Shi VC, Lefkowitz MP, PARAGON‐HF Investigators and Committees . Angiotensin–neprilysin inhibition in heart failure with preserved ejection fraction. N Engl J Med 2019; 381: 1609–1620. [DOI] [PubMed] [Google Scholar]
- 18. Vaduganathan M, Claggett BL, Desai AS, Anker SD, Perrone SV, Janssens S, Milicic D, Arango JL, Packer M, Shi VC, Lefkowitz MP. Prior heart failure hospitalization, clinical outcomes, and response to sacubitril/valsartan compared with valsartan in HFpEF. J Am Coll Cardiol 2019; 75: 245–254 S0735109719382993. [DOI] [PMC free article] [PubMed] [Google Scholar]
- 19. Dunlay SM, Roger VL, Redfield MM. Epidemiology of heart failure with preserved ejection fraction. Nat Rev Cardiol 2017; 14: 591–602. [DOI] [PubMed] [Google Scholar]
- 20. Oktay AA, Rich JD, Shah SJ. The emerging epidemic of heart failure with preserved ejection fraction. Curr Heart Fail Rep 2013; 10: 401–410. [DOI] [PMC free article] [PubMed] [Google Scholar]
- 21. Streng KW, Nauta JF, Hillege HL, Anker SD, Cleland JG, Dickstein K, Filippatos G, Lang CC, Metra M, Ng LL, Ponikowski P, Samani NJ, van Veldhuisen DJ, Zwinderman AH, Zannad F, Damman K, van der Meer P, Voors AA. Non‐cardiac comorbidities in heart failure with reduced, mid‐range and preserved ejection fraction. Int J Cardiol 2018; 271: 132–139. [DOI] [PubMed] [Google Scholar]
- 22. Lahoz R, Fagan A, Mcsharry M, Proudfoot C, Corda S, Studer S. Impact of recurrent heart failure hospitalizations on cardiovascular mortality in patients with heart failure in CPRD, a UK database. Abstr ESC Heart Fail 2019‐6th World Congr Acute Heart Fail 2019;P306. [DOI] [PMC free article] [PubMed]
- 23. Setoguchi S, Stevenson LW, Schneeweiss S. Repeated hospitalizations predict mortality in the community population with heart failure. Am Heart J 2007; 154: 260–266. [DOI] [PubMed] [Google Scholar]
- 24. Bello NA, Claggett B, Desai AS, McMurray JJV, Granger CB, Yusuf S, Swedberg K, Pfeffer MA, Solomon SD. Influence of previous heart failure hospitalization on cardiovascular events in patients with reduced and preserved ejection fraction. Circ Heart Fail 2014; 7: 590–595. [DOI] [PMC free article] [PubMed] [Google Scholar]
- 25. Lee DS, Austin PC, Stukel TA, Alter DA, Chong A, Parker JD, Tu JV. “Dose‐dependent” impact of recurrent cardiac events on mortality in patients with heart failure. Am J Med 2009; 122: 162.e1–162.e9. [DOI] [PubMed] [Google Scholar]
- 26. WMA ‐ The World Medical Association‐WMA Declaration of Helsinki – Ethical Principles for Medical Research Involving Human Subjects [Internet]. https://www.wma.net/policies-post/wma-declaration-of-helsinki-ethical-principles-for-medical-research-involving-human-subjects/ (18 October 2019).
- 27. Steinberg BA, Zhao X, Heidenreich PA, Peterson ED, Bhatt DL, Cannon CP, Hernandez AF, Fonarow GC, Get With the Guidelines Scientific Advisory Committee and Investigators . Trends in patients hospitalized with heart failure and preserved left ventricular ejection fraction: prevalence, therapies, and outcomes. Circulation 2012; 126: 65–75. [DOI] [PubMed] [Google Scholar]
- 28. Kirk V, Bay M, Parner J, Krogsgaard K, Herzog TM, Boesgaard S, Hassager C, Nielsen OW, Aldershvile J, Nielsen H. N‐terminal proBNP and mortality in hospitalised patients with heart failure and preserved vs. reduced systolic function: data from the prospective Copenhagen Hospital Heart Failure Study (CHHF). Eur J Heart Fail 2004; 6: 335–341. [DOI] [PubMed] [Google Scholar]
- 29. Solomon SD, Rizkala AR, Gong J, Wang W, Anand IS, Ge J, Lam CSP, Maggioni AP, Martinez F, Packer M, Pfeffer MA, Pieske B, Redfield MM, Rouleau JL, van Veldhuisen DJ, Zannad F, Zile MR, Desai AS, Shi VC, Lefkowitz MP, McMurray JJV. Angiotensin receptor neprilysin inhibition in heart failure with preserved ejection fraction. JACC Heart Fail 2017; 5: 471–482. [DOI] [PubMed] [Google Scholar]
Associated Data
This section collects any data citations, data availability statements, or supplementary materials included in this article.
Supplementary Materials
Figure S1. Kaplan–Meier fit of the timing of all analysed recurrent hospitalisations events (1st‐4th) stratified by LVEF into HFrEF (red), HFpEF (black), and HFmrEF (blue) phenotypes. The ‘Number at risk’ table represents the number of patients that have not yet undergone their next rehospitalisation (the event described in the corresponding plot).
Figure S2 Visualisation of the LVEF progression below 40% in heart failure patients stratified by LVEF phenotype and gender. The patients are ordered by the length of follow up i.e. time since index until end of follow up (death or study end). Multiple patients had LVEF measurements prior to index (time point 0). Blue line, LVEF >40% in the latest measurement; red line, LVEF <40% in the latest measurement.
Figure S3 Competing risk plot of the cumulative incidence of mortality (red line) compared to an event with a drop in LVEF to ≤40% (black line) in heart failure patients with HFmrEF (solid line) and HFpEF (dashed line) phenotype at index. The cumulative incidence expresses the proportion of patients in which a specific event occurs. Numbers at the bottom of the graph represent the number of patients with no events (death, a drop in LVEF to ≤40%, or end of follow up) at each time point.
Table S1 Number of left ventricular ejection fraction measurements per patient
Table S2 Ten most frequent main diagnoses associated with cardiovascular (CV) hospitalisations, all‐cause mortality, and CV mortality in heart failure patients stratified by left ventricular ejection fraction into HFrEF (≤40%), HFmrEF (>40–50%), and HFpEF (>50%) phenotypes.
Table S3 Kaplan–Meier fit of the probabilities of not being hospitalised given 0, 1, 2, and 3 previous rehospitalisations, among heart failure patients stratified by left ventricular ejection fraction into HFrEF (≤40%), HFmrEF (>40–50%), and HFpEF (>50%) phenotypes.
Table S4 Kaplan–Meier estimates of all‐cause mortality and cardiovascular (CV) mortality in heart failure patients stratified by left ventricular ejection fraction into HFrEF (≤40%), HFmrEF (>40–50%), and HFpEF (>50%) phenotypes.
Table S5 Cumulative incidence of deaths and drop in left ventricular ejection fraction (LVEF) to ≤40% in heart failure patients with HFpEF or HFmrEF phenotype at index.
Table S6 The association of gender, age and left ventricular ejection fraction (LVEF) at index with the risk of LVEF dropping to ≤40% in HFmrEF and HFpEF patients in the competing risk model.