

Abstract
Aims
OptiVol fluid index was developed as a transthoracic impedance‐based indicator of short‐term risk for heart failure hospitalization (HFH). OptiVol is calculated as the accumulating difference between daily impedance (measured impedance) and long‐term average impedance (reference impedance). Measured impedance alone was thought to have limited prognostic utility; however, measured impedance has the advantage of being simple, direct, and possibly additive to OptiVol fluid index in establishing long‐term HFH risk. We tested the hypothesis that directly measured impedance has independent prognostic value in predicting long‐term HFH risk and that changes in measured impedance result in a change in predicted long‐term HFH risk.
Methods and results
A retrospective analysis of 1719 patients studied in PARTNERS‐HF, FAST, and RAFT studies was performed. Baseline measured impedance was determined using daily values averaged over 1 month, from Month 6 to 7 post implant; change in measured impedance was determined from values averaged over 1 month, from Month 7 to 8 post implant compared with baseline. The predictive value of baseline measured impedance for HFHs was assessed beginning 7 months post implant. The predictive value of a change in measured impedance for a change in HFHs was assessed beginning 8 months post implant. Baseline measured impedance successfully predicted HFHs. For example, 3 year HFH rate for low baseline impedance < 70 Ω was 23%; for high baseline impedance ≥ 70 Ω was 15% (P < 0.001). Changes in measured impedance resulted in changes in predicted HFHs. For example, when a baseline impedance of ≥70 fell during follow‐up to <70 Ω, the subsequent HFHs were 15% compared with 4% in patients with measured impedance that remained >70 Ω (P = 0.004). In addition, when baseline measured impedance fell during follow‐up by >1%, 2%, or 3%, subsequent HFHs increased to 13%, 17%, or 18%, respectively. Finally, the prognostic value of measured impedance was additive to the prognostic value of the OptiVol fluid index.
Conclusions
Direct measurements of intrathoracic impedance using an implanted device can be used to stratify patients at varying risk of long‐term HFH. These direct measurements of impedance have practical clinical appeal because they are simple, continuous, and ambulatory.
Keywords: Heart failure, Impedance, Hospitalization
Introduction
The OptiVol fluid index was developed as a transthoracic impedance‐based indicator of short‐term transient change in risk for heart failure hospitalization (HFH). 1 , 2 , 3 , 4 Temporal changes in the OptiVol index are calculated by taking the difference between the daily value of impedance (measured impedance) and the long‐term average value of impedance (referred to as reference impedance) and accumulating these differences to construct a fluid index (referred to as OptiVol fluid index). As a result, OptiVol fluid index captures relative and transient short deviations in impedance. As impedance decreases and falls below the reference impedance, OptiVol fluid index rises. A significant rise in OptiVol fluid index (>60 Ω·days) was shown to precede an HFH event by 1–3 weeks. Therefore, OptiVol fluid index was proposed to be applicable in patients with known chronic heart failure (CHF) to detect an acute conditional transient indication of increased short‐term risk above any baseline long‐term disease‐attributable risk known to be present in CHF.
At the time that the OptiVol fluid index was developed, it was assumed that inter‐patient variations in the value of measured impedance would limit its prognostic utility and its application for detecting short‐term alterations in volume status in individual subjects. However, it seemed plausible that measured impedance, despite individual variability and the effects of non‐haemodynamic factors that could affect measurements (such as lead and device placement and patient's body build), might have long‐term (months to years) prognostic value in predicting HFHs. Measured impedance has several advantages. It is a simple and direct measurement. It may have a value additive to the OptiVol fluid index, especially in establishing long‐term risk for a patient. Changes in measured impedance values over defined time periods may signal a change in prognosis and long‐term risk. Furthermore, a recently published study using directly measured impedance demonstrated that this measurement technique provided independent prognostic value in predicting all‐cause mortality. 5
Therefore, the purpose of this analysis was to reevaluate and examine the long‐term prognostic utility of measured impedance in predicting HFHs. Accordingly, data from 1719 patients studied in the PARTNERS‐HF (Program to Access and Review Trending Information and Evaluate Correlation to Symptoms in Patients with Heart Failure), FAST (Fluid Accumulation Status Trial), and RAFT (Resynchronization‐Defibrillation for Ambulatory Heart Failure Trial) studies were examined to test the hypotheses that measured intrathoracic impedance has independent prognostic value. 6 , 7 , 8 Specifically, it was hypothesized that measured impedance establishes and predicts long‐term HFH risk; changes in measured impedance result in a change in the long‐term predicted HFHs; and the prognostic value of measured impedance is additive to the OptiVol fluid index in predicting HFH risk.
Methods
Study patients
In this study, a retrospective analysis was performed using the device and outcome data in the PARTNERS‐HF, FAST, and RAFT studies. The disposition of all patients is shown on the consort diagram in Figure S1. Baseline patient characteristics for 1719 patients included in the primary analysis are shown in Table 1 .
TABLE 1.
Demographic data for three baseline impedance groups
| Low impedance (n = 535) | Medium impedance (n = 577) | High impedance (n = 607) | Total (n = 1719) | P‐value | |
|---|---|---|---|---|---|
| Mean age (SD) | 70 (10) | 67 (10) | 65 (9) | 67 (10) | <0.001 |
| Male gender | 410 (77%) | 439 (76%) | 466 (77%) | 1315 (77%) | 0.958 |
| NYHA | <0.001 | ||||
| I | 1 (0%) | 6 (1%) | 2 (0%) | 9 (1%) | |
| II | 249 (47%) | 324 (56%) | 410 (68%) | 983 (57%) | |
| III | 271 (51%) | 236 (41%) | 191 (31%) | 698 (41%) | |
| IV | 14 (3%) | 11 (2%) | 4 (1%) | 29 (2%) | |
| Ischaemic | 371 (69%) | 377 (65%) | 342 (56%) | 1090 (63%) | <0.001 |
| Myocardial infarction | 302 (56%) | 313 (54%) | 297 (49%) | 912 (53%) | 0.031 |
| Hypertension | 342 (64%) | 321 (56%) | 297 (49%) | 960 (56%) | <0.001 |
| Diabetes | 229 (45%) | 210 (39%) | 202 (35%) | 641 (39%) | 0.006 |
| Device type | <0.001 | ||||
| ICD | 77 (14%) | 84 (15%) | 141 (23%) | 302 (18%) | |
| CRT‐D | 458 (86%) | 493 (85%) | 466 (77%) | 1417 (82%) | |
| Baseline medications | |||||
| ACE/ARB | 441 (82%) | 456 (79%) | 490 (81%) | 1387 (81%) | 0.357 |
| Beta‐blockers | 483 (90%) | 520 (90%) | 557 (92%) | 1560 (91%) | 0.562 |
| Diuretics | 451 (84%) | 463 (80%) | 505 (83%) | 1419 (83%) | 0.179 |
| Digoxin | 219 (41%) | 156 (27%) | 194 (32%) | 569 (33%) | <0.001 |
| AAD | 103 (19%) | 72 (12%) | 91 (15%) | 266 (15%) | 0.007 |
| Warfarin | 154 (31%) | 156 (31%) | 190 (38%) | 500 (31%) | 0.151 |
AAD, anti‐arrhythmic drug; ACE, angiotensin‐converting enzyme; ARB, angiotensin receptor‐blocker; CRT‐D, cardiac resynchronization therapy defibrillator; ICD, implantable cardioverter defibrillator.
Intrathoracic impedance measurements
All implantable cardioverter defibrillator (ICD) and cardiac resynchronization therapy defibrillator (CRT‐D) devices measured intrathoracic impedance using the RV‐coil to can vector. Baseline measured impedance was determined using daily impedance values averaged from 6 through 7 months post implant. The first 6 months of impedance data was excluded because intrathoracic impedance measured by the device is known to slowly change over this time as the device pocket matures. 3
Two analyses were performed (Figure 1A, B ). In the primary analysis, HFH was evaluated from 7 months forward (Figure 1A). HFHs were obtained from the study database. Patients were divided into three groups on the basis of 33rd and 66th percentile values for the distribution of the 1 month average baseline measured impedance values, as follows:
High impedance group (Group H): >74 Ω (highest observed impedance: 100 Ω).
Medium impedance group (Group M): 68–74 Ω.
Low impedance group (Group L): <68 Ω (lowest observed impedance: 38 Ω).
FIGURE 1.
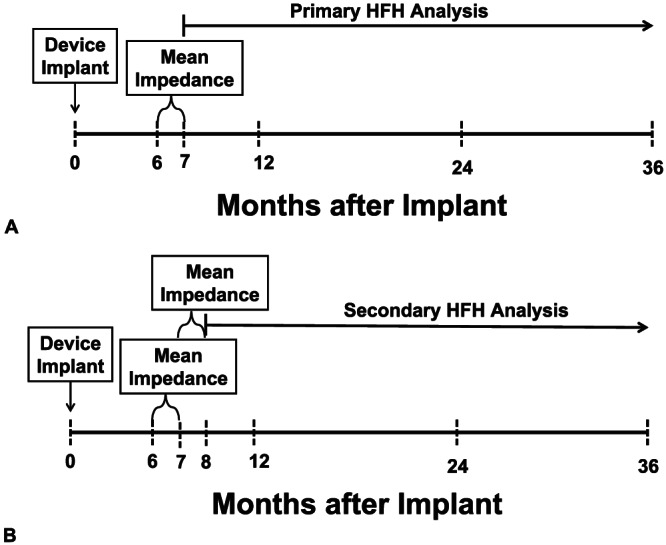
Experimental design: (A) Experimental design for the primary heart failure hospitalization (HFH) analysis; see text for details. (B) Experimental design for the secondary heart failure hospitalization (HFH) analysis; see text for details.
Furthermore, whether measured impedance provides an incremental value to prediction of patient outcomes independent of OptiVol threshold crossing was examined. ‘Threshold crossing’ for OptiVol was defined as a reduction in intrathoracic impedance from the patient's own reference impedance leading to a rise in the derived OptiVol fluid index above the nominal threshold of 60 Ω·days during Months 6 and 7.
In the secondary analysis, whether changes in average impedance over the next 1 month (i.e. 7 to 8 months after implant) in each of three groups were associated with varying HFH rates were examined (Figure 1B). For this secondary analysis, patients in the low impedance group (based on baseline impedance) who had no change in measured impedance over 7–8 months (i.e. the measured impedance remained <68 Ω) were graphed as ‘no change’ (i.e. started in impedance < 68 Ω, stayed <68 Ω). Likewise, patients in the low impedance group (based on baseline impedance) who had an increase in measured impedance over 7–8 months to values > 68 Ω were graphed as ‘increased’ (started <68 Ω, increased to >68 Ω). A similar labelling scheme was used for patients in the medium impedance group and high impedance group, by using their baseline 6–7 month measured impedance values first followed by their subsequent 7–8 month values.
Four additional analyses were performed: 70 Ω partition value, per cent change from baseline, return to baseline after a decrease, and combined HFH plus all‐cause mortality endpoint. A threshold of 70 Ω (<70 vs. ≥70 Ω) was examined as both a baseline value and a change from baseline (no change or increase vs. decrease) using the same primary and secondary analysis time frame as above. A per cent change from baseline, normalized to the baseline value, was performed for 1%, 2%, 3%, 4%, and 5% increase or decrease using the same primary and secondary analysis time frame as above. The effects on patient outcomes after a patient with a decrease in impedance of 2% or 3% from Month 6 to Month 7 ‘returned to the baseline’ value, no matter when this return occurred after Month 7, was examined. Outcomes in patients with impedance recovering back to Month 6 baseline were compared with those of patients in whom impedance did not return to baseline at any time during the follow‐up. A combined endpoint of HFHs and all‐cause mortality was examined using all of the analytic methods described above; these data are presented in Figure A1.
Data analysis
The F‐test for continuous variables (mean ± SD) and χ 2 test for categorical variables were used to examine the differences in baseline characteristics among groups. Kaplan–Meier survival analysis and Cox proportional hazards regression were used for time‐to‐event analysis, with the starting date of follow‐up after the observation period (7 months after implantation for the primary analysis and 8 months after implantation for the secondary analysis). Hazard ratios (HRs) and 95% confidence intervals (95% CI) for HFHs were adjusted for all the variables that are different between three impedance categories outlined in Table 1. These included adjustments for age, New York Heart Association (NYHA) class, ischaemic cardiomyopathy, hypertension, myocardial infarction (MI), diabetes, type of device, and use of digoxin and anti‐arrhythmic drugs. All analyses were performed using statistical software from SAS, Inc. (Version 9.4, Cary NC, USA).
Results
Patient demographics
Demographic data for the entire cohort of 1719 patients and the cohort divided into tertiles are shown in Table 1. The Cox regression analyses described subsequently were used to adjust for all differences in baseline factors.
Measured impedance vs. heart failure hospitalization (primary analysis)
The Kaplan–Meier estimate of HFH rate in the low impedance group patients was 20% at 3 years of follow‐up (Figure 2 ); HFH rate in the medium impedance group was 21%, but both were significantly higher than 13% HFHs in the high impedance group patients. The overall P‐value for the Kaplan–Meier plot with three groups is 0.002 (log rank test). The pairwise P‐values were low vs. high P < 0.001, and medium vs. high P = 0.015 (Figure 2). When adjusted for age, NYHA, ischaemic cardiomyopathy, hypertension, MI, diabetes, type of device, and use of digoxin and anti‐arrhythmic drugs, the HR for low vs. high was 1.47 (95% CI: 1.01, 2.14, P = 0.044), HR for medium vs. high was 1.35 (95% CI: 0.94, 1.93, P = 0.107), and the HR for low vs. medium was 1.09 (95% CI: 0.77, 1.55, P = 0.616). In addition, a partition threshold of 70 Ω (≥70 vs. <70 Ω) demonstrated that there was a significant difference in HFHs at 36 months (23% < 70 Ω, 15% ≥ 70 Ω, P < 0.001) (Figure 3 ).
FIGURE 2.
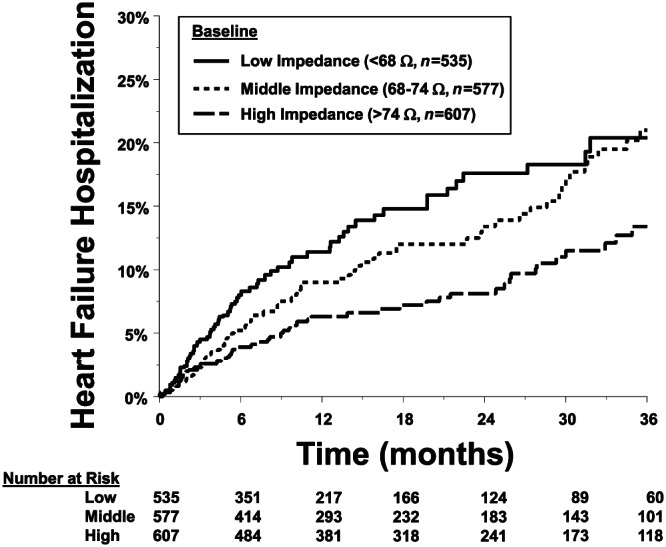
Kaplan–Meier estimate of the primary heart failure hospitalization (HFH) analysis. Patients were divided into tertiles on the basis of average baseline measured impedance: group low measured impedance ≤ 68 Ω, group medium 68–74 Ω, group high ≥ 74 Ω. HFH occurrence data at 36 months in low (20.4%) and middle (21.0%) were statistically different vs. high (13.4%, P = 0.002).
FIGURE 3.
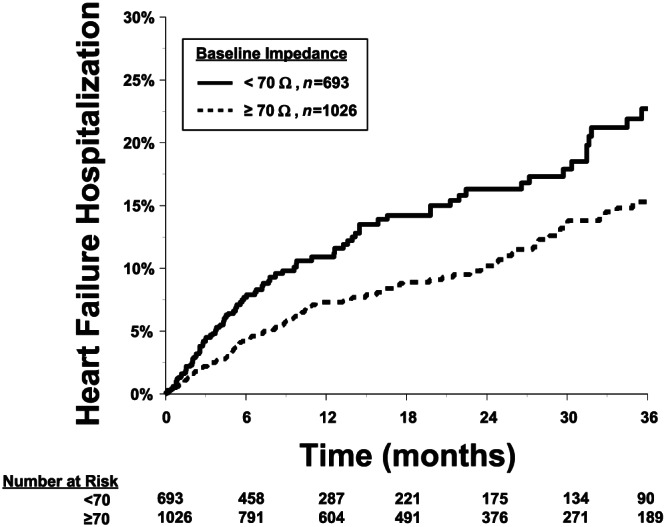
Kaplan–Meier estimate of the primary heart failure hospitalization (HFH) analysis with patients were divided into two groups impedance < 70 Ω vs. ≥70 Ω. HFH data at 36 months: <70 = 22.7%, ≥70 = 15.3% were statistically different between groups P < 0.001.
The observation period over which the baseline direct measurement of impedance was obtained was 1 month from Month 6 to 7 post implant. In addition, as an exploratory analysis, shorter observation periods were examined to determine whether observation periods of 1 week and 1 day would also be sufficient to predict HFHs (Table 2 ). This exploratory analysis was done only for the primary analysis and with and without adjustment for age, NYHA class, ischaemic cardiomyopathy, hypertension, MI, diabetes, type of device, and use of digoxin and anti‐arrhythmic drugs. This analysis of HFHs started the day after the end of the period for calculating average impedance. For example, the ‘1 day average’ is the impedance value 1 day after initial 6 months post implant (i.e. Day 183); HFH analysis started at Day 184 post implant. Similarly, the ‘1 week average’ is the average impedance from Day 183 to Day 189 post implant; HFH analysis started at Day 190 post implant. For all observation periods—1 month, 1 week, and 1 day—baseline measured impedance predicted HFHs (refer to Table 2 for unadjusted and adjusted HRs).
TABLE 2.
Hazard ratios for heart failure hospitalization predicted by baseline impedance < 70 measured over variable time periods
| Unadjusted HR (95% CI, P‐value) | Adjusted HR a (95% CI, P‐value) | |
|---|---|---|
| 1 month average |
1.63 (1.23, 2.16) P ≤ 0.001 |
1.40 (1.04, 1.88) P = 0.028 |
| 1 week average |
1.53 (1.16, 2.01) P = 0.003 |
1.29 (0.96, 1.73) P = 0.089 |
| 1 day average |
1.56 (1.19, 2.05) P = 0.001 |
1.33 (0.99, 1.78) P = 0.056 |
HR, hazard ratio.
Adjusted for age, New York Heart Association class, ischaemic cardiomyopathy, hypertension, myocardial infarction, diabetes, type of device, and use of digoxin and anti‐arrhythmic drugs.
Incremental value of measured impedance to OptiVol threshold crossings
The predictive discrimination for HFHs provided by the baseline (6–7 months) measured impedance in the primary analysis was present in patients who did not have an OptiVol fluid index threshold crossing during 6–7 months after implantation and but not present in those who did. Results were similar if OptiVol crossings during the first 7 months after implantation were used.
Change in measured impedance vs. heart failure hospitalization (secondary analysis)
Change based on changes in tertile‐derived thresholds
In the high impedance group (>74 Ω), when there was a decrease in measured impedance during the 7–8 months after implantation period, the subsequent HFHs were not significantly changed compared with that of patients who did not change (5% vs. 4% HFHs at 6 months). Adjusted HR was 0.95 (95% CI: 0.34, 2.68, P = 0.927). However, using a partition value of >70 Ω at baseline when there was a decrease in measured impedance during the 7–8 months after implantation period to <70 Ω, the subsequent HFHs were significantly higher compared with that of patients who did not change (15% vs. 4% HFHs at 6 months, P = 0.004). The adjusted HR for >70 Ω group at baseline vs. change to <70 Ω was 2.17 (95% CI: 1.04, 4.54, P = 0.040).
In the medium impedance group, when there was an increase in measured impedance or there was no change in the measured impedance during the 7–8 months after implantation period, the subsequent HFHs were not different (6% vs. 5%, P = 0.516). When there was a decrease in measured impedance during the 7–8 months after implantation period, the subsequent HFHs increased to 12%, P = 0.175. These changes resulted in HRs after adjustment for covariates of age, NYHA, ischaemic cardiomyopathy, hypertension, MI, diabetes, type of device, and use of digoxin and anti‐arrhythmic drugs for groups medium at baseline lo Low at follow‐up (M.L) vs. medium to medium (M.M) (HR 1.71 [0.76, 3.87], P = 0.195), M.L vs. medium to high (M.H) (HR 1.27 [0.45, 3.54], P = 0.652) and M.M vs. M.H (HR 0.74 [0.36, 1.54], P = 0.419).
In the low impedance group, when there was an increase in measured impedance or there was no change in the measured impedance during the 7–8 months after implantation period, the subsequent HFHs were not different (6% vs. 8%, P = 0.221). The adjusted HR was 1.63 (95% CI: 0.59, 4.56, P = 0.349). In addition, using a partition value of <70 Ω at baseline when there was an increase in measured impedance during the 7–8 months after implantation period to >70 Ω, the subsequent HFHs were not statistically different compared with those of patients who did not change (5% vs. 7% HFHs, P = 0.440). The adjusted HR for <70 Ω group at baseline vs. change to >70 Ω was 1.47 (95% CI: 0.64, 3.41, P = 0.364).
Change based on % changes from baseline thresholds
When a change in impedance from baseline is considered, a % change independent of the baseline value itself was examined. In patients with 1%, 2%, 3%, 4%, or 5% increase in impedance from baseline, there were no significant changes in subsequent HFHs compared with those of patients who did not change (Table 3 ). By contrast, however, in patients with 1%, 2%, 3%, 4%, or 5% decrease in impedance from baseline, there were significant increases in subsequent HFHs compared with those of patients who did not change (Table 3 ). In addition, HFH rate was examined in patients who had a decrease in impedance from baseline (>3% or > 2%) during Months 7 through 8 post implant and in whom the impedance recovered to the baseline value after Month 8 irrespective of when this recovery occurred; HFHs in these patients significantly decreased compared with those of patients in whom impedance did not return to baseline at any time during follow‐up (12% vs. 25%, HR 3.32 [1.70–6.45], P < 0.001) (Table 4 ).
TABLE 3.
Relationship between % change in impedance from baseline vs. heart failure hospitalization
| % change | n | # HFHs (%) | Adj. HR a (95% CI) | Adj. P‐value |
|---|---|---|---|---|
| Increase > 1% b | 0.057 | |||
| No | 962 (57%) | 113 (11.7%) | ||
| Yes | 722 (43%) | 70 (9.7%) | 0.74 (0.55–1.01) | |
| Increase > 2% | 0.913 | |||
| No | 1343 (80%) | 143 (10.6%) | ||
| Yes | 341 (20%) | 40 (11.7%) | 0.98 (0.68–1.41) | |
| Increase > 3% | 0.210 | |||
| No | 1467 (87%) | 150 (10.2%) | ||
| Yes | 217 (13%) | 33 (15.2%) | 1.30 (0.86–1.94) | |
| Increase > 4% | 0.333 | |||
| No | 1542 (92%) | 161 (10.4%) | ||
| Yes | 142 (8%) | 22 (12.0%) | 1.27 (0.79–2.04) | |
| Increase > 5% | 0.096 | |||
| No | 1608 (95%) | 169 (10.5%) | ||
| Yes | 76 (5%) | 14 (18.4%) | 1.63 (0.92–2.90) | |
| Decrease > 1% | 0.016 | |||
| No | 1155 (69%) | 114 (9.9%) | ||
| Yes | 529 (31%) | 69 (13.0%) | 1.46 (1.07–1.98) | |
| Decrease > 2% | <0.001 | |||
| No | 1430 (85%) | 139 (9.7%) | ||
| Yes | 254 (15%) | 44 (17.3%) | 2.09 (1.48–2.96) | |
| Decrease > 3% | 0.001 | |||
| No | 1529 (91%) | 155 (10.1%) | ||
| Yes | 155 (9%) | 28 (18.1%) | 1.96 (1.29–2.95) | |
| Decrease > 4% | 0.004 | |||
| No | 1589 (94%) | 165 (10.4%) | ||
| Yes | 95 (6%) | 18 (18.9%) | 2.05 (1.26–3.35) | |
| Decrease > 5% | <0.001 | |||
| No | 1630 (97%) | 169 (10.4%) | ||
| Yes | 54 (3%) | 14 (25.9%) | 3.01 (1.74–5.20) |
Adjusted for the first month impedance, age, New York Heart Association class, ischaemic cardiomyopathy, hypertension, myocardial infarction, diabetes, type of device, and use of digoxin and anti‐arrhythmic drugs.
For an increase > 1% (yes), the comparison group is increase ≤ 1% (no); all subsequent analyses use the same method.
TABLE 4.
Resultant change in heart failure hospitalizations after impedance returned to baseline values
| n = 154 patients with >3% ↓ in impedance measured as (Month 2 − Month 1)/Month 1 | ||||
|---|---|---|---|---|
| % change > 3% | n | # HFHs (%) | HR (95% CI) | P‐value |
| Return to baseline | 0.006 | |||
| No | 48 (31%) | 12 (25.0%) | 3.14 (1.40–7.07) | |
| Yes | 106 (69%) | 13 (12.3%) | ||
| n = 154 patients with >3% ↓ in impedance measured as (Month 2 − Month 1)/Month 1 | ||||
|---|---|---|---|---|
| % change > 3% | n | # HFHs (%) | HR (95% CI) | P‐value |
| Return to baseline | <0.001 | |||
| No | 64 (25%) | 16 (25.0%) | 3.32 (1.70–6.45) | |
| Yes | 189 (75%) | 22 (11.6%) | ||
Discussion
The ability to accurately identify patients at risk for HFHs and identify a change in that risk profile remains a challenge in patients with CHF. Data from the current analysis suggest that directly measured intrathoracic impedance provided data that can be used to risk stratify patients with existing ICDs or CRT‐D devices. For example, CHF patients with a directly measured baseline impedance < 70 Ω had a significantly higher long‐term HFH risk than CHF patients with a baseline impedance of >70 Ω. The prognostic value of measured impedance to predict long‐term HFH risk is additive to the OptiVol fluid index. The prognostic accuracy is present whether impedance was averaged over 1 month, 1 week, or 1 day. Changes in directly measured impedance over time resulted in a change in the long‐term predicted mortality. For example, when measured impedance decreased from baseline values, HFH rate increased subsequent to this change. Later, when these decreases in impedance increased back to baseline levels, HFH rate declined subsequent to this recovery in measured impedance. Thus, risk assessed by directly measured impedance varies over time, and changes in impedance predict changes in risk. These measurements of impedance have practical clinical appeal because they are simple, continuous, and ambulatory.
Impedance in previous studies
Previous studies demonstrated that OptiVol fluid index crossing above a threshold value was associated with increased short‐term risk of HFHs. 1 , 2 , 3 , 4 , 6 , 7 , 8 , 9 Patients with an OptiVol crossing were shown to be at a higher risk of an HFH event within 2–4 weeks than were patients with no OptiVol crossings. The current study demonstrated that baseline directly measured impedance, in both the absence and presence of an OptiVol fluid index crossing, can predict long‐term risk HFH events over 2–3 years.
Previously, several prospective studies have examined the utility of OptiVol fluid index in the management of patients with CHF, specifically its utility in affecting the rate of HFHs. 10 , 11 , 12 , 13 , 14 The results of these studies have been disappointing. OptiVol fluid index has been shown to reflect elevated filling pressures and volume status. However, when used as a single sensor‐based metric, the use of the OptiVol fluid index to alter management did not decrease the number or rate of HFHs. These negative findings may have been related to the study design, difficulty in interpreting OptiVol fluid index, lack of a clear management plan, difficulties in implementing the management plan, or multiple other experimental factors. These negative previous studies have resulted a change in the direction of utilization of sensor‐based metrics from a single metric to an integrated multisensor, multimetric, algorithmic approach. 6 , 15 , 16 , 17 , 18 , 19 Given the predictive characteristics of directly measured impedance values and its demonstrated utility in identifying heart failure with reduced ejection fraction (HFrEF) patients at risk for HFHs and all‐cause mortality, it appears reasonable to add this metric as one measurement intrinsic to this integrative algorithmic approach.
Application to multiple sensor metric algorithms
Directly measured impedance has been incorporated into at least two CHF management multisensor, multimetric algorithms (Heart Logic and Triage HF 15 , 16 , 17 , 18 , 19 ). Software and hardware platforms have allowed integration of metrics related to heart rate (HR), HR variability, rhythm, heart sounds, position, activity, and respiration together with impedance into a risk algorithm that predicts HFHs with increasing accuracy. These algorithms have been shown to have good accuracy in predicting risk for HFHs, but none have yet been tested in a randomized clinical trial as methods of facilitating change in management strategies to reduce HFHs. These prospective trials are currently being designed and performed. However, what already seems clear is that the accuracy and utility of a multisensor, multimetric algorithm will exceed a single sensor or metric and that impedance will remain a pivotal component of this algorithm.
Study limitations
The changes in directly measured impedance that occurred in the subjects studied cannot be related in a cause‐and‐effect manner to any changes in management. The three studies used in our analyses (PARTNERS‐HF, FAST, and RAFT) were not designed in a manner that would allow prospective evaluation of change in management vs. change in impedance and then the determination of causality. 6 , 7 , 8 In addition, the relationship between change in impedance vs. change in rate of HFHs cannot be related to change in management. However, these data do support the need for examining the use of directly measured impedance in the management of patients with HFrEF.
Clinical implications
The direct measurement of impedance has several aspects that make it clinically advantageous. It is simple and requires no mathematical modelling. It provides capability for use as a remote and continuous assessment of volume status. It is a measurement that can be made using a permanently implantable device.
One advantage of measured impedance is that a zone of ‘normal’ measured impedance can be established. For example, a persistently low impedance, below this normal measured impedance range, may signify an elevated risk, owing to chronic elevations in filling pressure and hypervolaemia. Under these circumstances, the low impedance measurement may serve as an indication to increase or add new guideline‐directed medical therapy. By contrast, the OptiVol fluid index may be less sensitive to situations in which the patient is chronically volume overloaded with a stable but low measured impedance. Measured impedance can be a more sensitive than OptiVol for detecting changes in patient status under these circumstances. Furthermore, because impedance provides orthogonal information not captured by OptiVol in certain situations, it may also be added to existing device diagnostics‐based models to enhance their overall performance. 15 , 16 , 17 , 18 , 19 , 20
Conclusions
Directly measured intrathoracic impedance, measured using an implantable device, provides data that can be used to identify long‐term risk stratification in patients with HFrEF. Specifically, baseline measured impedance predicts HFHs. Changes from baseline measured impedance result in a change in the predicted long‐term HFH risk. The prognostic value of directly measured impedance is additive to the impedance‐dependent fluid index. Thus, measured impedance can support risk stratification in CHF patients as a stand‐alone metric or as a component to multimetric integrative approaches.
Conflict of interest
Drs. Zile and Tang have received research grants from and served as consultants to Medtronic, Plc. Dr. Baicu has no disclosures. Dr. Sharma and Ms. Koehler are Medtronic employees.
Funding
Medtronic, Plc.
Supporting information
Figure S1. Patient disposition for primary and secondary analysis
Zile, M. R. , Sharma, V. , Baicu, C. F. , Koehler, J. , and Tang, A. S. (2020) Prediction of heart failure hospitalizations based on the direct measurement of intrathoracic impedance. ESC Heart Failure, 7: 3040–3048. 10.1002/ehf2.12930.
References
- 1. Yu CM, Wang L, Chau E, Chan RH, Kong SL, Tang MO, Christensen J, Stadler RW, Lau CP. Intrathoracic impedance monitoring in patients with heart failure: correlation with fluid status and feasibility of early warning preceding hospitalization. Circulation 2005; 112: 841–848. [DOI] [PubMed] [Google Scholar]
- 2. Ypenburg C, Bax JJ, van der Wall EE, Schalij MJ, van Erven L. Intrathoracic impedance monitoring to predict decompensated heart failure. Am J Cardiol 2007; 99: 554–557. [DOI] [PubMed] [Google Scholar]
- 3. Vollmann D, Nägele H, Schauerte P, Wiegand U, Butter C, Zanotto G, Quesada A, Guthmann A, Hill MR, Lamp B, European InSync Sentry Observational Study Investigators . Clinical utility of intrathoracic impedance monitoring to alert patients with an implanted device of deteriorating chronic heart failure. Eur Heart J 2007; 28: 1835–1840. [DOI] [PubMed] [Google Scholar]
- 4. Small RS, Wickemeyer W, Germany R, Hoppe B, Andrulli J, Brady PA, Labeau M, Koehler J, Sarkar S, Hettrick DA, Tang WH. Changes in intrathoracic impedance are associated with subsequent risk of hospitalizations for acute decompensated heart failure: clinical utility of implanted device monitoring without a patient alert. J Card Fail 2009; 15: 475–481. [DOI] [PubMed] [Google Scholar]
- 5. Zile MR, Sharma V, Johnson JW, Warman EN, Baicu CF, Bennett TD. Prediction of all‐cause mortality based on the direct measurement of intrathoracic impedance. Circ Heart Fail 2016; 9: e002543. [DOI] [PMC free article] [PubMed] [Google Scholar]
- 6. Whellan DJ, Ousdigian KT, Al‐Khatib SM, Pu W, Sarkar S, Porter CB, Pavri BB, O'Connor CM, PARTNERS Study Investigators . Combined heart failure device diagnostics identify patients at higher risk of subsequent heart failure hospitalizations: results from PARTNERS HF (Program to Access and Review Trending Information and Evaluate Correlation to Symptoms in Patients With Heart Failure) study. J Am Coll Cardiol 2010; 55: 1803–1810. [DOI] [PubMed] [Google Scholar]
- 7. Abraham WT, Compton S, Haas G, Foreman B, Canby RC, Fishel R, McRae S, Toledo GB, Sarkar S, Hettrick DA, FAST Study Investigators . Intrathoracic impedance vs daily weight monitoring for predicting worsening heart failure events: results of the Fluid Accumulation Status Trial (FAST). Congest Heart Fail 2011; 17: 51–55. [DOI] [PubMed] [Google Scholar]
- 8. Tang AS, Wells GA, Talajic M, Arnold MO, Sheldon R, Connolly S, Hohnloser SH, Nichol G, Birnie DH, Sapp JL, Yee R, Healey JS, Rouleau JL, Resynchronization‐Defibrillation for Ambulatory Heart Failure Trial Investigators . Cardiac‐resynchronization therapy for mild‐to‐moderate heart failure. N Engl J Med 2010; 363: 2385–2395. [DOI] [PubMed] [Google Scholar]
- 9. Conraads VM, Tavazzi L, Santini M, Oliva F, Gerritse B, Yu CM, Cowie MR. Sensitivity and positive predictive value of implantable intrathoracic impedance monitoring as a predictor of heart failure hospitalizations: the SENSE‐HF trial. Eur Heart J 2011; 32: 2266–2273. [DOI] [PubMed] [Google Scholar]
- 10. Evaluation of Cardiac Compass With OptiVol in the Early Detection of Decompensation Events for Heart Failure (PRECEDE‐HF), ClinicalTrials.gov Identifier: NCT00510198 , early termination, 2009.
- 11. van Veldhuisen DJ, Braunschweig F, Conraads V, Ford I, Cowie MR, Jondeau G, Kautzner J, Aguilera RM, Lunati M, Yu CM, Gerritse B, Borggrefe M, DOT‐HF Investigators . Intrathoracic impedance monitoring, audible patient alerts, and outcome in patients with heart failure. Circulation 2011; 124: 1719–1726. [DOI] [PubMed] [Google Scholar]
- 12. Lüthje L, Vollmann D, Seegers J, Sohns C, Hasenfuß G, Zabel M. A randomized study of remote monitoring and fluid monitoring for the management of patients with implanted cardiac arrhythmia devices. Europace 2015; 17: 1276–1281. [DOI] [PubMed] [Google Scholar]
- 13. Böhm M, Drexler H, Oswald H, Rybak K, Bosch R, Butter C, Klein G, Gerritse B, Monteiro J, Israel C, Bimmel D, Käab S, Huegl B, Brachmann J, OptiLink HF Study Investigators . Fluid status telemedicine alerts for heart failure: a randomized controlled trial. Eur Heart J 2016; 37: 3154–3163. [DOI] [PubMed] [Google Scholar]
- 14. Boriani G, Da Costa A, Quesada A, Ricci RP, Favale S, Boscolo G, Clementy N, Amori V, Mangoni di S Stefano L, Burri H, MORE‐CARE Study Investigators . Effects of remote monitoring on clinical outcomes and use of healthcare resources in heart failure patients with biventricular defibrillators: results of the MORE‐CARE multicentre randomized controlled trial. Eur J Heart Fail 2017; 19: 416–425. [DOI] [PubMed] [Google Scholar]
- 15. Boehmer JP, Hariharan R, Devecchi FG, Smith AL, Molon G, Capucci A, An Q, Averina V, Stolen CM, Thakur PH, Thompson JA, Wariar R, Zhang Y, Singh JP. A multisensor algorithm predicts heart failure events in patients with implanted devices: results from the MultiSENSE Study. JACC Heart Fail 2017; 5: 216–225. [DOI] [PubMed] [Google Scholar]
- 16. Cowie MR, Sarkar S, Koehler J, Whellan DJ, Crossley GH, Tang WH, Abraham WT, Sharma V, Santini M. Development and validation of an integrated diagnostic algorithm derived from parameters monitored in implantable devices for identifying patients at risk for heart failure hospitalization in an ambulatory setting. Eur Heart J 2013; 34: 2472–2480. [DOI] [PMC free article] [PubMed] [Google Scholar]
- 17. Gula LJ, Wells GA, Yee R, Koehler J, Sarkar S, Sharma V, Skanes AC, Sapp JL, Redfearn DP, Manlucu J, Tang AS. A novel algorithm to assess risk of heart failure exacerbation using ICD diagnostics: validation from RAFT. Heart Rhythm 2014; 11: 1626–1631. [DOI] [PubMed] [Google Scholar]
- 18. Sharma V, Rathman LD, Small RS, Whellan DJ, Koehler J, Warman E, Abraham WT. Stratifying patients at the risk of heart failure hospitalization using existing device diagnostic thresholds. Heart Lung 2015; 44: 129–136. [DOI] [PMC free article] [PubMed] [Google Scholar]
- 19. Virani SA, Sharma V, McCann M, Koehler J, Tsang B, Zieroth S. Prospective evaluation of integrated device diagnostics for heart failure management: results of the TRIAGE‐HF study. ESC Heart Fail 2018; 5: 809–817. [DOI] [PMC free article] [PubMed] [Google Scholar]
- 20. Smeets CJP, Lee S, Groenendaal W, Squillace G, Vranken J, De Cannière H, Van Hoof C, Grieten L, Mullens W, Nijst P, Vandervoort PM. The added value of in‐hospital tracking of the efficacy of decongestion therapy and prognostic value of a wearable thoracic impedance sensor in acutely decompensated heart failure with volume overload: prospective cohort study. JMIR Cardio 2020; 4: e12141. [DOI] [PMC free article] [PubMed] [Google Scholar]
Associated Data
This section collects any data citations, data availability statements, or supplementary materials included in this article.
Supplementary Materials
Figure S1. Patient disposition for primary and secondary analysis