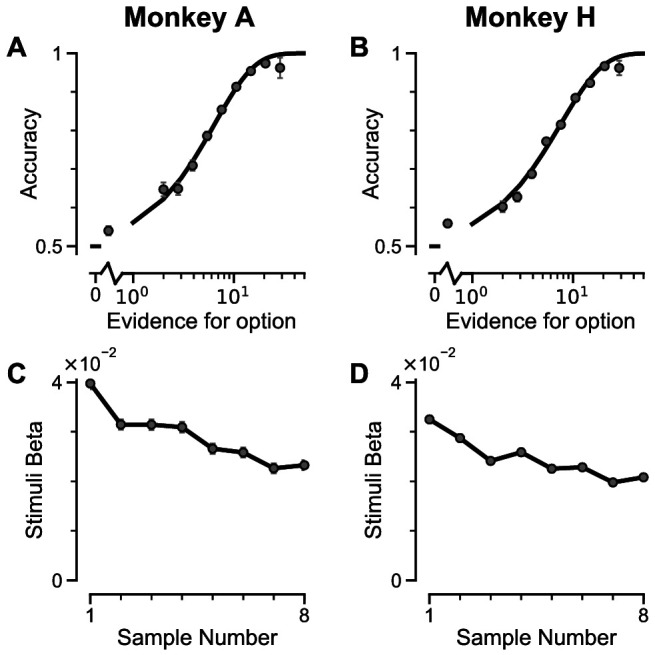
Figure 2. Subjects use evidence presented throughout the trial to guide their choices.
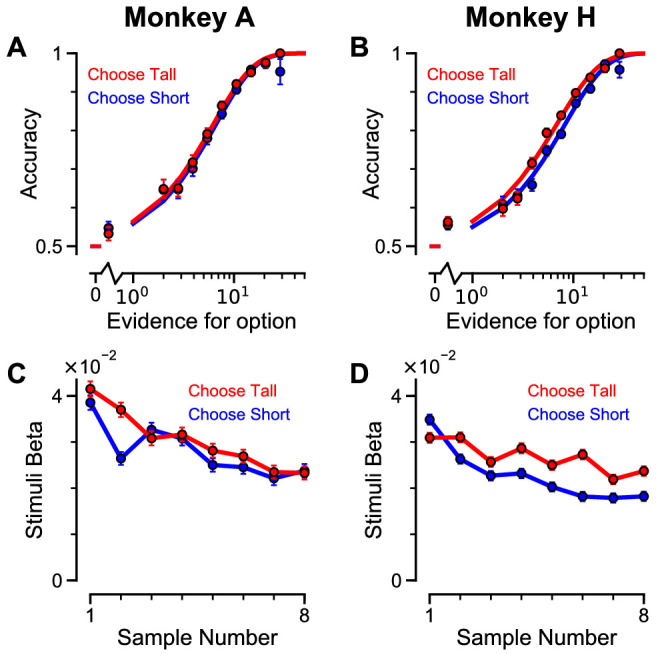
(A-B) Choice accuracy plotted as a function of the amount of evidence in favour of the best option. Lines are a psychometric fit to the data. (C-D) Logistic regression coefficients reveal the contribution (weight) of all eight stimuli on subjects’ choices (see Materials and methods). Although subjects used all eight stimuli to guide their choices, they weighed the initially presented evidence more strongly. All errorbars indicate the standard error.

Figure 2—figure supplement 1. Subjects use evidence presented throughout the trial to guide their choices – data separated by ‘ChooseTall’ and ‘ChooseShort’ trials.

