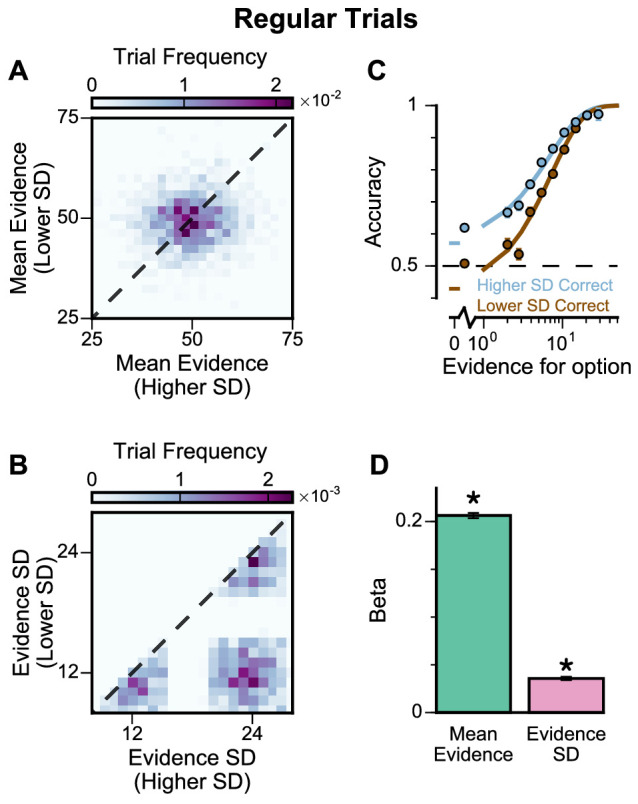
Figure 4. Subjects show a pro-variance bias in their choices on regular trials.
For these analyses, stimulus streams were divided into ‘Lower SD’ or ‘Higher SD’ options post-hoc, on a trial-wise basis. (A) On regular trials, the mean evidence of each stream was independent. (B) Each stream is sampled from either a narrow or a broad distribution, such that about 50% of the trials have one broad stream and one narrow stream, 25% of the trials have two broad streams, and 25% of the trials have two narrow streams. (C) Psychometric function when either the ‘Lower SD’ (brown) or ‘Higher SD’ (blue) stream is correct in the regular trials. (D) Regression analysis using the left-right differences of the mean and standard deviation of the stimuli evidence to predict left choice. The beta coefficients quantify the contribution of both statistics to the decision-making processes of the monkeys (Mean Evidence: t = 74.78, p<10−10; Evidence Standard Deviation: t = 19.65, p<10−10). Notably, a significantly positive evidence SD coefficient indicates the subjects preferred to choose options which were more variable across samples. Errorbars indicate the standard error.

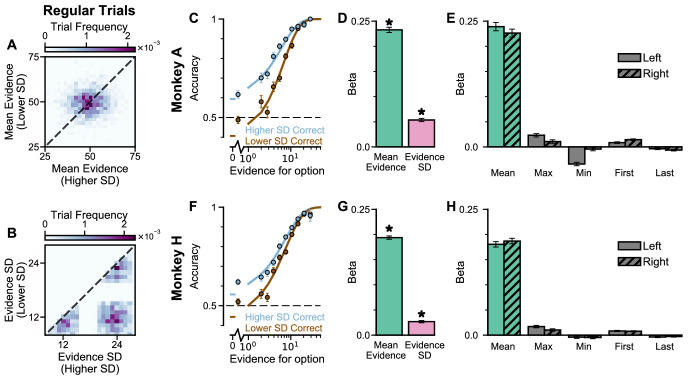
Figure 4—figure supplement 1. Extra information on Regular Trials, separated by subjects.
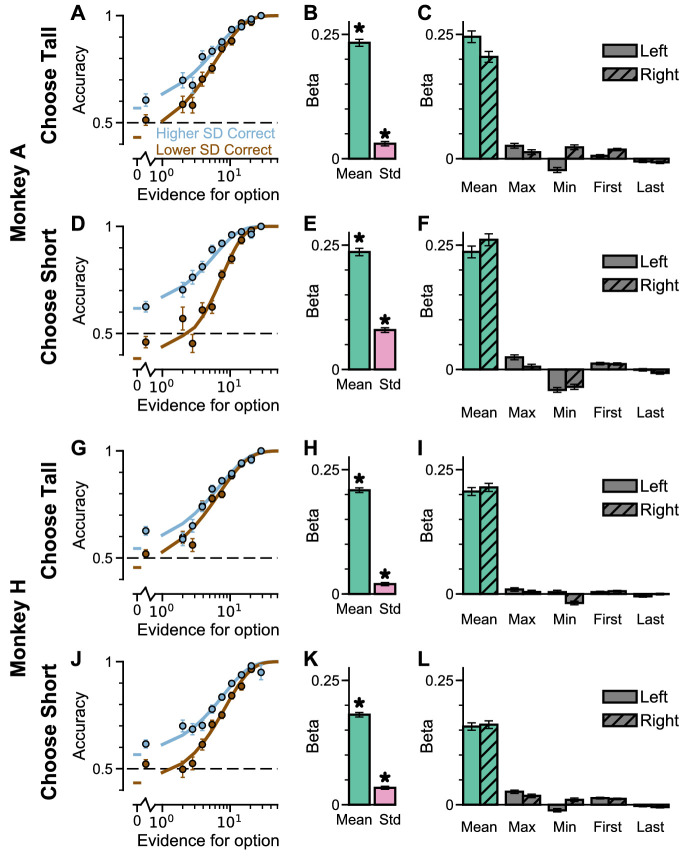
Figure 4—figure supplement 2. Extra information on Regular Trials, separated by ‘ChooseTall’ and ‘ChooseShort’ trials.
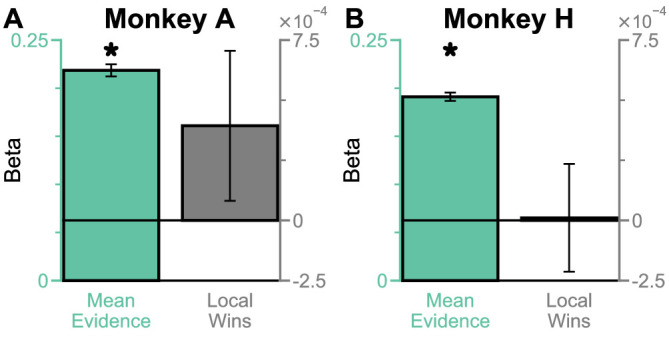
Figure 4—figure supplement 3. Extra information on Regular Trials – the subjects do not show a frequent winner bias.


