Abstract
Objective
To test the hypothesis that the intrathecal synthesis of free light chain kappa (FLC-k) can be used as a CSF biomarker to differentiate patients with myelitis due to multiple sclerosis (MS), myelitis due to neuromyelitis optica spectrum disease (NMOSD), and noninflammatory myelopathy, we analyzed FLC-k in 26 patients with MS myelitis, 9 patients with NMOSD myelitis, and 14 patients with myelopathy.
Methods
This is a retrospective monocentric cohort study. FLC-k were analyzed using the nephelometric Siemens FLC-k kit in paired samples of CSF and sera. Intrathecal fraction (IF) of FLC-k was plotted in a FLC-k quotient diagram.
Results
Ninety-six percent of patients with MS myelitis had an intrathecal synthesis of FLC-k in comparison with 55.6% for NMOSD and 14.3% of patients with noninflammatory myelopathy. The locally synthesized absolute amount of FLC-k was significantly higher in patients with myelitis due to MS than in patients with NMOSD (p = 0.038) or noninflammatory myelopathy (p < 0.0001). The sensitivity of FLC-k synthesis to detect inflammation in patients with myelitis is 85.7%. Using a receiver operating characteristic analysis, FLC-k IF >78% can discriminate patients with myelitis due to MS and NMOSD with a sensitivity of 88.5% and a specificity of 88.9%
Conclusions
With the hyperbolic reference range in quotient diagrams for FLC-k, it is possible to distinguish inflammatory myelitis from noninflammatory myelopathies. An FLC-k IF >78% can be a hint to suspect myelitis due to MS rather than NMOSD.
The causes of myelopathies can be manifold, and there is a broad range of differential diagnoses. Besides compressive myelopathy, the most frequent causes of myelopathy are inflammatory disorders such as MS or neuromyelitis optica spectrum disease (NMOSD).1 Although neuroimaging is essential for the evaluation of myelopathy, overlap in the imaging appearance is a challenging issue.1 The additional analysis of CSF can provide useful information on further etiologic determination.1–3 In noninflammatory myelopathies, CSF analysis seldom reveals signs of inflammation, such as pleocytosis or intrathecal immunoglobulin (Ig) G synthesis.3 In MS, there is a high prevalence of oligoclonal band (OCB) in approximately 95%,4 in contrast to NMOSD, where the absence of OCB is a supportive evidence for the correct diagnosis, although sensitivity and specificity are modest.5 It has been shown that the analysis of free light chain kappa (FLC-k) can be used in the diagnostic process of MS with equal sensitivity to OCB analysis.6 Methodologically, its use provides the advantage of an easy-to-use, commercially available nephelometric assay for a rapid and quantitative evaluation of intrathecal inflammation.7 Up to date, no study analyzed the diagnostic performance of FLC-k intrathecal synthesis for the discrimination between patients with MS myelitis, NMOSD myelitis, and noninflammatory myelopathies. The prespecified hypothesis stated that the intrathecal synthesis of FLC-k in CSF is the highest in patients with MS associated myelitis, lower in myelitis due to NMOSD, and absent in non-inflammatory myelopathies.
Methods
This is a retrospective monocentric cohort study. Patients were identified for analysis based on diagnosis in medical records. Paired CSF and serum samples were acquired between 2008 and 2020 from patients of the Department of Neurology, University Medicine Greifswald, Germany. Between 2008 and 2016 samples were stored at −80°C. The samples acquired between 2016 and 2020 have been measured either as part of other study cohorts7–9 or for the purpose of this study without being stored. Patients were grouped by the clinical diagnosis according to the corresponding criteria (MS: modified Mc Donald criteria10; NMOSD: criteria proposed by Wingerchuk et al.5).
Laboratory analysis
Laboratory analyses were performed in the Interdisciplinary CSF laboratory of the University Medicine Greifswald as described previously.7,11
FLC-k in sera and CSF were measured by nephelometry with the N Latex FLC kappa kit (Siemens Healthcare Diagnostics Products GmbH, Marburg, Germany) according to the manufacturers protocol on the BN Prospec analyzer. CSF predilution was set to 1:1; serum predilution was set to 1:100. The lower limit of quantification was 0.034 mg/L and was given by the manufacturer (details are provided in table e-1, links.lww.com/NXI/A316).
The hyperbolic reference range and the amount of intrathecal synthesized FLC-k was calculated according to the formulas defined by Reiber et al.11
Statistical analysis
SPSS 25.0 (IBM Co., Armonk, NY) and RStudio (R version 3.5.1 2018-07-02) were used for statistical and graphical processing of the data. Statistical significance was assessed using χ2 test or Fisher exact test for nominal data. Intergroup comparison was performed using the Kruskal-Wallis analysis of ranks test. For statistical group comparison, the FLC-k intrathecal fraction (IF) and the locally synthesized absolute amount of FLC-k was calculated in relation to the Qmean. The sensitivity and specificity of FLC-k IF was displayed in a receiver operating characteristic (ROC) curve. The optimal cut-off to discriminate patients with myelitis due to MS and NMOSD was determined using the Youden index. p Values ≤0.05 were regarded as statistically significant.
Standard protocol approvals, registrations, and patient consents
The study has been approved by the institutional review board (BB019/18).
Data availability
Anonymized data will be shared by request from any qualified investigator.
Results
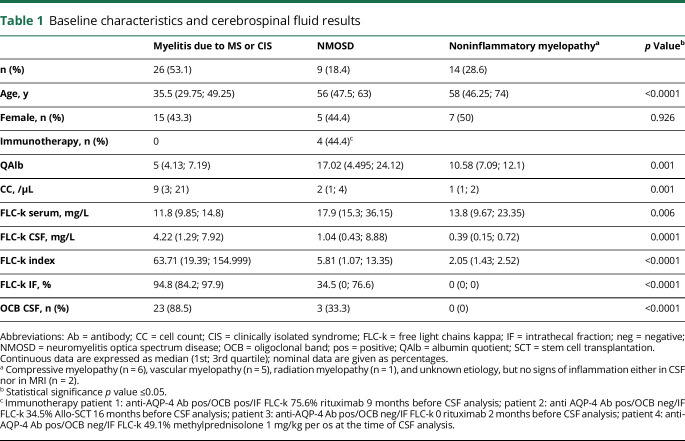
Forty-nine patients were retrospectively identified for analysis. Twenty-six patients (53.1%) with myelitis as manifestation of MS/clinically isolated syndrome (CIS), 9 patients (18.4%) with a myelitis due to NMOSD, and 14 patients with a noninflammatory myelopathy (28.6%) (table 1).
Table 1.
Baseline characteristics and cerebrospinal fluid results
FLC-k values in quotient diagrams
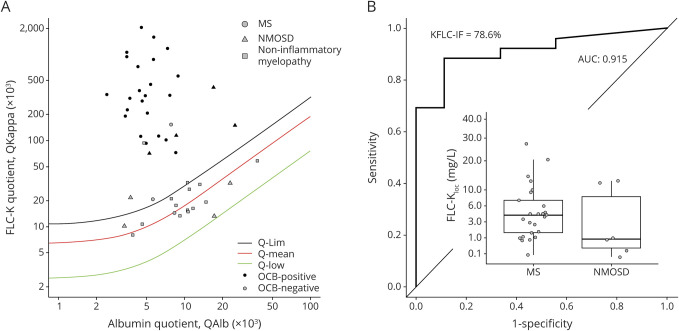
Figure 1A shows the IF of FLC-k values in quotient diagrams. Ninety-six percent (n = 25/26) of the FLC-k quotients in patients with myelitis due to MS/CIS are above the upper discrimination line Qlim representing intrathecal FLC-k synthesis. Sensitivity for OCB detection in CSF in this cohort is 88.5%.
Figure 1. Data of the cohort in a double logarithmic FLC-k Reibergram and ROC analysis.
(A) Data of the FLC-k quotients in a double logarithmic FLC-k Reibergram. The black line shows QFLC-k(lim); the red line shows the QFLC-k(mean). The green line is the lower limit of the reference range QFLC-k(low). Ninety-six percent of the FLC-k quotients in patients with myelitis due to MS or CIS are above the upper discrimination line Qlim. Fifty-five of the patients with a myelitis due to NMOSD showed FLC-k quotients > Qlim. Approximately 85.7% of patients with a noninflammatory myelopathy had FLC-k values < Qlim. (B) ROC analysis in respect to FLC-IF > Qlim. The AUC is 0.915. With a cut-off of 78.6% IF, sensitivity is 88.5%, specificity 88.9% to discriminate patients with MS/CIS and NMOSD. Box plots: The locally synthesized absolute amount of FLC-k (Kloc = [Qkappa(total) − Qkappa(mean)] × Skappa [mg/L]) is significantly higher in patients with myelitis due to MS than in patients with NMOSD (p = 0.038). AUC = area under the curve; CIS = clinically isolated syndrome; FLC-k = free light chains kappa; IF = intrathecal fraction; NMOSD = neuromyelitis optica spectrum disease; OCB = oligoclonal band; Q = quotient; ROC = receiver operating characteristic.
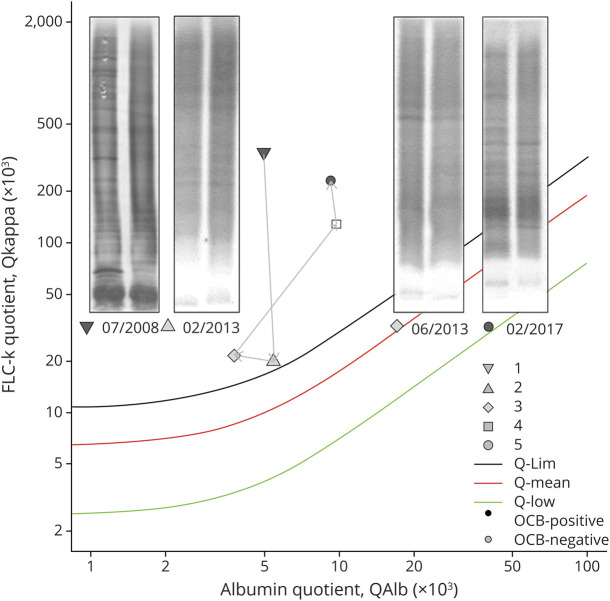
In contrast to myelitis due to MS/CIS, only 5 of 9 (55.6%) patients diagnosed with a NMOSD myelitis showed intrathecal FLC-k synthesis (table 1, figure 1). Of interest is the clinical course of 1 patient whose OCB became transiently negative after stem cell transplantation, although FLC-k quotients remained > Qlim (figure 2).
Figure 2. Data of FLC-k quotients of a patient with NMOSD in a double logarithmic FLC-k Reibergram.
See also the legend of figure 1. Inverted triangle: CSF analysis 07/2008 before immunotherapy, IF 95.1%; triangle: CSF analysis 02/2013 12 months after autologous-SCT, IF 12.5%; square: CSF analysis 06/2013, IF 34.5%; rectangle CSF analysis 02/2017, IF 77.8; circle CSF analysis 02/2017 IF 88.3% (new disease activity). FLC-k = free light chains kappa; IF = intrathecal fraction; neg = negative; NMOSD = neuromyelitis optica spectrum disease; OCB = oligoclonal band; pos = positive; Q = quotient; SCT = stem cell transplantation.
The sensitivity of FLC-k synthesis to detect inflammation in patients with myelitis (due to MS/CIS and NMOSD) is 85.7%, in comparison with 74.3% for OCB detection.
All patients diagnosed with a noninflammatory myelopathy were OCB negative and 2 had FLC-k values > Qlim (14.3%).
The total amount of intrathecal FLC-k synthesis discriminates MS myelitis from NMOSD myelitis
The locally synthesized absolute amount of FLC-k is significantly higher in patients with MS myelitis than in patients with NMOSD myelitis (p = 0.038) or noninflammatory myelopathy (p < 0.0001) in post hoc analysis. Using a ROC analysis, FLC-k IF >78.6% can discriminate between patients with myelitis due to MS and NMOSD with a sensitivity of 88.5% and a specificity of 88.9% (figure 1B).
Discussion
The determination of FLC-k and interpretation in quotient diagrams11 reached a sensitivity of 96% to confirm intrathecal inflammation in patients with a MS myelitis in comparison with 55.6% in patients with NMOSD myelitis and 14.3% in patients with noninflammatory myelopathies. Sensitivity to detect intrathecal inflammation in both cohorts of inflammatory myelitis (MS/CIS and NMOSD) was higher than the OCB analysis as the current gold standard (88.5% for myelitis due to MS/CIS and 33.3% for NMOSD, respectively).
One explanation is that FLC-k probably represents other aspects of inflammation, for example higher values of FLC-k can also reflect intrathecal IgM or A synthesis in contrast to OCB which represents IgG.
Another aspect is the analytical sensitivity of OCB detection in cases with low intrathecal IgG synthesis. As evidenced by case studies with no or small amounts of OCB bands in isoelectric focusing,8 patients with inflammatory diseases and negative OCB still present an FLC-k IF >0%.
The only other study so far describing FLC-k values to discriminate patients with MS and NMOSD obtained comparable results with our study cohort.12 Although using the index method for FLC-k interpretation with the known risk of false positive or negative values11 and not restricting the cohort of MS to myelitis manifestation, the highest FLC-k index values were seen in patients with MS in comparison to NMOSD.12 An advantage of FLC-k analysis is the quantification in comparison with the qualitative OCB analysis. We could identify an IF of 78.6% with a sensitivity of 88.9% and a specificity of 88.5% to discriminate patients with myelitis due to MS and NMOSD.
One major limitation of this study is the small sample size of the patient and the control cohort due to the rarity of the described diagnoses. The proposed FLC-k IF to discriminate patients with MS myelitis and NMOSD myelitis has to be validated preferably in a prospective multicenter study with a larger cohort.
With the hyperbolic reference range in quotient diagrams for FLC-k, it is possible to distinguish inflammatory myelitis from noninflammatory myelopathies. The additional measurement of FLC-k can support the diagnosis in patients with a suspected inflammatory origin of myelitis. A FLC-k IF >78% can be a hint to suspected MS myelitis rather than NMOSD myelitis in clinically unclear cases, in consideration of other surrounding diagnostic results, such as MRI and antibody status.
Glossary
- CIS
clinically isolated syndrome
- FLC-k
free light chain kappa
- IF
intrathecal fraction
- Ig
immunoglobulin
- NMOSD
neuromyelitis optica spectrum disease
- OCB
oligoclonal band
- ROC
receiver operating characteristic
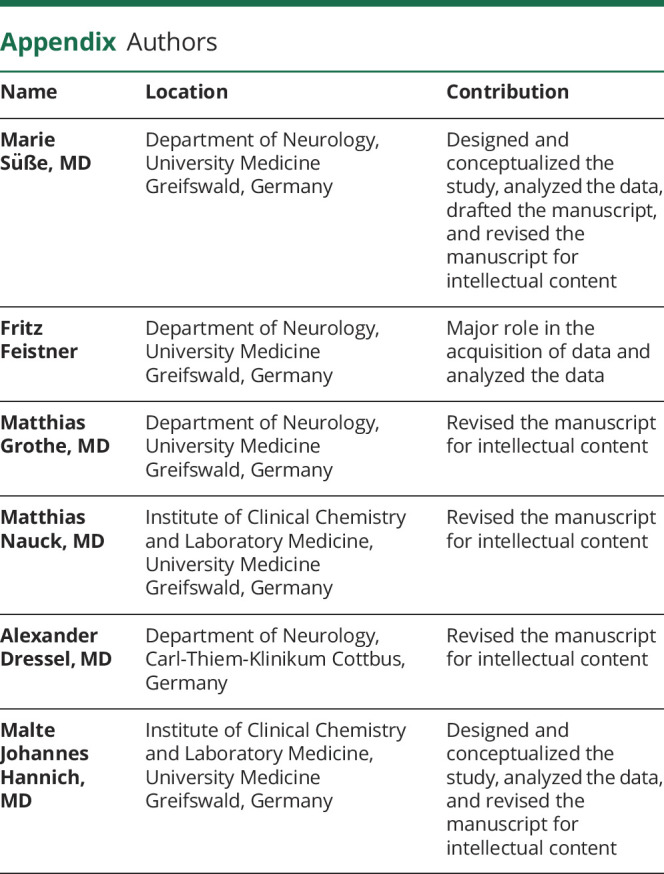
Appendix. Authors

Study funding
This research received no specific grant from any funding agency in the public, commercial, or not-for-profit sectors.
Disclosure
M. Süße and F. Feistner have nothing to disclose. M. Grothe obtained travel reimbursement and speaker's honoraria from Novartis Pharma, Teva Pharmaceuticals, Merck, Sanofi Genzyme, and Biogen Idec as well as research grants from the Federal Ministry for Research and Education in Germany. M. Nauck reports nonfinancial support by Siemens Healthineers, The Binding Site Group, Becton Dickinson, DZHK (German Centre for Cardiovascular Research, Partner Site Greifswald, University Medicine, Greifswald, Germany), DGKL (German Federation of Clinical Chemistry and Laboratory Medicine), German Federal Medical Association, Roche Diagnostics Germany GmbH; he also received personal fees by Boehringer Ingelheim and Becton Dickinson; Grant by DZHK, LVL technologies, Bruker BioSpin, Abbott, Radiometer, Tosoh and IDS Immunodiagnostic Systems Deutschland GmbH. A. Dressel reports speaker honoraria and travel reimbursement to his institution from Siemens Healthineers. M.J. Hannich has nothing to disclose. Go to Neurology.org/NN for full disclosures.
References
- 1.Weidauer S, Wagner M, Nichtweiß M. Magnetic resonance imaging and clinical features in acute and subacute myelopathies. Clin Neuroradiol 2017;27:417–433. [DOI] [PubMed] [Google Scholar]
- 2.Jarius S, Paul F, Franciotta D, et al. Cerebrospinal fluid findings in aquaporin-4 antibody positive neuromyelitis optica: results from 211 lumbar punctures. J Neurol Sci 2011;306:82–90. [DOI] [PubMed] [Google Scholar]
- 3.Barreras P, Fitzgerald KC, Mealy MA, et al. Clinical biomarkers differentiate myelitis from vascular and other causes of myelopathy. Neurology 2018;90:e12–e21. [DOI] [PMC free article] [PubMed] [Google Scholar]
- 4.Dobson R, Ramagopalan S, Davis A, Giovannoni G. Cerebrospinal fluid oligoclonal bands in multiple sclerosis and clinically isolated syndromes: a meta-analysis of prevalence, prognosis and effect of latitude. J Neurol Neurosurg Psychiatry 2013;84:909–914. [DOI] [PubMed] [Google Scholar]
- 5.Wingerchuk DM, Banwell B, Bennett JL, et al. International consensus diagnostic criteria for neuromyelitis optica spectrum disorders. Neurology 2015;85:177–189. [DOI] [PMC free article] [PubMed] [Google Scholar]
- 6.Leurs CE, Twaalfhoven H, Lissenberg-Witte BI, et al. Kappa free light chains is a valid tool in the diagnostics of MS: a large multicenter study. Mult Scler 2020;26:912–923. [DOI] [PMC free article] [PubMed] [Google Scholar]
- 7.Süße M, Hannich M, Petersmann A, et al. Kappa free light chains in cerebrospinal fluid to identify patients with oligoclonal bands. Eur J Neurol 2018;25:1134–1139. [DOI] [PubMed] [Google Scholar]
- 8.Süße M, Feistner F, Holbe C, et al. Diagnostic value of kappa free light chains in patients with one isolated band in isoelectric focusing. Clin Chim Acta 2020;507:205–209. [DOI] [PubMed] [Google Scholar]
- 9.Süße M, Reiber H, Grothe M, et al. Free light chain kappa and the polyspecific immune response in MS and CIS: application of the hyperbolic reference range for most reliable data interpretation. J Neuroimmunol 2020;346:577287. [DOI] [PubMed] [Google Scholar]
- 10.Thompson AJ, Banwell BL, Barkhof F, et al. Diagnosis of multiple sclerosis: 2017 revisions of the McDonald criteria. Lancet Neurol 2018;17:162–173. [DOI] [PubMed] [Google Scholar]
- 11.Reiber H, Zeman D, Kušnierová P, Mundwiler E, Bernasconi L. Diagnostic relevance of free light chains in cerebrospinal fluid: the hyperbolic reference range for reliable data interpretation in quotient diagrams. Clin Chim Acta 2019;497:153–162. [DOI] [PubMed] [Google Scholar]
- 12.Cavalla P, Caropreso P, Limoncelli S, et al. Kappa free light chains index in the differential diagnosis of multiple sclerosis from neuromyelitis optica spectrum disorders and other immune-mediated central nervous system disorders. J Neuroimmunol 2020;339:577122. [DOI] [PubMed] [Google Scholar]
Associated Data
This section collects any data citations, data availability statements, or supplementary materials included in this article.
Data Availability Statement
Anonymized data will be shared by request from any qualified investigator.


