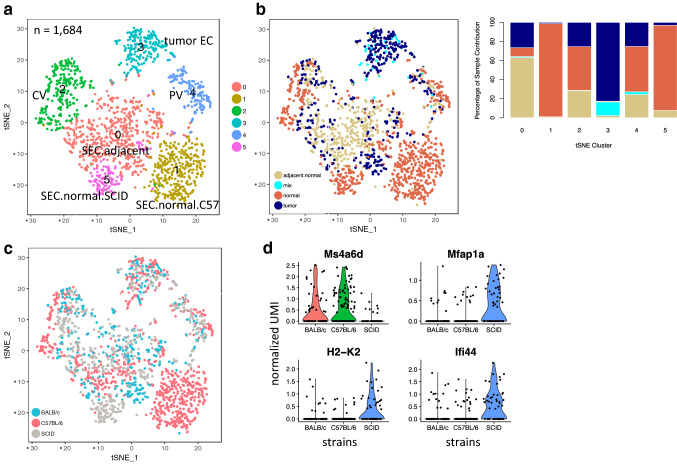
Fig. 3.
Tumor ECs derived from HDD-induced liver tumors of various genetic backgrounds were intermixed. a t-SNE plot of combined endothelial single cells collected from tumor-bearing and naïve liver tissues from C57BL/6, BALB/c and SCID mice. Cells are colored by identified clusters which were annotated by markers, sample type and strain information. b Left, t-SNE plot shown in 3a colored by sample type; Right, percentage of cell contribution from different sample types. c t-SNE plot shown in 3a colored by mouse strain. Liver tumor ECs grown in different mouse strains form one distinct cluster and were well-intermixed within the cluster. d Violin plot showing expression of select differentially expressed genes in tumor ECs from immune-competent and immune-compromised mice

