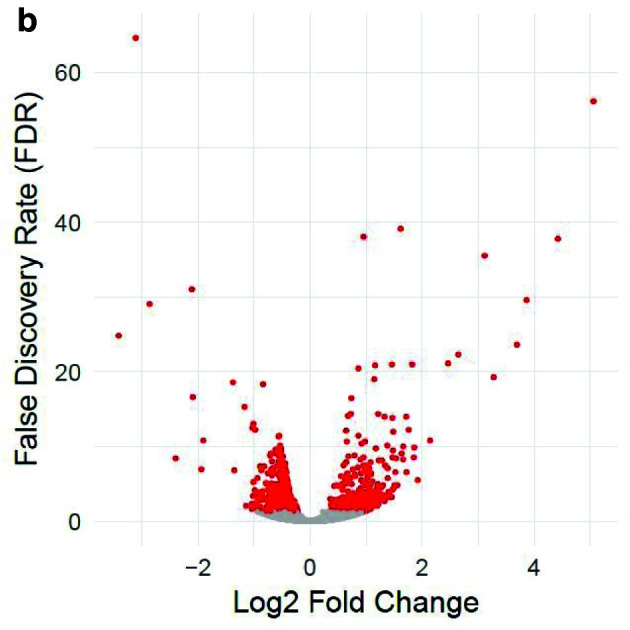
Figure 2b. Volcano plot of differentially expressed genes between euploid yeast colonies versus aneuploid yeast colonies.

The x-axis represents the difference in gene expression between the conditions. False discovery rate (FDR), a method for controlling for multiple testing, is along the y-axis. Each point represents a tested gene (N=3,926). Red points are those reaching genome-wide significance (at FDR<0.05, N=663), whereas grey points are genes not reaching statistical significance (FDR>0.05, N=3,263). Data provided by Mulla et al., 2017.
