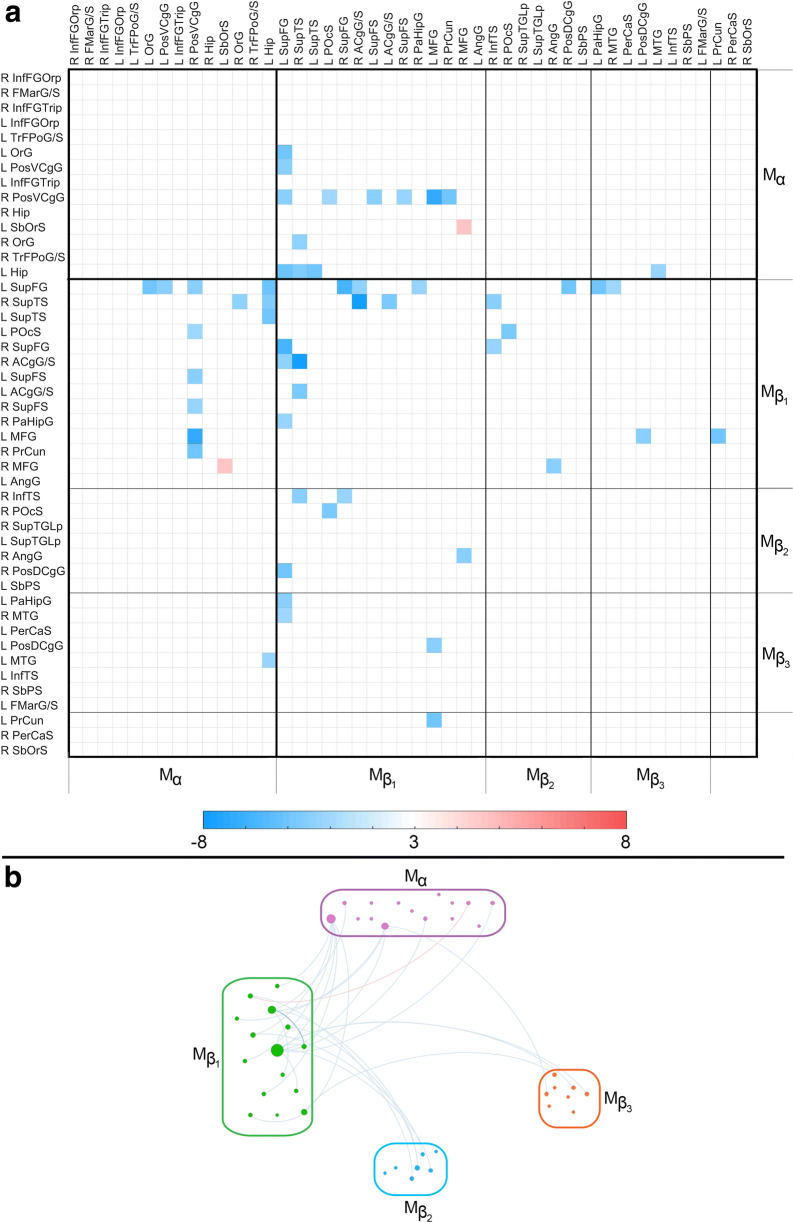
Fig. 3.
The similarity matrix S(TBI, AD) displays statistically significant equivalences of functional correlation ρ between the TBI and AD groups. Each cell Sij encodes the result of testing the null hypothesis of equivalence in ρij across these two groups. This null hypothesis is only tested if both TBI and AD differ significantly from HC. In other words, if there is no significant mean difference in ρ between/either (a) HC and TBI and/or (b) HC and AD, Sij is drawn in white. If both study groups differ from the HC group but no significant statistical equivalence is found across TBI and AD, Sij is also drawn in white. Elsewhere, the color-coded quantity is the value of the TOST procedure’s t statistic with the smallest magnitude. The color-coded quantity is a t statistic with 63 df. If a statistical equivalence is associated with a relatively stronger correlation in both TBI and AD relative to HC, t is positive and Sij is drawn in red; if the correlation is weaker relative to HC, t is negative and Sij is drawn in blue. Boundaries between Mα and Mβ are delineated by thick black lines; boundaries between the submodules of Mβ are delineated by thinner lines. See the caption of Fig. 1 for abbreviations. (B) Graph representation of S(TBI, AD). Nodes are color-coded and grouped by module. Edge colors encode t score values, according to the color bar in (A)

