. 2020 Sep 7;9:e54542. doi: 10.7554/eLife.54542

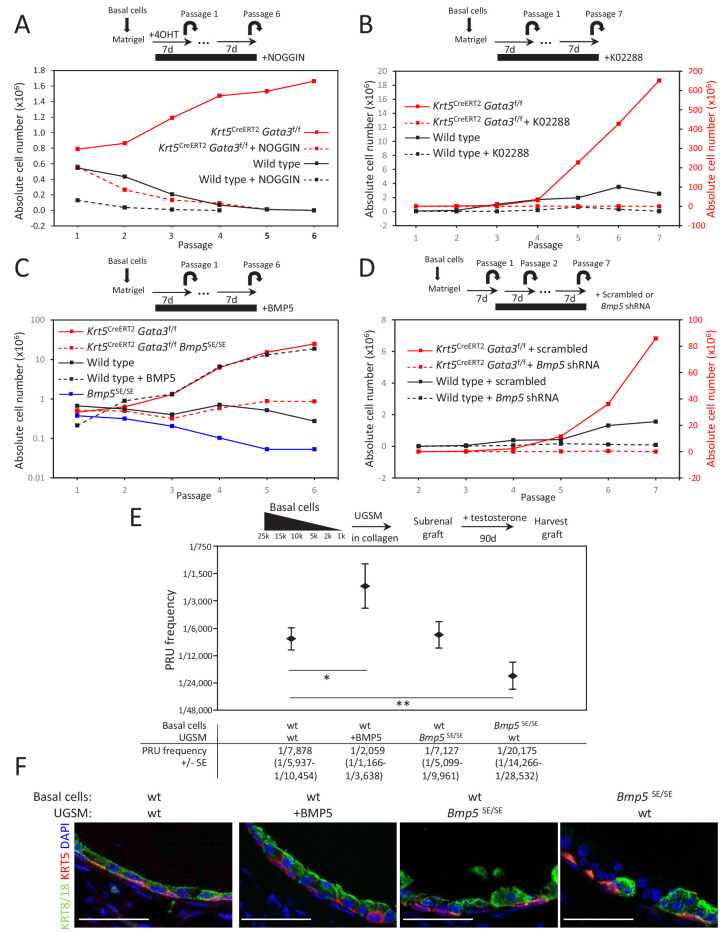
Figure 3. BMP5 increases the propagation potential of basal stem/progenitor cells.

(A–B) Organoid-forming capacity is abrogated by both BMP and BMPR-SMAD1/5/8 inhibitors treatment. Sorted basal cells from wild type or Krt5CreERT2Gata3f/f prostate were grown in presence or absence of NOGGIN (A) or small inhibitor K02288 (B) for six passages. Cre activity was induced by hydroxy-tamoxifen treatment in vitro for the first passage (A) or by tamoxifen injection in vivo 4 weeks prior to culture (B). Organoid-forming potential was assessed as in Figure 1A. (C) Bmp5 loss reduces organoid-forming activity in vitro, while propagation potential capacity of wild type cells is increased by BMP5 treatment. Basal cells (105) from wild type, Bmp5SE/SE, Krt5CreERT2Gata3f/f or Krt5CreERT2Gata3f/f Bmp5SE/SE mice were grown for six passages. Exogenous BMP5 was added to culture media where indicated. Cre activity was induced in vivo as in (B). (D) Bmp5 silencing specifically affects organoid-forming activity in vitro. ShRNA against Bmp5 or scrambled were electroporated in first passage organoid from wild type and Krt5CreERT2Gata3f/f basal cells and grown for seven passages. Cre activity was induced in vivo as in (B). (E) Bmp5 levels affects regenerative potential in vivo. Different numbers of sorted basal prostate cells from Rosa26LTdTomato (control) or Bmp5SE/SERosa26LTdTomato were transplanted with UGSM either wild type, ectopically expressing BMP5 or derived from Bmp5SE/SE mice. Limiting dilution analysis was done as in Figure 1C. Notice that the loss of Bmp5 in basal cells but not in UGSM affects prostate reconstituting units (PRU) frequency (two-tailed t-test as compared to wild-type condition; **p<0.02, *p<0.04). (F) Immunofluorescence of allografts show presence of prostatic ducts expressing both KRT5 and KRT8/18. Scale bar is representative of 50 μm. See also Figure 3—figure supplements 12.

Figure 3—source data 1. Statistical analysis for Figure 3A–D and Figure 3—figure supplement 2A–D.
elife-54542-fig3-data1.pzfx (123.2KB, pzfx)
Figure 3—source data 2. Statistical analysis for Figure 3E.

Figure 3.

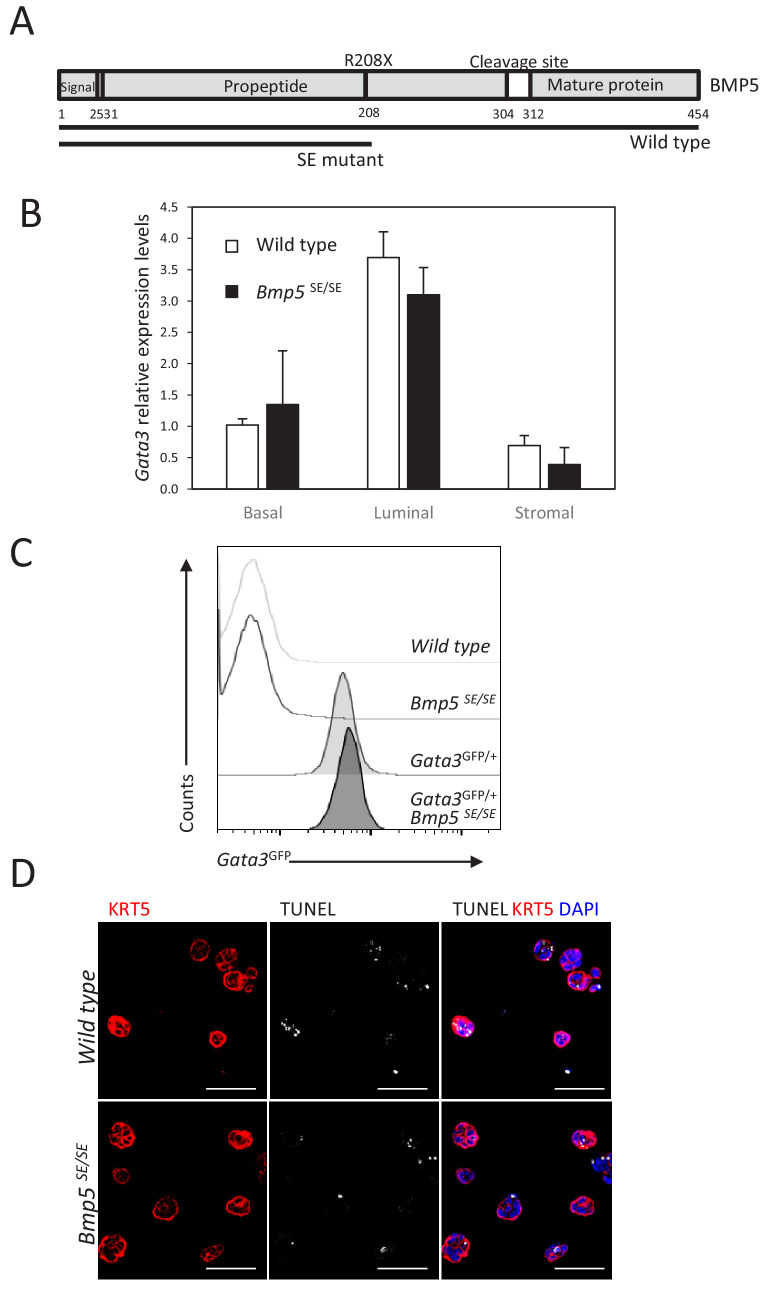
Figure 3—figure supplement 1. GATA3 expression is not regulated by Bmp5 expression in the prostate.

Figure 3—figure supplement 1.

(A) Schematic of BMP5 protein showing the Small Ear (SE) mutation which lead to the introduction of an early stop codon in the propeptide region. (B) Gata3 levels are not affected by Bmp5 loss. Relative expression levels of Gata3 was normalized as in Figure 2E. (C) Representative histogram of endogenous Gata3-driven GFP reporter expression in the basal population of whole prostate from the indicated genotype. (D) Immunofluorescence staining for KRT5 and TUNEL reaction was done on wild type and Bmp5SE/SE 4-day-old organoids at passage 2. Scale bar is representative of 50 μm.
Figure 3—figure supplement 1—source data 1. Expression levels of Gata3 between wild type and Bmp5SE/SE associated with Figure 3—figure supplement 1B.
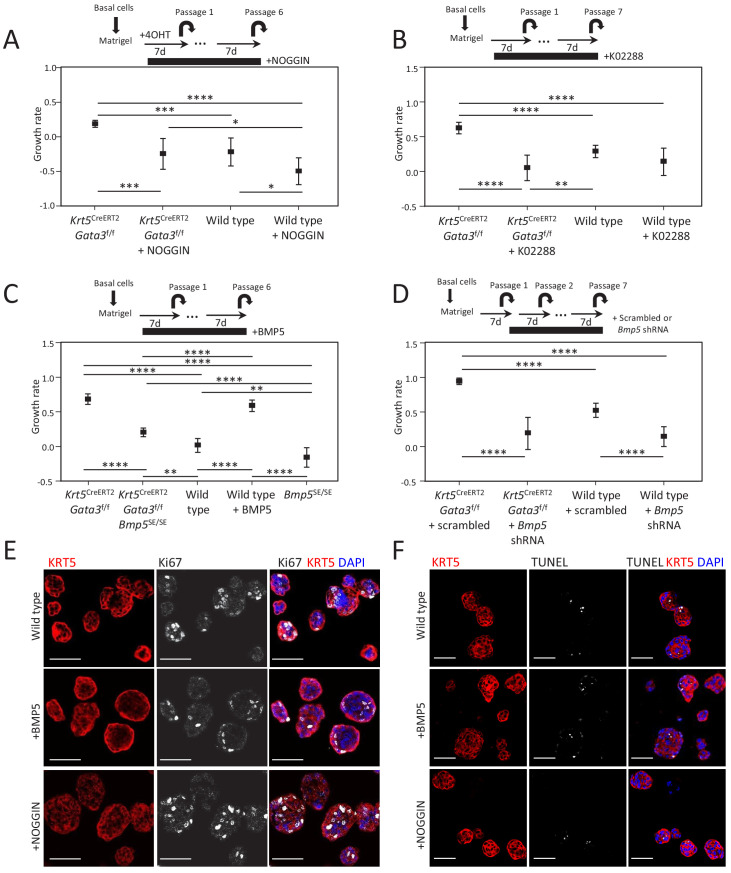
Figure 3—figure supplement 2. BMP5 treatment does not affect proliferation nor survival in organoid.

Figure 3—figure supplement 2.

(A–D) Growth rate of cells upon organoid passage for the indicated genotypes and treatment calculated from nonlinear regression curve fit of data from Figure 3A–D, respectively (one-way ANOVA; *p<0.02, **p<0.005, ***p<0.0005, ****p<0.0001). (E–F) Treatment of organoids with BMP5 or NOGGIN does not affect proliferation nor apoptosis. Immunofluorescence staining for KRT5 and Ki67 (E) or TUNEL reaction (F) were done on wild-type 4-day-old organoids treated or not with BMP5 or NOGGIN at passage 2. Scale bar is representative of 50 μm.
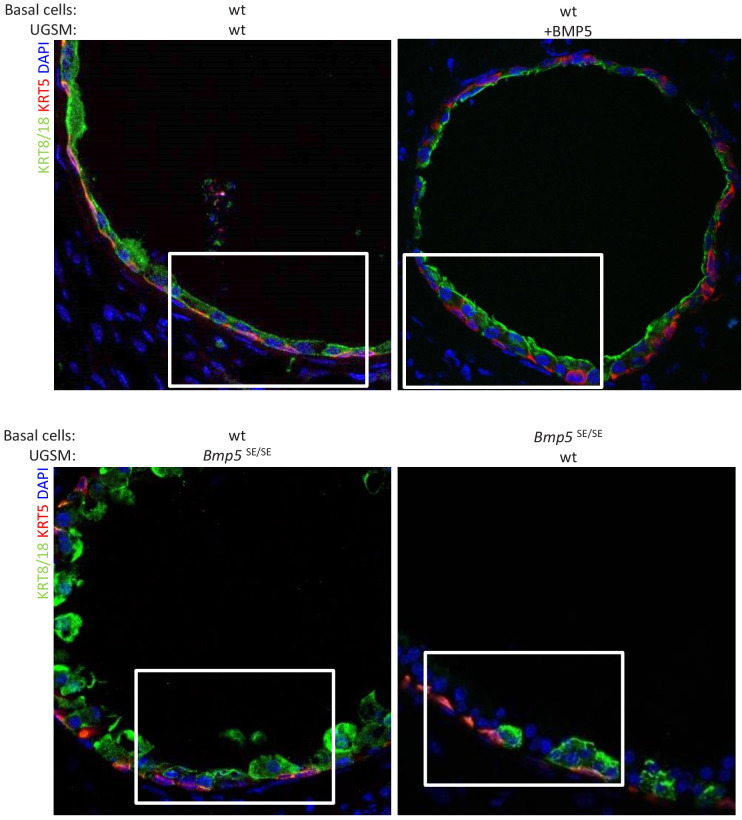
Figure 3—figure supplement 3. Allografts form well-organized ductal structures with both basal and luminal lineages.

Figure 3—figure supplement 3.

Immunofluorescence analysis of lineage-specific markers KRT5 and KRT8/18 in indicated allografts. Lower magnification pictures of allograft from Figure 3D.