

Abstract
Introduction
Patient prosthesis mismatch is known to alter post-operative remodeling of left ventricle adversely in aortic stenosis patients. An indexed orifice area of 0.85 is considered as conventional cutoff for patient prosthesis mismatch based on hemodynamic principles. Many patients have smaller annulus and annulus enlargement techniques may be required to avoid this benchmark which complicates the surgery.
Aims and objectives
To determine incidence of patient prosthesis mismatch (PPM) in our population, to assess left ventricle (LV) regression and impact of indexed effective orifice area on LV regression, and to determine a minimum acceptable cut off indexed orifice area that will result in LV regression.
Materials and methods
A single-center retrospective observational study of all patients who underwent aortic valve replacement surgery for severe aortic stenosis between July 2015 and December 2015 was conducted. Patients who underwent concomitant revascularization or other valve surgery were excluded. Data regarding conventional risk factors for PPM, valve type, and indexed orifice area as well as pre-operative and late post-operative LV mass were collected.
Observations
Thirty-seven of the 91 patients satisfied inclusion criteria. All patients had significant regression in LV mass. The incidence of PPM was 68%. Regression of indexed left ventricular mass showed a positive correlation of with indexed effective orifice area of the prosthetic valve. The correlation coefficient is + 0.48 (95% CI 0.18–0.698). Left ventricular mass regression was significantly higher in patients with indexed effective orifice area more than 0.75 (68.89 ± 29 vs 122.55 ± 58.84, p = 0.028). Relative left ventricular regression also was significantly higher in patients with an indexed effective orifice area more than 0.75 (39.53 ± 13.13 vs 49.73 ± 15.56, p = 0.022). There is a positive correlation between left ventricular regression and the reduction in mean gradient achieved by valve replacement. The correlation coefficient was + 0.35 (95% CI 0.03–0.61).
Conclusions
The incidence of PPM was found to be comparable to literature. There is a positive correlation between left ventricular regression and indexed effective orifice area of the prosthetic valve. Left ventricular regression was significantly higher in patients with an indexed effective area more than 0.75. This can be considered as criteria for significant PPM in study population.
Keywords: Aortic valve surgery, Patient prosthesis mismatch, Prosthesis
Introduction
Aortic stenosis (AS) is the third commonest cardiovascular disease and the commonest valvular heart disease in the developed world [1]. In India, presently, it is the third commonest valvular heart disease after mitral stenosis and mitral incompetence [2].
AS is characterized by progressive narrowing of aortic valve and subsequent left ventricular hypertrophy (LVH). This results in the development of symptoms and adverse events that characterize the later stages of the disease. Hypertrophy of the LV due to AS is known to be associated with increased incidence of stroke, congestive heart failure, and sudden cardiac death [1–5]. Medical interventions presently available are incapable of delaying or halting the progression of LVH.
Relief of mechanical obstruction by aortic valve replacement (AVR) leads to hemodynamic improvement and, subsequently, a substantial reversal of LVH [6]. This can be quantified as a decrease of left ventricular mass. Regression of LV mass occurs early after AVR and continues up to 10 years after surgery. The early and late changes in LV mass following AVR have been studied in detail, but very few studies have analyzed the intermediate time course of regression.
One of the factors that determine regression of LVH is the orifice size of the prosthetic valve implanted. Rahimtoola first proposed that implanting a valve with a smaller than expected effective orifice area (EOA) in relation to the patient’s body surface area (BSA) will result in a higher trans-prosthetic gradient and thus affect clinical outcome [7].
Favorable or adverse left ventricular remodeling is affected by many other factors as well. The specific roles of these factors are still a subject of debate. Age, gender, hemodynamic factors, prosthetic valve types, myocyte alterations, interstitial structures, blood pressure control, and ethnicity can all influence the process of LV regression. Myocardial metabolism and abnormal coronary artery circulation can also influence the changes occurring in LV [8].
LV regression is quantified by the change in indexed LV mass (LVMI). A ratio of difference in LVMI to original LVMI, termed relative regression (RR), can be also be used to quantify the extent of LV regression [4].
Concept of patient prosthesis mismatch
Initial AVRs resulted in high trans-prosthetic gradients. Trans-prosthetic gradient is determined by the geometric orifice area of prosthetic valve and trans-valvar blood flow. Trans-valvar blood flow is essentially the cardiac output. Expected cardiac output in any individual is a function of BSA. Thus, if we divide EOA of the prosthetic valve by BSA of the individual, the resulting value will determine trans-prosthetic pressure gradient [8, 9]. This ratio of EOA and BSA is called indexed effective orifice area (iEOA).
Ex vivo studies has documented an exponential relation between trans-prosthetic pressure gradients and iEOA [10]. These experiments were done assuming a normal resting cardiac index of 3.0 l/min/m2 and 10–50% increment in stroke volume, to account for changes occurring during maximal exercise. The exponential relations between these two parameters show that a small decrease in iEOA produces a large increase in pressure gradient and that the iEOA should ideally be not less than 0.9–1.0 cm2/m2 for aortic prostheses to minimize post-operative gradients.
Rahimtoola coined the term patient prosthesis mismatch (PPM) to denote this condition [7]. PPM is conventionally considered to be present when the EOA, after insertion into the patient, is less than that expected for a normal individual with same BSA. An iEOA of 0.85 cm2/m2 is generally regarded as the threshold for PPM in the aortic position. The iEOA between 0.65 and 0.85 cm2/m2 is classified as moderate PPM and less than 0.65 cm2/m2 is considered as severe PPM [8].
In AS patients, aortic annulus is often small and achieving an iEOA of more than 0.85 cm2/m2 will often require enlargement of aortic root. Aortic root enlargement procedures prolong bypass time and may increase morbidity. It can be observed that incidence of PPM in literature is common and varies between 20 and 70%. It is higher in female patients, older patients, and those with higher BSA [11].
Materials and methods
This is a single-center non-randomized retrospective observational cohort study. Study population comprised of all the patients who underwent AVR in our center between 1 July 2015 and 31 December 2015. A total of 91 patients underwent AVR in this period. Patients who underwent concomitant coronary artery revascularization and mitral or tricuspid valve surgery were excluded. Patients with aortic regurgitation more than three times were also excluded from study. Patients with other severe cardiac comorbidities like cardiomyopathy were excluded as well. Fifty-four out of 91 met exclusion criteria and hence were excluded. Thirty-seven cases were selected for the study. The median age of patients was 57 years (range 16–75 years). Sixty-two percent were males and 38% were females (Table 1).
Table 1.
Demographics
| n | 37 | |
|---|---|---|
| Males | 23 | 62.16% |
| Females | 14 | 37.84% |
| Pathology | ||
| Rheumatic | 5 | 13.51% |
| Degenerative | 23 | 62.16% |
| Bicuspid aortic valve | 9 | 24.32% |
| Patient prosthesis mismatch | ||
| Indexed effective orifice area | ||
| < .65 | 4 | 10.81% |
| 0.65–0.85 | 21 | 56.75% |
| > .85 | 12 | 32.43% |
| Median | Range | |
| Follow-up | 18 months | 13.75–21 m |
Surgical technique
All patients underwent surgical AVR under cardiopulmonary bypass with moderate hypothermia. Cold blood cardioplegia, using a blood cardioplegia delivery system, was delivered through root and augmented through coronary ostia every 30 min (or earlier if electrical activity reappeared). Transverse aortotomy was done, valve leaflets excised, annulus decalcified, and annulus was sized with sizers. Four types of valves were used. Carpentier-Edwards Perimount bioprosthetic valves were used in patients above 60 years. TTK Chitra mono leaflet, St. Jude Masters bileaflet, or St. Jude Regent bileaflet metallic prostheses were used in other patients depending on surgeon’s discretion and availability. Valves were fixed using pledgetted 2–0 ethibond ventriculo-aortic sutures. Aorta was closed in two layers. Mediastinal drains were retained for 24 h. Patients were kept on oral anticoagulation with a target INR between 2 and 3. Anticoagulation was discontinued in patients with bioprosthetic valves after 3 months.
Data collected
Following data was collected from case records: age, sex, height and weight at the time of surgery, clinical status, functional class of symptoms prior to surgery, functional class of symptoms at the time of follow-up, type of valve, and EOA.
Pre-operative echocardiographic values of systolic LV internal diameter (LVESD), diastolic LV internal diameter (LVEDD), posterior wall thickness in diastole (PWD), and inter-ventricular septal thickness in diastole (IVSD) were documented in millimeters (mm). Trans-valvar mean and peak gradients were measured in millimeters of mercury (mmHg). Aortic valve area was measured in square centimeters (cm2) by continuity equation. LV ejection fraction was also documented.
Immediate post-op echocardiogram data of trans-valvar mean and peak gradients as well as 1-year post-surgery values of LVEDD, LVESD, PWD, IVSD, and LV ejection fraction were also collected.
LV mass was calculated using the equation proposed by Devereux et al. [12].
LV mass (g) = 0.8{1.04 [([LVEDD + IVSD + PWD]3 − LVEDD3)]} + 0.6.
Values were interpreted as per following chart suggested by Lang et al. [13]
| Female | Male | |
|---|---|---|
| Reference range | 43–95 | 49–115 |
| Mildly abnormal | 96–108 | 116–131 |
| Moderately abnormal | 109–121 | 132–148 |
| Severely abnormal | ≥ 122 | ≥ 149 |
Relative wall thickness (RWT) was calculated as per following equation.
RWT < 0.06 was considered as eccentric hypertrophy [13].
Indexed LV mass, the ratio of LV mass to body surface area, was calculated using the formula
Actual LV mass regression was calculated as the difference between pre-operative and follow-up LV mass values in grams. Relative LV mass regression was defined as the ratio of actual LV mass regression to pre-operative LV mass.
Statistical analysis
All data were coded and entered in an excel sheet and analyzed using statistics pack of MS Excel 2016 and Statcalc online calculators. Quantitative data were analyzed with mean, standard deviation, and the Student t test. Qualitative data were analyzed with chi-square test. Regression analysis was done with the Pearson coefficient.
Observations and results
Majority of our patients (56.75%) had New York Heart Association (NYHA) class II symptoms at initial presentation. 28.37% had class III symptoms. Ninety-four percentage were asymptomatic at review. Degenerative valve diseases accounted for 62%, bicuspid aortic valve for 24%, and rheumatic heart disease for 14% (Table 1).
Twenty-one sized valves were used in about half of the patients. Annulus of 24% patients admitted 19 sized valves and 16%, 23 sized valves. Bioprosthetic valves were used in 16 patients. Metallic prostheses of three different models were used in 21 patients. A Carpentier-Edwards Perimount valve was the commonest used model. TTK Chitra valves were the second most commonly used model (Fig.1). Severe PPM was present in 11%, moderate PPM in 57%, and no PPM in 32% of patients (Fig. 2). PPM was more common in Perimount valves (62.5%) and TTK Chitra valves (71.42%) (Table 2). Incidence of PPM was similar in both male and female patients. 69.23% of female patients and 65% male patients developed PPM.
Fig. 1.

Valve models vs sizes
Fig. 2.
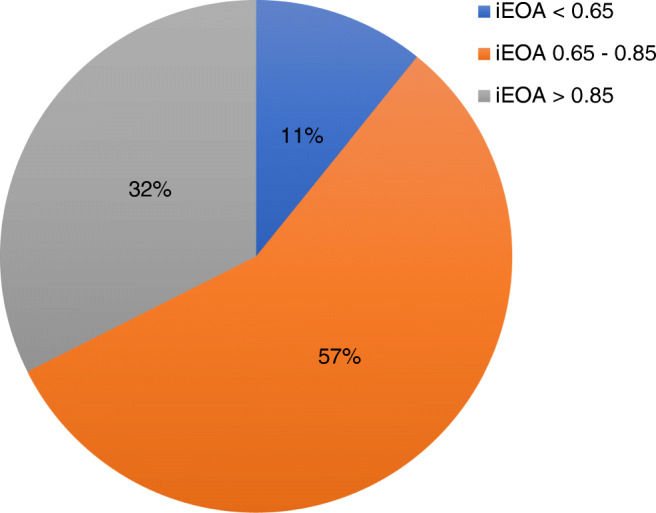
Incidence of PPM
Table 2.
Comparison of patients with and without PPM
| PPM | No PPM | ||
|---|---|---|---|
| Mean age | 54.77 (± 13.29) | 50.91 (± 10.92) | p = 0.41 |
| BSA | 1.65 (± 0.19) | 1.70 (± 0.12) | p = 0.39 |
| Sex | PPM% | ||
| Males | 15 | 8 | 65.21% |
| Females | 10 | 4 | 71.42% |
| Type of valve | |||
| TTK Chitra | 10 | 4 | 71.42% |
| St. Jude | 1 | 6 | 14.28% |
| Perimount | 10 | 6 | 62.50% |
| AS gradient | p value | ||
| Pre-operative | 58 (± 17.01) | 62.25 (± 21.71) | 0.08 |
| Early post-surgery | 15.96 (± 7.44) | 14.92 (± 8.09) | 0.17 |
| Late post-surgery | 16.62 (± 6.98) | 13.33 (± 3.42) | 0.10 |
| LV mass regression (g/m2) | 89.16 (± 45.78) | 117.78 (± 66.9) | > 0.01 |
Both mean and peak aortic valve gradients fell significantly following AVR. There was no significant difference between aortic valve gradients in early and late echocardiograms. The average peak gradient reduced from 102.11 ± 30.93 to 27.5 ± 9.83 mmHg following AVR. The average mean gradient fell from 59.30 ± 18.26 to 15.53 ± 6.18 mmHg. The mean LV internal diameter reduced from 47.81 ± 6.26 mm to 43.25 ± 5.38 (p < 0.01). LV wall thickness reduced significantly from 16.61 ± 3.81 to 11.78 ± 2.78 following AVR. Only one patient showed an increase in thickness of posterior LV wall (p < 0.01).
The LV mass reduced from 335.86 ± 108.65 g to 176.47 ± 69.03 g (p < 0.01). LV mass showed significant reduction in all patients. LVMI also reduced from 206 ± 67.44 g/m2 to 105.88 ± 38.99 m2 (p < 0.01). Regression of LVMI showed a positive correlation to iEOA with a correlation coefficient of + 0.48 (95% CI 0.18–0.698) (Fig. 3). Relative LV mass regression also showed a positive correlation, though correlation coefficient was only + 0.19 (95% CI − 0.14–+ 0.19). LV regression was observed to be independent of trans-valvar gradients after surgery. The correlation coefficients of the mean and peak post-operative AV gradients to relative LV mass regression were − 0.02 and − 0.05 respectively.
Fig. 3.

LV mass regression vs iEOA
A positive correlation was noticed between reduction values achieved in mean aortic valve gradient and LVMI regression. Correlation coefficient was + 0.35 (95% CI 0.03–0.61) (Fig. 4). There was no statistically significant difference in AV gradient between PPM and no PPM patients in pre-operative, immediate post-operative, and follow-up period (Table 2). Pre-operative LVMI was significantly higher in no PPM group (189 ± 45.99 vs 236 ± 92.18). There was no significant difference between both groups on follow-up.
Fig. 4.

LV regression vs reduction in mean AV gradient
LV mass regression and effective orifice area
Regression of LVMI was compared in patients with iEOA more than and those with 0.75 and less. LV regression was significantly more in patients with iEOA of more than 0.75 (68.89 ± 29.00 vs 122.55 ± 58.84) (p = 0.028) (Table 3) (Fig. 5). Relative regression of LVMI was compared in patients with iEOA more than 0.75 and those with 0.75 and less. A statistically significant difference was noted between both groups (39.54 ± 13.13 vs 49.74 ± 15.56) (p = 0.022). The RR of LV mass was almost 10% less in patients with iEOA < 0.75 (Table 3) (Fig. 6).
Table 3.
Comparison of LV regression in patients with iEOA less than 0.75 and above
| iEOA < 0.75 | iEOA > 0.75 | p | |
|---|---|---|---|
| LVMI Regression (g/m2) | 68.89 (± 29.00) | 122.55 (± 58.84) | 0.028 |
| Relative regression (%) | 39.53 (± 13.13) | 49.73 (± 15.56) | 0.022 |
Fig. 5.

LV regression in iEOA > 0.75 vs < 0.75
Fig. 6.

Relative LV regression in iEOA > 0.75 vs < 0.75
Discussion
Impact of PPM in literature
Even though early long-term and short-term follow-up studies had shown a significantly increased incidence of mortality as well as morbidity in patients with PPM, later reports appeared to be contradictory [6, 14–17]. Howell et al. reported that there is no difference in medium- and long-term mortality in patients with PPM [18, 19]. Hong et al. observed a higher 12-year mortality for patients with severe PPM [20]. Fuster et al. has reported that PPM adversely impacts LV mass regression up to 1 year. This study also suggested that impaired LV mass regression occurs more in severely hypertrophied hearts [21]. Ruel et al. observed that PPM affected outcome only in patients with severe LV dysfunction [22].
Kaminishi et al. observed that age, aortic valve stenosis, dyslipidemia, hypertension, old myocardial infarction, previous percutaneous coronary artery intervention, diabetes mellitus, cerebrovascular disease, and high body mass index were the risk factors for PPM [23]. PPM was not an independent risk factor for short-term mortality [23]. Similar observations were made by Medalion and Lapar as well [24, 25]. Sportelli et al. reported an incidence of 53.8% of PPM. But there was no significant difference in mortality or clinical status in patients with PPM [26]. Hernández-Vaquero et al. observed that PPM is not associated with any adverse outcome in young and middle-aged individuals [27]. Hanayama et al. and Kato et al. observed that the valve size and PPM is not an important factor determining clinical outcome in intermediate and long terms respectively [28, 29].
Coming to Asian scenario, Guo et al. have reported that PPM is associated with increased 30-day mortality in Chinese population [30]. A meta-analysis in this subject showed an increased all-cause and cardiac mortality in patients with PPM [31]. Another recently published meta-analysis by Chen et al. noticed that moderate PPM is associated with poor prognosis only in younger and female patients with severe LV dysfunction [32]. Dayan et al. observed an increased perioperative and overall mortality in patients with PPM and recommended avoidance of severe PPM in all patients less than 70 years [33]. An Indian study by Joshi et al. showed no difference between early outcomes in PPM patients [34]. Singh et al. studied LV regression in rheumatic AS in Indian population and found out that LV regression was independent of the valve size [35].
Sixty-two percent of our patients were males and 38% were females. The sex distribution was comparable with previous studies, which showed an incidence in males varying from 41 to 77.8% [6, 35]. The median age at surgery in our patients was 57 with the youngest patient being 16 years old and the oldest, 75. The mean age at the time of surgery in Western literature varied between 58.1 and 71.1 years. Joshi et al. in their study in Indian population report that the mean age at surgery was 43.2, much younger than that of the Western population [34].
Fifty-seven of our patients had NYHA class II and 38% had class III symptoms at presentation. Five percent were asymptomatic prior to surgery. Ninety-four were asymptomatic on follow-up. Of the two symptomatic patients, one had developed significant tricuspid regurgitation. One patient had developed prosthetic valve thrombosis due to noncompliance of anticoagulation. Her symptoms subsided following successful thrombolysis.
Degenerative valve disease was the pathology in 62% of patients, bicuspid aortic valve in 24%, and rheumatic heart disease in 14%. Dare et al. have also reported that predominant pathology in aortic stenosis was degenerative which accounts for 51%; 36% were bicuspid aortic valves and 14% rheumatic [36]. Our data concurred with these findings. But this observation was in contrast with the previous Indian data published in 2006 which showed rheumatic etiology in 75.5% and degenerative causes in 24.5% patients [35].
Metallic valves were used in 56.76% patients while bioprosthetic valves were used in 43.24%. This higher incidence of use of metallic valve compared to international data may be due to lower age of patients and economic constraints.
Age, higher BMI, use of bioprosthetic valve, and female gender are classically considered to be associated with higher incidence of PPM [11, 15, 25, 26, 33]. However, no gender predilection was observed for PPM in our study. We could not find any difference between age distribution of patients with and without PPM. Incidence of PPM was higher in Perimount bioprosthetic valves at 81.81% against 71.42% in TTK Chitra and 14.48% in St. Jude valves. This may be influenced by the fact that only larger annulus size models of St. Jude valves were available locally during the study period.
Both mean and peak aortic valve gradients fell significantly in all patients following AVR. In all patients, trans-valvar gradients subsided to normal. There was no significant difference between aortic valve gradients in early and late post-operative echoes. Average peak gradient reduced from 102.11 ± 30.93 to 27.5 ± 9.83 mmHg following AVR. The average mean gradient fell from 59.30 ± 18.26 to 15.53 ± 6.18 mmHg. On late follow-up, the peak gradient was 29.76 ± 11.48 and the mean gradient was 15.46 ± 7.52.
LV internal diameter, posterior wall thickness, and septal thickness reduced significantly following AVR. LVMI and relative regression of LVMI in our patients were higher than the Western data. Pre-op LVMI in our patients were 206 ± 67.44 and post-operative LVMI was 105.88 ± 38.99. This was consistent with the findings of a 3-month follow-up study reported by Singh et al., where pre-operative LVMI was 199 g ± 79.5 g/m2 and at 3 months post-aortic valve replacement, reduced to 130 g ± 49.0 g/m2.
Regression of LVMI showed a positive correlation of with iEOA with a correlation coefficient of + 0.48. The mean LVMI regression was significantly higher in patients with conventional definition of PPM. Data was further analyzed as four groups with iEOA< 0.65, 0.65–0.75, 0.75–0.85, and > 0.85. There was a significant difference between LVMI regression values in all four groups. Further evaluation showed that LVMI was significantly higher in patients with iEOA more than 0.75. Relative reduction of LV mass was also higher in this group.
No significant relation was noticed between LVMI regression and post-operative trans-valvar gradient. This may be because normal gradients were achieved in all patients after surgery. But we have observed a positive correlation between LV regression and the reduction in mean trans-valvar gradient achieved by AVR.
Conclusion
Incidence of PPM in our patients was comparable with historical data. Age, gender, or BSA did not influence occurrence of PPM. The mean pre-operative LV mass was higher in our patients compared to literature data. Pre-operative LV mass was significantly higher in no PPM group though there was no significant difference between both groups at the time of follow-up.
LV regression showed a positive correlation with the reduction of mean aortic gradient achieved by AVR. There was no correlation between post-operative mean trans-valvar gradients and LV regression.
AVR caused significant LV regression in all patients irrespective of the presence of PPM. But there is a positive correlation between the extent of LV regression and iEOA. LV mass regression was significantly higher in patients with iEOA of more than 0.75. So, iEOA less than or equal to 0.75 can be considered as the criteria of clinically significant PPM in the study population. Clinical implication of LV regression considering iEOA 0.75 as limit of PPM requires to be validated through further studies.
Limitations
Major limitations include inter-operator variability in echocardiographic assessment of LV dimensions, differences in availability of valve models, and small sample size.
Acknowledgements
The authors thank Mr. Kulwant Singh Kappor, MSc (Biostatistics) for his help with the statistical analysis.
Compliance with ethical standards
Conflict of interest
The authors declare that they have no conflict of interest.
Ethical issues
Ethical approval with waiver of consent was obtained from Institutional Ethics Committee prior to commencement of study.
Footnotes
Discussant
Prof Milind Hote,
Professor, CTVS,
All India Institute of Medical Sciences, New Delhi.
Q1. It is an interesting study that seeks to look at the issue of PPM from another angle based on the conclusion statement “LV mass regression was significantly higher in patients with iEOA more than 0.75. This can be considered as criteria for significant PPM in study population”.
The study proposes to use LV mass regression as the judging criteria; compared to the conventional use of iEOA. So do the authors mean the patients in whom we implant prosthetic valves with 0.75 iEOA, these patients are NOT LIKELY to have any disabling symptoms in the immediate term and long term?.
Ans.: The outcome measured in our study is the extent of LV regression following AVR and we observe that LV regression in patients with iEOA between 0.75 and 0.85 is comparable to that in patients with iEOA more than 0.85, the conventional cut off for PPM. This in turn is significantly higher than those with iEOA less than 0.75. Since the pathophysiology in AS is closely associated with LV hypertrophy, the risk of developing disabling symptoms in patients with iEOA between 0.75 and 0.85 should be equal to those with iEOA more than 0.85.
Q2. There are conflicting reports available in literature on correlation between PPM and mortality. Some series say the mortality is increased, others deny the same ( no effect/equivocal effect ), and there is a recent report to the contrary also –Ana Kadkhodayan et al in“ Structural Heart” journal, 2017 issue, wherein they compared the 30 day mortality and LV mass regression between 2 groups ( Surgical AVR vs TAVR ). They found that group with HIGHER LV mass regression had significantly HIGHER 30 day mortality.
What in your estimate, would be the impact of using iEOA of 0.75 on long term mortality?.
Ans.: We had zero mortality during the duration of our study. Hence, we cannot project any estimates regarding long term survival solely on the basis of this study.
In the study of Kadkhodayan et al which compared outcome of surgical AVR with transcatheter AVR, mean age of patients was 80, with 72% having CAD while our population is significantly younger with lesser co-morbidities. Moreover, the authors themselves have attributed this anomalous result to difference in geometrical factors rather than actual difference in LV mass. So it may not be prudent to compare these results directly.
Q3. Do the authors recommend a larger study ( the study population is small in the present study, n=37), for the readers to discern better the pros and cons of using conventional iEOA (0.85 vs 0.75) for their patients. If yes, what should be the design of such a study?
Ans.: A larger prospective observational study minimizing observer variability in echocardiographic measurements should be performed to ratify our observations. A randomized controlled trial may be considered in patients with smaller aortic roots, where AVR can achieve an iEOA >0.75, but an aortic root enlargement procedure is required to ensure iEOA >0.85.
Q4. PPM is common (20-70 %) in world literature, following AVR in Aortic stenosis patients, your take?.
Ans.: PPM is not uncommon, nor is PPM fully avoidable. Even with root enlargement procedures, a maximum of 2 size increment only can be achieved. Patients with higher BSA and small roots are always at risk of developing PPM. Apparently, many surgeons prefer PPM rather than doing complex root enlargement procedures.
Q5. LV regression occurs in all; more in patients with no PPM; less regression is seen in patients having PPM. These 2 points are pretty well established. Some papers say that morbidity – mortality is more if we see the subset of patients having reduced EF. (Ruel M, Al-Faleh H, Kulik A, Chan KL, Mesana TG, Burwash IG. J Thorac Cardiovasc Surg. 2006 May;131(5):1036-44).
Would the authors suggest adding correlation with preoperative EF in their next study group of patients?
Ans.: Yes. Since we did not observe any mortality, it would have been irrelevant in this study. But in any further study, this should be considered as well.
Q6. Rahimtoola gave a very simple and elegant definition of PPM – If prosthetic valve area is less than natural area, (0.85), it qualifies as PPM. His onus was on suggesting that the abnormal hemodynamics that will occur as a result of PPM, are likely to cause morbidity and mortality. Literature is equivocal about the true correlation between PPM – LV regression – resulting patient morbidity & mortality. So why should we shift the goalpost of defining PPM from 0.85 to 0.75? Are we not recommending incomplete surgery?.
Ans.: Original benchmark of PPM is based on theoretical predictions and hemodynamic calculations. We on the other hand have attempted to assess the adequacy of valve area based on LV regression. LV regression is the most important quantifiable parameter which is believed to be capable of influencing clinical outcome after AVR.
Most of the systems in human body come with a level of redundancy and exact replication of the original iEOA may not be necessary to achieve an acceptable clinical outcome.
Q7. Why the observed regression is more in some patients and less in others for the same iEOA? Do the authors think that there is some genetic variability in the degree of regression that may occur in a patient after say a 50 mm Hg reduction in valve gradient?.
Ans.: There can be other confounding variables including genetic variability, hypertension and use of medications like ACE inhibitors that could have influenced LV regression. The study can be repeated in a bigger population and the data can be subjected to multivariate analysis to detect these factors.
References
- 1.Nathaniel S, Saligram S, Innasimuthu AL. Aortic stenosis: an update. World J Cardiol. 2010;2:135–139. doi: 10.4330/wjc.v2.i6.135. [DOI] [PMC free article] [PubMed] [Google Scholar]
- 2.Manjunath CN, Srinivas P, Ravindranath KS, Dhanalakshmi C. Incidence and patterns of valvular heart disease in a tertiary care high-volume cardiac center: a single center experience. Indian Heart J. 2014;66:320–326. doi: 10.1016/j.ihj.2014.03.010. [DOI] [PMC free article] [PubMed] [Google Scholar]
- 3.Apostolakis E, Baikoussis NG, Papakonstantinou NA, Goudevenos J. Patient-prosthesis mismatch and strategies to prevent it during aortic valve replacement. Hell J Cardiol. 2011;52:41–51. [PubMed] [Google Scholar]
- 4.Horstkotte D, Loogen F. The natural history of aortic valve stenosis. Eur Heart J. 1988;9:E57–E64. doi: 10.1093/eurheartj/9.suppl_E.57. [DOI] [PubMed] [Google Scholar]
- 5.Levy D, Garrison RJ, Savage DD, Kannel WB, Castelli WP. Left ventricular mass and incidence of coronary heart disease in an elderly cohort: the Framingham Heart Study. Ann Intern Med. 1989;110:101–107. doi: 10.7326/0003-4819-110-2-101. [DOI] [PubMed] [Google Scholar]
- 6.Mohty D, Dumesnil JG, Echahidi N, et al. Impact of prosthesis-patient mismatch on long-term survival after aortic valve replacement: influence of age, obesity and left ventricular dysfunction. J Am Coll Cardiol. 2009;53:39–47. doi: 10.1016/j.jacc.2008.09.022. [DOI] [PubMed] [Google Scholar]
- 7.Rahimtoola SH. The problem of valve prosthesis-patient mismatch. Circulation. 1978;58:20–24. doi: 10.1161/01.CIR.58.1.20. [DOI] [PubMed] [Google Scholar]
- 8.Pibarot P, Dumesnil JG. Prosthesis-patient mismatch: definition, clinical impact, and prevention. Heart. 2006;92:1022–1029. doi: 10.1136/hrt.2005.067363. [DOI] [PMC free article] [PubMed] [Google Scholar]
- 9.Dumesnil JG, Honos GN, Lemieux M, Beauchemin J. Validation and applications of indexed aortic prosthetic valve areas calculated by Doppler echocardiography. J Am Coll Cardiol. 1990;16:637–643. doi: 10.1016/0735-1097(90)90355-S. [DOI] [PubMed] [Google Scholar]
- 10.Dumesnil JG, Yoganathan AP. Valve prosthesis hemodynamics and the problem of high transprosthetic pressure gradients. Eur J Cardiothorac Surg. 1992;6:S34–S38. doi: 10.1093/ejcts/6.Supplement_1.S34. [DOI] [PubMed] [Google Scholar]
- 11.Bonderman D, Graf A, Kammerlander AA, et al. Factors determining patient-prosthesis mismatch after aortic valve replacement - a prospective cohort study. PLoS One. 2013;8:e81940. doi: 10.1371/journal.pone.0081940. [DOI] [PMC free article] [PubMed] [Google Scholar]
- 12.Devereux RB, Alonso DR, Lutas EM, et al. Echocardiographic assessment of left ventricular hypertrophy: comparison to necropsy findings. Am J Cardiol. 1986;57:450–458. doi: 10.1016/0002-9149(86)90771-X. [DOI] [PubMed] [Google Scholar]
- 13.Lang RM, Bierig M, Devereux RB, et al. Recommendations for chamber quantification: a report from the American Society of Echocardiography’s guidelines and standards committee and the chamber quantification writing group, developed in conjunction with the European Association of Echocardiography, a branch of the European Society of Cardiology. J Am Soc Echocardiogr. 2005;18:1440–1463. doi: 10.1016/j.echo.2005.10.005. [DOI] [PubMed] [Google Scholar]
- 14.Pibarot P, Dumesnil JG. The relevance of prosthesis-patient mismatch after aortic valve replacement. Nat Clin Pract Cardiovasc Med. 2008;5:764–765. doi: 10.1038/ncpcardio1366. [DOI] [PubMed] [Google Scholar]
- 15.Pibarot P, Dumesnil JG. Hemodynamic and clinical impact of prosthesis-patient mismatch in the aortic valve position and its prevention. J Am Coll Cardiol. 2000;36:1131–1141. doi: 10.1016/S0735-1097(00)00859-7. [DOI] [PubMed] [Google Scholar]
- 16.Walther T, Rastan A, Falk V, et al. Patient prosthesis mismatch affects short- and long-term outcomes after aortic valve replacement. Eur J Cardiothorac Surg. 2006;30:15–19. doi: 10.1016/j.ejcts.2006.04.007. [DOI] [PubMed] [Google Scholar]
- 17.Kohsaka S, Mohan S, Virani S, et al. Prosthesis-patient mismatch affects long-term survival after mechanical valve replacement. J Thorac Cardiovasc Surg. 2008;135:1076–1080. doi: 10.1016/j.jtcvs.2007.11.032. [DOI] [PubMed] [Google Scholar]
- 18.Howell NJ, Keogh BE, Ray D, et al. Patient-prosthesis mismatch in patients with aortic stenosis undergoing isolated aortic valve replacement does not affect survival. Ann Thorac Surg. 2010;89:60–64. doi: 10.1016/j.athoracsur.2009.07.037. [DOI] [PubMed] [Google Scholar]
- 19.Howell NJ, Keogh BE, Barnet V, et al. Patient-prosthesis mismatch does not affect survival following aortic valve replacement. Eur J Cardiothorac Surg. 2006;30:10–14. doi: 10.1016/j.ejcts.2006.03.046. [DOI] [PubMed] [Google Scholar]
- 20.Hong S, Yi GJ, Youn YN, Lee S, Yoo KJ, Chang BC. Effect of the prosthesis-patient mismatch on long-term clinical outcomes after isolated aortic valve replacement for aortic stenosis: a prospective observational study. J Thorac Cardiov Surg. 2013;146:1098–1104. doi: 10.1016/j.jtcvs.2012.07.101. [DOI] [PubMed] [Google Scholar]
- 21.Fuster RG, Montero Argudo JA, Albarova OG, et al. Patient-prosthesis mismatch in aortic valve replacement: really tolerable? Eur J Cardiothorac Surg. 2005;27:441–449. doi: 10.1016/j.ejcts.2004.11.022. [DOI] [PubMed] [Google Scholar]
- 22.Ruel M, Al-Faleh H, Kulik A, Chan KL, Mesana TG, Burwash IG. Prosthesis-patient mismatch after aortic valve replacement predominantly affects patients with preexisting left ventricular dysfunction: effect on survival, freedom from heart failure, and left ventricular mass regression. J Thorac Cardiovasc Surg. 2006;131:1036–1044. doi: 10.1016/j.jtcvs.2005.10.028. [DOI] [PubMed] [Google Scholar]
- 23.Kaminishi Y, Misawa Y, Kobayashi J, et al. Patient-prosthesis mismatch in patients with aortic valve replacement. Gen Thorac Cardiovasc Surg. 2013;61:274–279. doi: 10.1007/s11748-013-0216-6. [DOI] [PMC free article] [PubMed] [Google Scholar]
- 24.Medalion B, Blackstone EH, Lytle BW, White J, Arnold JH, Cosgrove DM. Aortic valve replacement: is valve size important? J Thorac Cardiovasc Surg. 2000;119:963–974. doi: 10.1016/S0022-5223(00)70091-2. [DOI] [PubMed] [Google Scholar]
- 25.LaPar DJ, Ailawadi G, Bhamidipati CM, et al. Small prosthesis size in aortic valve replacement does not affect mortality. Ann Thorac Surg. 2011;92:880–888. doi: 10.1016/j.athoracsur.2011.04.105. [DOI] [PMC free article] [PubMed] [Google Scholar]
- 26.Sportelli E, Regesta T, Salsano A, et al. Does patient-prosthesis mismatch after aortic valve replacement affect survival and quality of life in elderly patients? J Cardiovasc Med. 2016;17:137–143. doi: 10.2459/JCM.0000000000000292. [DOI] [PubMed] [Google Scholar]
- 27.Hernández-Vaquero D, Llosa JC, Díaz R, et al. Impact of patient-prosthesis mismatch on 30-day outcomes in young and middle-aged patients undergoing aortic valve replacement. J Cardiothorac Surg. 2012;7:46. doi: 10.1186/1749-8090-7-46. [DOI] [PMC free article] [PubMed] [Google Scholar]
- 28.Hanayama N, Christakis GT, Mallidi HR, et al. Patient prosthesis mismatch is rare after aortic valve replacement: valve size may be irrelevant. Ann Thorac Surg. 2002;73:1822–1829. doi: 10.1016/S0003-4975(02)03582-8. [DOI] [PubMed] [Google Scholar]
- 29.Kato Y, Suehiro S, Shibata T, Sasaki Y, Hirai H. Impact of valve prosthesis-patient mismatch on long-term survival and left ventricular mass regression after aortic valve replacement for aortic stenosis. J Card Surg. 2007;22:314–319. doi: 10.1111/j.1540-8191.2007.00414.x. [DOI] [PubMed] [Google Scholar]
- 30.Guo L, Zheng J, Chen L, et al. Impact of prosthesis–patient mismatch on short-term outcomes after aortic valve replacement: a retrospective analysis in East China. J Cardiothorac Surg. 2017;12:42. doi: 10.1186/s13019-017-0596-2. [DOI] [PMC free article] [PubMed] [Google Scholar]
- 31.Head SJ, Mokhles MM, Osnabrugge RLJ, et al. The impact of prosthesis–patient mismatch on long-term survival after aortic valve replacement: a systematic review and meta-analysis of 34 observational studies comprising 27 186 patients with 133 141 patient-years. Eur Heart J. 2012;33:1518–1529. doi: 10.1093/eurheartj/ehs003. [DOI] [PubMed] [Google Scholar]
- 32.Chen J, Lin Y, Kang B, Wang Z. Indexed effective orifice area is a significant predictor of higher mid- and long-term mortality rates following aortic valve replacement in patients with prosthesis-patient mismatch. Eur J Cardiothorac Surg. 2014;45:234–240. doi: 10.1093/ejcts/ezt245. [DOI] [PubMed] [Google Scholar]
- 33.Dayan V, Vignolo G, Soca G, Paganini JJ, Brusich D, Pibarot P. Predictors and outcomes of prosthesis-patient mismatch after aortic valve replacement. JACC Cardiovasc Imaging. 2016;9:924–933. doi: 10.1016/j.jcmg.2015.10.026. [DOI] [PubMed] [Google Scholar]
- 34.Joshi SS, Ashwini T, George A, Jagadeesh AM. Patient prosthesis mismatch after aortic valve replacement: an Indian perspective. Ann Card Anaesth. 2016;19:84–88. doi: 10.4103/0971-9784.173025. [DOI] [PMC free article] [PubMed] [Google Scholar]
- 35.Singh A, Sinha VK, Khandekar J, Agrawal N, Patwardhan A, Khandeparkar J. Left ventricular mass regression following aortic valve replacement with mechanical valves. Indian J Thorac Cardiovasc Surg. 2006;22:121–125. doi: 10.1007/s12055-006-0019-9. [DOI] [Google Scholar]
- 36.Dare AJ, Veinot JP, Edwards WD, Tazelaar HD, Schaff HV. New observations on the etiology of aortic valve disease: a surgical pathologic study of 236 cases from 1990. Hum Pathol. 1993;24:1330–1338. doi: 10.1016/0046-8177(93)90267-K. [DOI] [PubMed] [Google Scholar]