Abstract
Background
The non-classical human leukocyte antigen (HLA)-G is a strong immunomodulatory molecule. Under physiological conditions, HLA-G induces immunological tolerance in immune privileged tissues, while under pathophysiological situations it contributes to immune escape mechanisms. Therefore, HLA-G could act as a potential immune checkpoint for future anti-cancer immunotherapies. Recent data suggest an aberrant expression of the cAMP response element binding protein (CREB) in clear cell renal cell carcinoma (ccRCC), which is correlated with tumor grade and stage. Furthermore, preliminary reports demonstrated a connection of CREB as a control variable of HLA-G transcription due to CREB binding sites in the HLA-G promoter region. This study investigates the interaction between CREB and HLA-G in different renal cell carcinoma (RCC) subtypes and its correlation to clinical parameters.
Methods
The direct interaction of CREB with the HLA-G promoter was investigated by chromatin immunoprecipitation in RCC cell systems. Furthermore, the expression of CREB and HLA-G was determined by immunohistochemistry using a tissue microarray (TMA) consisting of 453 RCC samples of distinct subtypes. Staining results were assessed for correlations to clinical parameters as well as to the composition of the immune cell infiltrate.
Results
There exists a distinct expression pattern of HLA-G and CREB in the three main RCC subtypes. HLA-G and CREB expression were the lowest in chromophobe RCC lesions. However, the clinical relevance of CREB and HLA-G expression differed. Unlike HLA-G, high levels of CREB expression were positively associated to the overall survival of RCC patients. A slightly, but significantly elevated number of tumor infiltrating regulatory T cells was observed in tumors of high CREB expression. Whether this small increase is of clinical relevance has to be further investigated.
Conclusions
An interaction of CREB with the HLA-G promoter could be validated in RCC cell lines. Thus, for the first time the expression of CREB and its interaction with the HLA-G in human RCCs has been shown, which might be of clinical relevance.
Keywords: CREB, HLA-G, Renal cell carcinoma, Immune cell infiltration
Background
Renal cell carcinoma (RCC) is the most common form of kidney cancer. It arises from the renal tubular epithelial cells and can be further histologically subclassified into clear cell RCC (ccRCC), papillary RCC (pRCC), chromophobe RCC (chRCC) and several rare subtypes [1–3]. Interestingly, the incidence of RCC varies worldwide with the highest occurrence in North America and the Czech Republic [4]. RCC risk factors include obesity, smoking, diabetes mellitus and hypertension, among others [5]. Unfortunately, around 25–30% of RCC patients are diagnosed at a locally advanced or even at a metastatic stage, which negatively contributes to further therapy options and success. Recent studies demonstrate a decreasing RCC mortality between 1992 and 2015 in the USA. This might be attributed to improved diagnostics, like advanced abdominal imaging and/or to changes in the prevalence of RCC risk factors [6], as well as a grown range of therapeutic options. Treatment of RCCs is multidisciplinary. Besides surgical resection and radiotherapy, numerous medical treatments for metastatic disease have been approved in the last years including VEGF and VEGF-R inhibitors, [7, 8] mTOR inhibitors as well as with immune checkpoint inhibitors (ICI) [9]. Furthermore, first approaches with adoptive cell therapy (ACT) for RCC patients are under investigation, but despite the advances seen in melanoma, the reproducible generation of RCC tumor infiltrating lymphocytes (TILs) has been challenging [9].
Interestingly, the response rate to immunotherapies strongly vary between RCC patients, suggesting that the local composition of the tumor microenvironment and an altered expression of immune modulatory molecules might be crucial factors. The latter include the expression of PD-L1 and of the non-classical human leukocyte antigens (HLA) class Ib HLA-G and HLA-E as well as the down regulation of the classical HLA class Ia molecules mediated by an impaired expression of antigen processing machinery (APM) components [10–13]. Furthermore, cytokines secreted by Th1, Th2 and Th17 cells can also promote the progression of RCC [14]. Recent studies identified several microRNAs (miRs) regulating CREB in RCCs including miR-22-3p, miR-26a-5p, miR-27a-3p, and miR-221-3p [15].
Due to alternative splicing, HLA-G exists as membrane bound and soluble protein isoforms [16]. Both isoforms contribute to the composition and immune modulatory functions of the local tumor microenvironment [12]. Under physiologic conditions, its expression is restricted to mainly immune-privileged tissues including the cornea, testis, and the chorion. In contrast, a pathological HLA-G expression was found in many solid and hematopoietic tumors with an inter-tumor and intratumoral heterogeneity [17]. Furthermore, high HLA-G expression levels were associated with immune tolerance and inhibition of anti-tumoral immune responses [18, 19]. This was mediated by binding of HLA-G to inhibitory lymphocyte receptors, the immunoglobulin-like transcript (ILT)2, ILT4 and to the killer immunoglobulin-like receptor KIR2DL4 present on NK cells and CTLs [20].
The frequency of HLA-G expression in RCC lesions has been extensively investigated. Using a tissue microarray (TMA) consisting of 453 RCC lesions and matched normal kidney epithelium, a membranous HLA-G expression was found in 49.9% and a cytoplasmic HLA-G expression in 38.1% of cases, but the staining intensity strongly varied. Furthermore, the HLA-G expression was associated with the tumor grade: WHO grade 3 tumors often exhibited a stronger HLA-G staining than lower grade tumors. While the NK cell and CD4+ T cell infiltration did not vary, a significant difference in CD3+ and CD8+ cytotoxic T cells between HLA-G+ and HLA-G− RCC lesions was observed [21].
HLA-G expression could be regulated by transcriptional, epigenetic as well as post-transcriptional mechanisms [22]. In addition, an alternative pathway of HLA-G gene transactivation mediated by the cAMP-response element-binding protein (CREB) has been reported in the literature [23]. This transactivation by CREB is unusual and differs from gene activation of the classical HLA genes mediated by NF-κB, IRF1 and the class II transactivator (CIITA).
CREB is a 43 kDa transcription factor, which binds after phosphorylation to the cAMP responsive element (CRE), a sequence that is localized in several gene promoters. Indeed, CREB functions are implicated amongst others in the regulation of cell proliferation, apoptosis, cycle progression and metastasis [24]. Indeed, CREB knock down in RCC cell lines suppressed RCC proliferation and decreased their tumor formation in nude mice [25]. In RCC lesions and in RCC cell lines, an increased CREB expression could be demonstrated [26], which was associated with a better RCC patients’ survival [15]. RCC is highly promoted by the composition of the tumor microenvironment (TME). Mutations of the von Hippel-Lindau (VHL) gene are common in ccRCC.
In this study, the role of the transcriptional transactivator CREB on the gene expression of the RCC-relevant immune inhibitory molecule HLA-G was investigated at the molecular level in RCC cell lines and in a large cohort of RCC lesions by immunohistochemistry (IHC). CREB, HLA-G and HLA-E staining results were tested for associations to clinical parameters. In addition, tumor immune cell infiltrate composition was investigated for different levels of CREB expression.
Methods
Cell lines and cell culture
The HLA-G positive choriocarcinoma cell line JEG-3 was purchased from the American Type Culture Collection (ATCC, Manassas, USA) and a set of five established RCC cell lines derived from patients with RCC (MZ1257RC, MZ2861RC, MZ2862RC, MZ2733RC and MZ2905RC) have been applied. With the exception of JEG-3 cells, which were maintained in RPMI 1640 (Invitrogen), the cell lines were cultured in Dulbecco’s modified Eagles medium (DMEM, Invitrogen) supplemented with 10% (V/V) fetal bovine serum (FCS; PAA), 2 mM L-glutamine (Lonza) and 1% penicillin/streptomycin (V/V; PAA).
Tissue microarray and immunohistochemistry
Details of tissue micro array (TMA) construction and composition were published previously [21]. In short, the TMA consisted of samples from 453 formalin-fixed, paraffin-embedded RCC tissues which had been reevaluated by two experienced pathologists with respect to RCC subtype and WHO grade as defined by the 2004 World Health Organization (WHO) classification (NLM ID:101240923). After pathological review, a representative area per tumor had been transferred to recipient paraffin blocks, each capable of holding up to sixty tissue punches.
Five µm sections from the resulting eight TMA blocks were stained by conventional immunohistochemistry. The expression of HLA-G, HLA-E, CREB and immune cell marker expression have already been studied earlier on this TMA [15, 21, 27] and details of the staining procedures have been already been published. The authors reused these data to study the correlations to CREB expression.
Staining was evaluated by an experienced uropathologist (AH) and categorized for HLA-G, HLA-E and CREB by staining intensity: 0 (negative), 1 (weak), 2 (moderate), 3 (strong) [27]. For immune cells, four high-power fields (i.e. × 400) were evaluated for the mean absolute number of CD3+, CD4+, CD8+, and FoxP3+ cells [21].
From 2008 all patients gave informed consent, while obtained the Ethic Commission in Erlangen waived the need for informed individual consent for samples before 2008. The study is based on the approvals of the Ethic Commissions of the University Hospital Erlangen (No. 3755) and was conducted according to the principles expressed in the Declaration of Helsinki.
Chromatin immunoprecipitation (ChIP)
ChIP assays were performed using a kit (Pierce™ Agarose ChIP Kit) from ThermoFisher (Waltham, USA) according to the manufacturer's instructions. Briefly, 2 × 10⁶ cells/assay were cross-linked in a 1% formaldehyde solution for 10 min at room temperature and the reaction was terminated by glycine (final concentration: 125 mM). Nuclei of cross-linked cells were isolated and DNA fragmentation was achieved by Micrococcal Nuclease digest. Antibodies against CREB1 (48H2, CST) and IgG (ThermoFisher) as isotype control were employed for immunoprecipitation overnight at 4 °C. ChIP samples were washed, eluted and DNA was UV-cross linked with NaCl and treated with proteinase K. Purification of the DNA was achieved by a column-based approach. Isolated DNA was subjected to (qRT-) PCR analysis.
Quantitative PCR
To calculate the percent of input results ChIP samples, DNA was analyzed by qRT-PCR using GoTaq® qPCR Master Mix (Promega). Obtained Ct values for ChIP samples were normalized to input levels. For all primer pairs, an annealing temperature of 61 °C was used. Oligo-nucleotides (sequence 5‘ to 3‘) applied for amplification were HLA-G-Pro1_fw (AGGAGCAGGAGGTGAGGAAA), HLA-G-Pro1_rv (CAAAGAACACCCAGCGAAGC), HLA-G-Pro2_fw (AGTGAGGGGCATTGTGACTG), HLA-G-Pro2_rv (TATGTTGCAACCAGGAGCCA), RRM2_Pro_fw (GGGTCTCACTATGTTGCCC), RRM2_Pro_rv (CCCAGCACTTTGGGAGGCC).
Western blotting
Total protein was extracted from different cell lines using RIPA buffer (25 mM Tris–HCl pH 7.6, 150 mM NaCl, 1% NP-40, 1% sodium deoxycholate, 0.1% SDS + protease inhibitor cocktail) and protein concentration was determined employing the Pierce™ BCA Protein Assay Kit (ThermoFisher). For Western blot analysis, 25 µg of protein / sample was separated by SDS-PAGE and transferred onto a nitrocellulose membrane by semidry blot. For detection of proteins, the anti-HLA-G antibody MEM-G/9 (Novus Biologicals), the anti-CREB1 antibody 48H2 (CST) and the anti-β-actin mAb ab8227 (Abcam) were used, while a horseradish peroxidase conjugated goat anti-α-mouse/rabbit antibody (CST) was employed as a secondary antibody. Chemiluminescent blots were imaged by LAS-3000 Imaging System (Fuji).
Statistical analyses
Statistical tests on immunohistochemical results were performed using IBM SPSS Statistics 21 and 24 (IBM Corporation). Two-sided exact Chi-square test (Pearson’s or Fisher’s two sided exact tests, as appropriate) or Kruskal Wallis test were applied to test for correlations between tumor characteristics and tumor marker expression, or immune cell infiltrate characteristics and tumor marker expression, respectively. Associations of staining intensity and overall survival were calculated by log rank test. Differences were regarded significant at p < 0.05.
Results
In vitro experiments demonstrated a CREB-mediated induction of HLA-G transcription in extravillous cytotrophoblasts [23]. Previous studies analyzed the HLA-G and the HLA-E expression as well as the tumor infiltrating immune cell composition in a large cohort of RCC lesions using a TMA [20, 21, 27]. In the current study, the impact of the transcriptional activator CREB on the HLA-G expression was investigated in the RCC specimens. As recently shown, immunohistochemical staining of the RCC TMA with a pan-CREB mAb demonstrated a highly variable CREB expression in the RCC lesions ranging from negative, weak, medium to high expression [15] (Fig. 1).
Fig. 1.
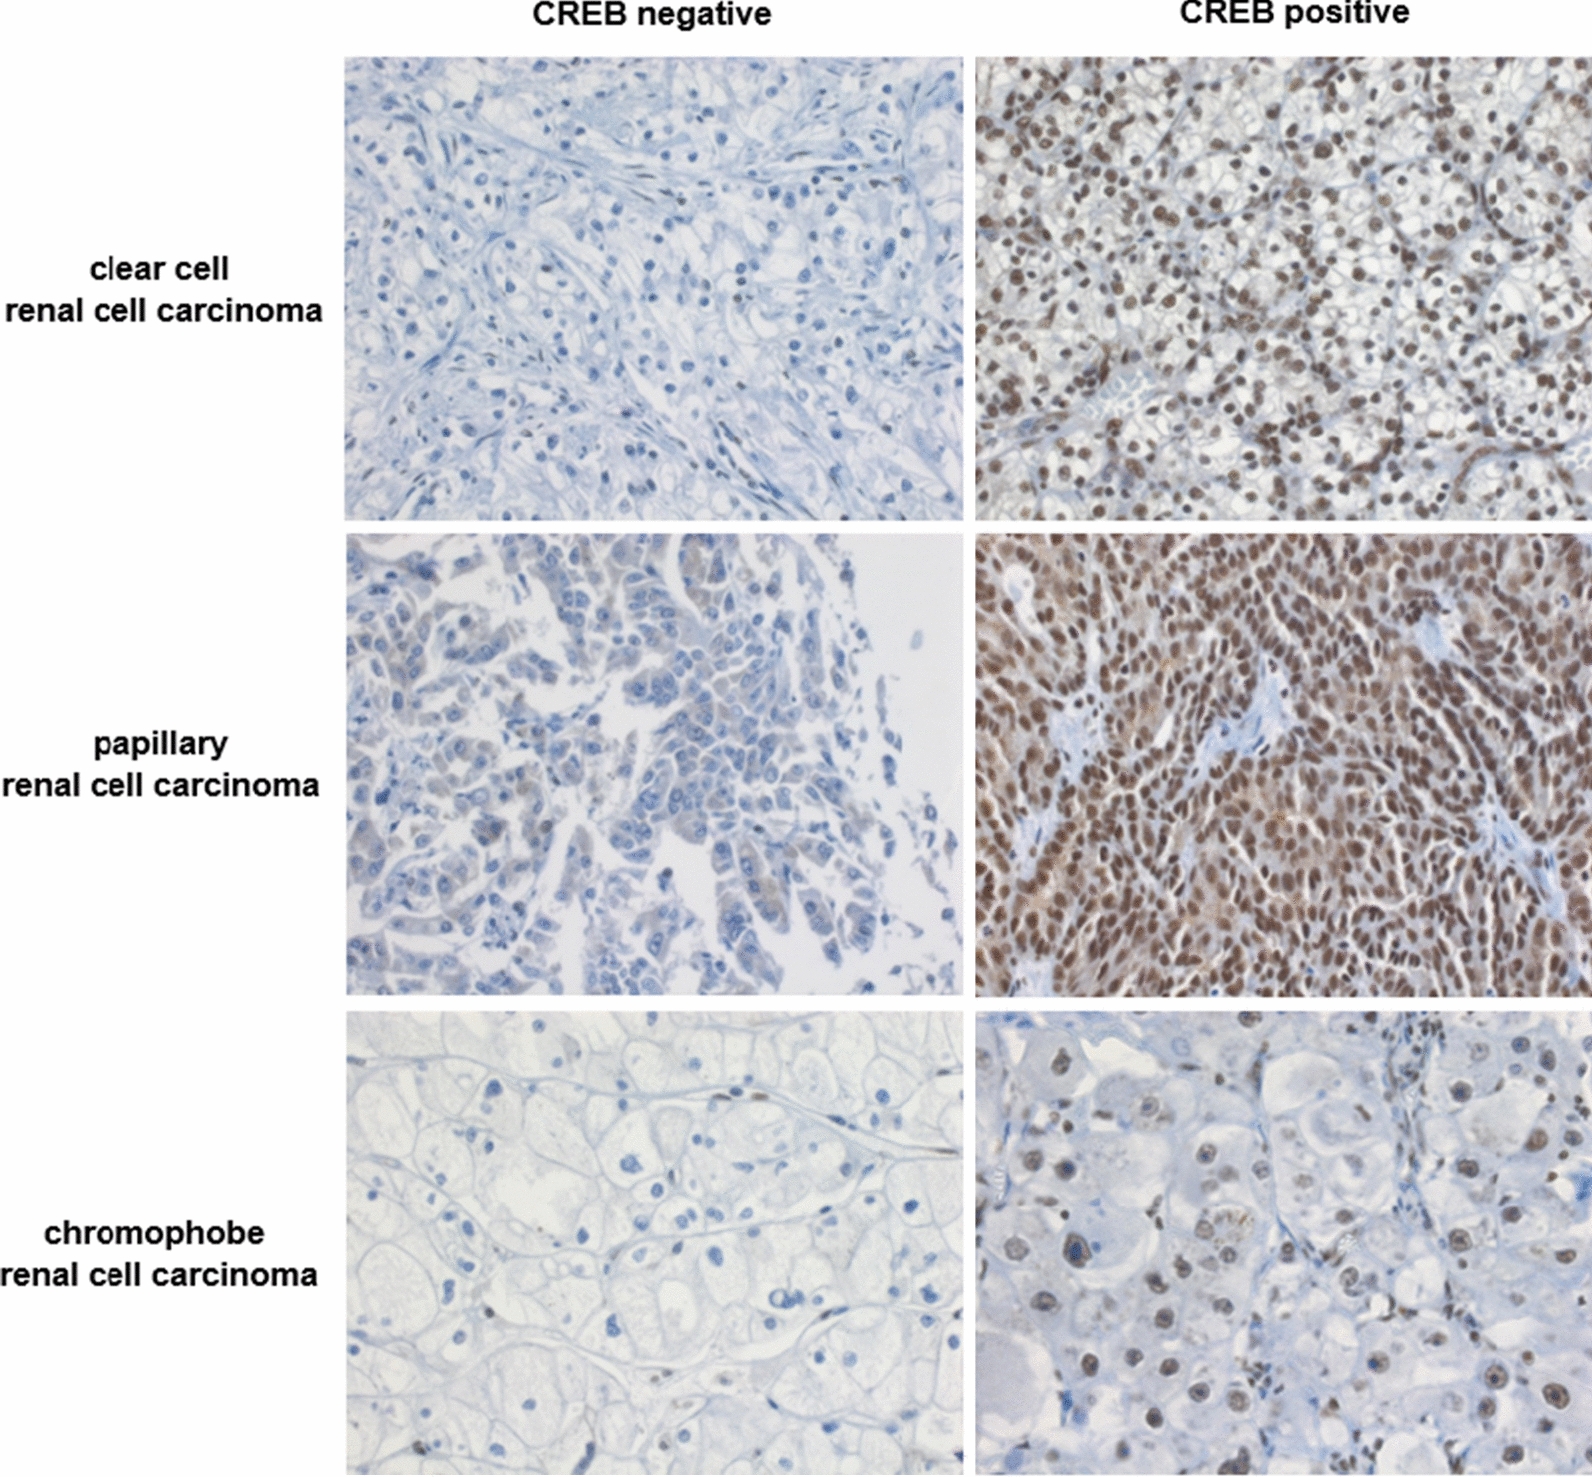
Representative CREB negative and positive specimen of the three most frequent RCC subtypes by immunohistochemistry (400-fold magnification)
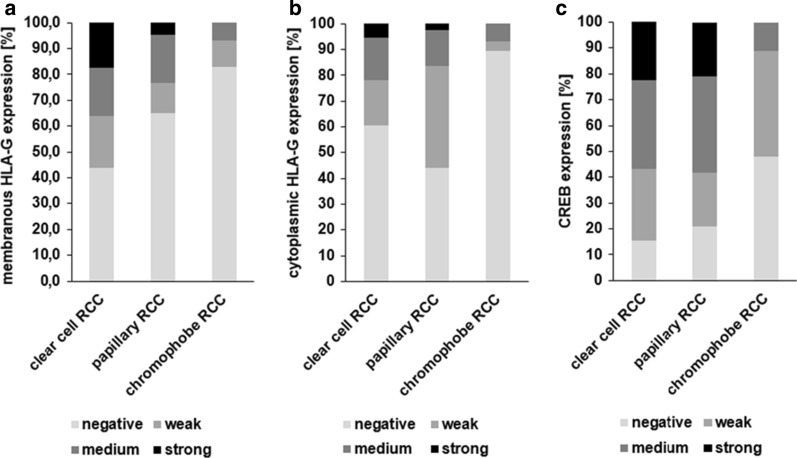
The three major RCC subtypes ccRCC, pRCC, and chRCC, were separately analyzed for HLA-G and CREB expression by evaluating staining intensity distribution. The different RCC subtypes exhibit significantly distinct HLA-G and CREB expression (Fig. 2, p = 0.001 (membranous HLA-G), p = 0.002 (cytoplasmic HLAG), p < 0.001 (CREB)). The frequency of HLA-G expression was highest in ccRCCs (55.9% for membranous and 39.7% for cytoplasmic HLA-G) and pRCCs (39.8% for membranous and 58.7% for cytoplasmic HLA-G) when compared to chRCCs (16.2% for membranous and 10.3% for cytoplasmic HLA-G). Furthermore, the frequency of CREB expression was comparable to that of HLA-G expression. Medium and high CREB expressing tumors were more frequently found in ccRCCs (57.0%) and pRCCs (58.1) and rare in chRCC (11.1%).
Fig. 2.
HLA-G and CREB expression levels in different RCC subtypes. The distribution of membranous HLA-G (A), cytoplasmic HLAG (B) and CREB (C) staining intensity varied significantly among clear cell (n = 333 and n = 314, respectively), papillary (n = 46 and n = 43, respectively) and chromophobe RCC (n = 29 and n = 27, respectively). p = 0.001 (membranous HLAG), p = 0.,002 (cytoplasmic HLAG), p < 0.001 (CREB))
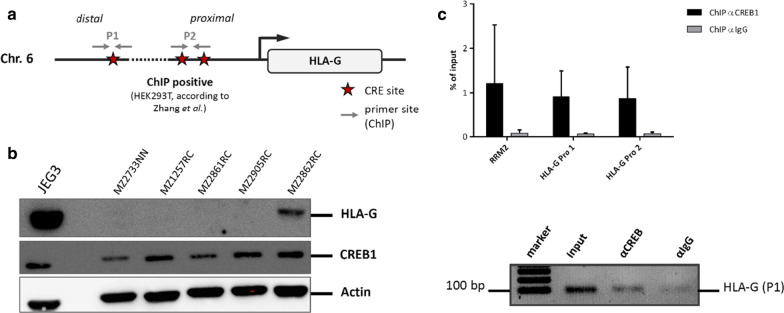
Since a coordinated HLA-G and CREB expression was suggested by immunohistochemical staining, the molecular mechanisms were analyzed. In silico analyses revealed CREB-binding sites within the HLA-G promoter (Fig. 3a).To investigate whether the reported direct interaction of CREB with the HLA-G promoter sequence in extravillous cytotrophoblasts is also functional in the RCC cell system, ChIP was performed applying lysates from the RCC cell line MZ2862RC expressing both CREB and HLA-G (Fig. 3b). ChIP of the HLA-G promoter sequences including the CREB-binding sites using the anti-CREB antibody revealed a strong enrichment, which was almost as equal to the already known CREB regulated RRM2 promoter, which was used as positive control. This is shown by an exemplary agarose gel demonstrating an enrichment of the HLA-G promoter region with the anti-CREB mAb when compared to the respective isotype control (Fig. 3c). These results suggest that CREB is affecting the expression of HLA-G by binding to its promoter.
Fig. 3.
Analysis of the interaction of CREB with HLA-G. a In silico analysis of the HLA-G promoter sequence for predicted CREB binding sites. b The protein levels of HLA-G and of CREB were analyzed in RCC cell lines by Western blot. JEG-3 cells served as positive control. c The bar diagram shows the qPCR data expressed as means of three biological replicates of the chromatin immunoprecipitation. In comparison to the unspecific IgG control, the usage of anti-CREB antibody enriched HLA-G promoter regions as well as the internal positive control of the known CREB-bound RRM2 promoter sequence. The lower agarose gel exemplarily shows the enrichment of one HLA-G promoter fragment with the anti-CREB pull down in comparison to the isotype control of the antibody
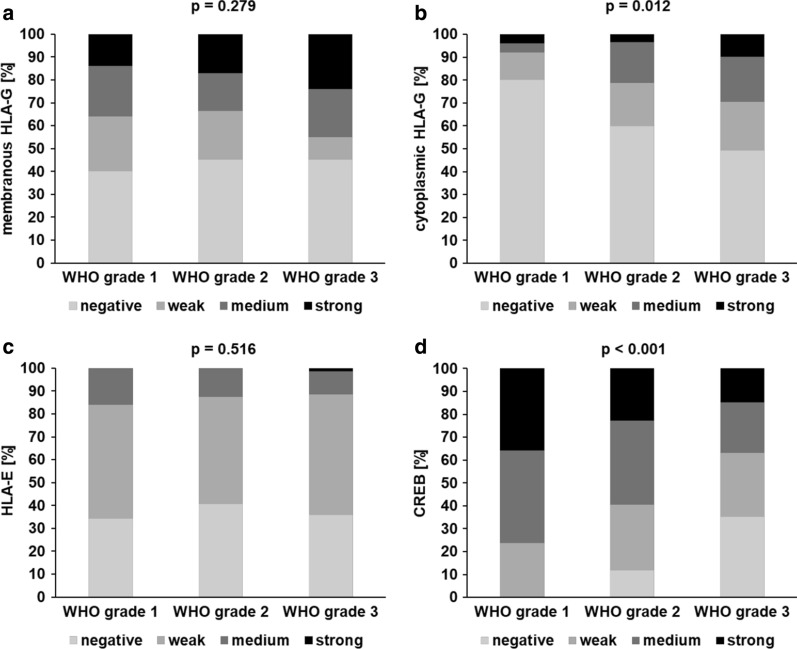
To further address whether the coordinated expression of HLA-G, HLA-E and CREB has clinical relevance, their expression levels (staining intensity) were correlated to tumor grade. Analysis of HLA-E, which has no CREB-binding site in its promoter, served as control. Despite the heterogeneous expression in the different RCC subtypes only limited information about the tumor grade of the lesser frequent pRCC and missing validated scoring procedures for chRCC, the analyses were focused on ccRCC specimen (Fig. 4). While there was no statistically significant difference regarding HLA-E expression (p = 0.569) and membranous HLA-G expression (p = 0.279) among all tumor grades, cytoplasmic HLA-G expression was statistically significant associated with a higher tumor grade (p = 0.012). In contrast, CREB expression was statistically significant inversely correlated to tumor grade (p < 0.001): A lower CREB expression in ccRCCs was associated with a higher tumor grade as summarized in Table 1 suggesting that the HLA-G and CREB expression has independent effects on tumor grading.
Fig. 4.
Correlation of HLA-G, HLA-E and CREB expression with grading of ccRCC. In ccRCC, staining intensity distribution among tumor grade categories varied for cytoplasmic HLA-G (B) and was inversely correlated for CREB (D), while there were no statistically significant differences for membranous HLA-G (A) or HLA-E (C)
Table 1.
Expression (i. e. staining intensity) of CREB and HLA-G in ccRCC with respect to primary tumor WHO grade
| ccRCC | WHO grade 1 n (%) | WHO grade 2 n (%) |
WHO grade 3 n (%) |
|---|---|---|---|
| CREB | |||
| Negative (0) | 0 (0.0) | 24 (50.0) | 24 (50.0) |
| Weak (1) | 10 (11.5) | 58 (66.7) | 19 (21.8) |
| Moderate (2) | 17 (15.9) | 75 (70.1) | 15 (14.0) |
| Strong (3) | 15 (21.1) | 46 (64.8) | 10 (14.1) |
| Cytoplasmic HLA-G | |||
| Negative (0) | 40 (19.9) | 126 (62.7) | 35 (17.4) |
| Weak (1) | 6 (9.8) | 40 (65.6) | 15 (24.6) |
| Moderate (2) | 2 (3.7) | 38 (70.4) | 14 (25.9) |
| Strong (3) | 2 (12.5) | 7 (43.8) | 7 (43.8) |
| Membranous HLA-G | |||
| Negative (0) | 20 (13.6) | 95 (64.6) | 32 (21.8) |
| Weak (1) | 12 (18.8) | 45 (70.3) | 7 (10.9) |
| Moderate (2) | 11 (18.0) | 35 (57.4) | 15 (24.6)) |
| Strong (3) | 7 (11.7) | 36 (60.0) | 17 (28.3) |
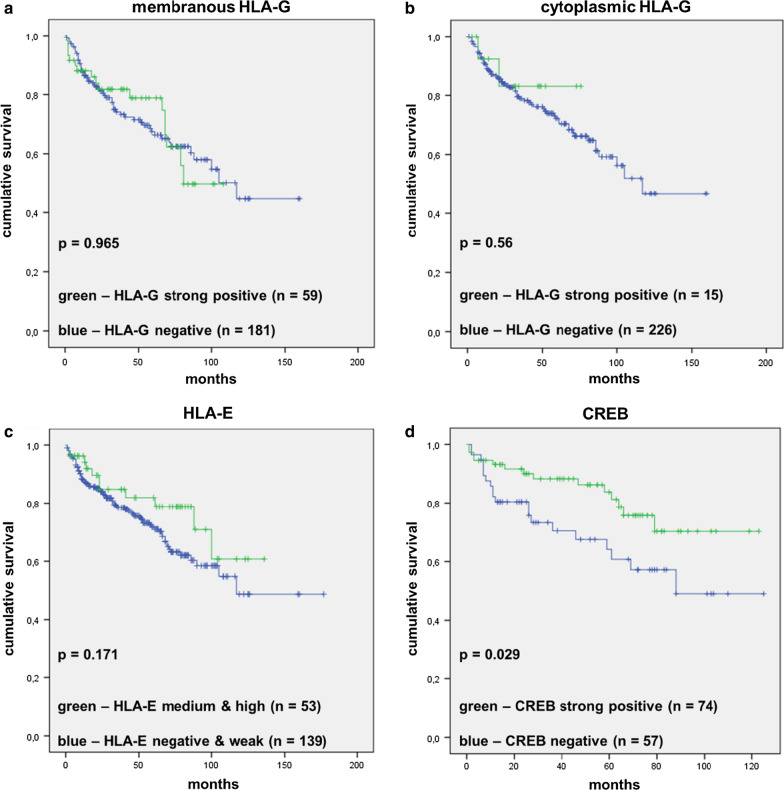
To analyze an association of HLA-G, HLA-E and CREB staining intensity on the overall survival of RCC patients, the respective non-expressing tumor specimen were compared to the strong positive specimens for HLA-G and CREB, respectively, and weak and moderate/strong specimens for HLA-E followed by the generation of Kaplan–Meier plots (Fig. 5). There was a statistically significant (p = 0.029) correlation of high levels of CREB expression with increased overall survival, while the survival of RCC patients did not statistically significant differ with the HLA-G expression (membranous or cytoplasmic) or HLA-E expression (p = 0.965, p = 0.56 and p = 0.216, respectively).
Fig. 5.
Correlation of HLA-G, HLA-E and CREB staining with ccRCC patients’ overall survival. HLA-G (A, B), HLA-E (C), and CREB (D) staining intensity was correlated with OS survival in RCC demstrating that only CREB expression was significantly (p = 0.029) associated to patients’ OS. Note: No survival data were available for HLA-E negative cases and only few data on strong cases. Therefore, for this marker, the staining categories “negative/weak” and “medium/strong” were compared
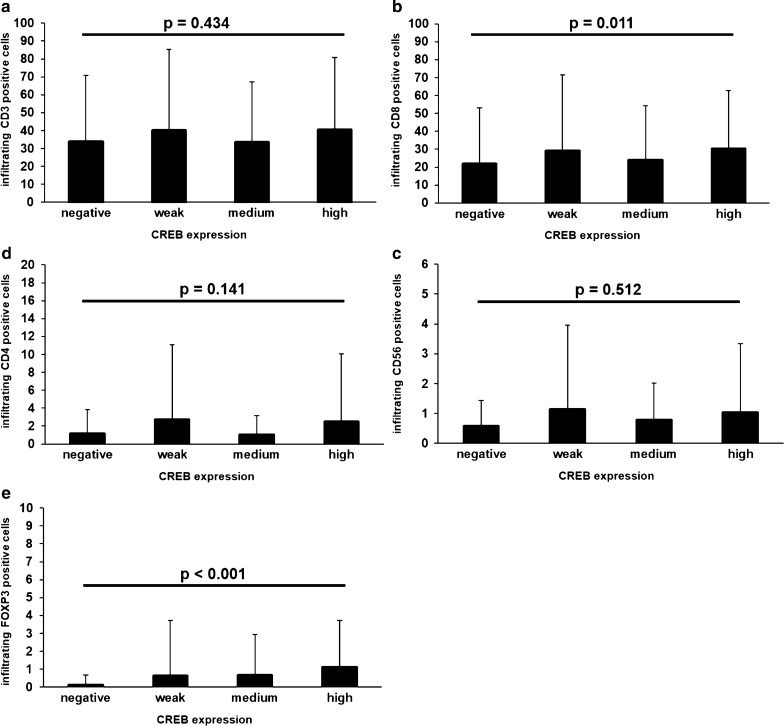
To address the question whether the CREB expression in RCCs is linked to alterations of the tumor infiltrating immune cell composition, the tumor infiltrating lymphocytes were analyzed and correlated to the CREB expression levels (staining intensity) of the RCC tumors (Fig. 6). There was no difference in the presence of the CD3 (p = 0.434) positive cells, which were predominantly CD8 positive CTL (p = 0.011) and to a lesser extent CD4 positive T helper cells (p = 0.141) in CREBhigh or CREBlow RCC (Fig. 6). In addition, the frequency of CD56 positive cells (p = 0.512), including NK cells and NKT cells, was not associated to CREB expression levels. In contrast, the Treg frequency was statistically significant associated in the CREB expression (p < 0.0001): The higher the CREB expression of the tumor, the higher the amount of tumor infiltrating Tregs, although the mean absolute number of Tregs per high power field is rather low: non-CREB expressing tumors displayed 0.10 FoxP3+ immune cells per high power field in mean (median 0.00, std. deviation 0.56, minimum 0.00, maximum 4.25), while G3 tumors showed 1.10 FoxP3+ cells per high power field in mean (median 0.00, std. deviation 2.61, minimum 0.00, maximum 14.25).
Fig. 6.
Analysis of the immune cell composition of the analyzed RCCs. Observed presence of different intra-tumoral immune cells among different categories of tumoral CREB expression (staining intensity). While the mean absolute numbers of four high power fields did not significantly vary for CD3+ (a), CD4+ (c) and CD56+ immune cells (p = 0.3, p = 0.11, p = 0.17, p = 0.12), the presence of FOXP3+ cell increased significantly with higher CREB expression (p = 0.0018), although the absolute cell number remains very low. CD8+ (b) expression also significantly vary (p = 0.011), but is hard to interprete when looking at the distribution of positive cells over the CREB staining categories
Discussion
The validation of reported in vitro studies regarding clinical relevant molecules in in situ and/or in in vivo systems is of great importance. The pathophysiologic HLA-G expression in solid und hematopoietic diseases is an important immune evasion strategy of tumors and linked to a certain composition of the TIL [21]. Therefore, the reported in vitro results of the suggested CREB-HLA-G interaction are for the first time analyzed in a clinical data set of human RCC specimen.
In the RCC specimen analyzed, the expression of HLA-G and HLA-E demonstrated no statistically significant association to overall survival of RCC patients. In contrast, the expression of the transcriptional activator CREB statistically significant correlated to the overall survival of RCC patients when comparing strong CREB positive to CREB negative tumors. This primarily contradictory finding might be explained by the pleiotropic functions of CREB or additional mechanisms involved in the regulation of the target gene or in patients’ survival.
The CREB expression of RCC tumors is also accompanied by an altered composition of TIL. Only the amount of FoxP3+ cells was statistically significant enhanced in CREB positive cells in comparison to CREB negative cells. FoxP3 expression is limited to Tregs [29] and known to suppress anti-tumoral immune responses. Although the total amount of infiltrating FoxP3+ Tregs was very low in the RCC samples examined, the number of TIL was associated to CREB expression levels with a concordant increase in CREB and HLA-G expression levels. This effect appears to be CREB-specific, since previous HLA-G expression studies in the same TMA did not reveal any HLA-G-dependent effect on FoxP3+ cells, but a strong statistically significant effect on CD3+ and CD8+ TIL [21].
Interestingly, Kim and co-authors identified CREB as a direct transcriptional activator of the FoxP3 gene expression in murine Tregs. This interaction of CREB with the respective sequence motif within the FoxP3 promoter region was furthermore dependent on its methylation status. Indeed, methylated DNA at the CREB binding site within the FoxP3 promoter prevented in vivo CREB binding [28]. These authors identified a TGACGTCA putative CREB site within the first intron of the FoxP3 gene, which was confirmed by the direct interaction and transcriptional activation of CREB at this site. Tregs are a subpopulation of CD4+ T cells and FoxP3 regulates their development in the thymus and maintenance in the periphery [29]. The number of tumor infiltrating Tregs within the strong CREB+ RCC tumors did not negatively contribute to the association of CREB expression with an increased overall survival and lower tumor grade.
In this study, the in vitro interaction of CREB and HLA-G in RCC cell lines was proven. This leads to the hypothesis whether CREB specific inhibitors like 666-15, which exerts an anti-cancer activity in mouse experiments both in vitro and in vivo [26], might be employed also for the RCC therapy. However, the weak in vivo effects of CREB on HLA-G expression as concluded from our data question any possible anti-cancer effects by CREB inhibition as a consequence of a down-regulated HLA-G transcription.
Conclusions
The interaction of CREB and HLA-G was investigated in clinical human specimen and in different subtypes of RCC. In this study, both markers HLA-G and CREB showed an equal distributed expression independently of the RCC subtype. CREB expression in RCCs was inversely correlated to tumor grade, but positively correlated to overall survival and to the amount of tumor infiltrating Tregs. However, HLA-G expression exerts opposing functions and is linked to higher tumor grade. Therefore, further studies should investigate under which cellular conditions CREB physiologically induces HLA-G transcription and in which tissues and with which involvement of other regulatory mechanisms.
Acknowledgements
We want to thank Nicole Ott for excellent secretarial help and Rudolf Jung for excellent technical assistance.
Abbreviations
- ACT
Adoptive cell therapy
- APM
Antigen processing machinery
- ccRCC
Clear cell renal cell carcinoma
- CD
Cluster of differentiation
- ChIP
Chromatin immunoprecipitation
- chRCC
Chromophobe renal cell carcinoma
- CIITA
Class II transactivator protein
- CTL
Cytotoxic T lymphocyte
- CREB
CAMP-response element-binding protein
- HLA
Human leukocyte antigen
- ICI
Immune checkpoint inhibitors
- ILT
Immunoglobulin-like transcript
- mAb
Monoclonal antibody
- miR
MicroRNA
- NK
Natural killer cell
- n.s.
Not significant
- pRCC
Papillary renal cell carcinoma
- TIL
Tumor infiltrating lymphocyte
- TMA
Tissue microarray
- TME
Tumor microenvironment
- Treg
Regulatory T cell
- VHL
Von Hippel Lindau
Authors’ contributions
The study was designed by BS and AH. All in vitro experiments were performed by MF, CS, and SJB. The tissue samples and clinical data were collected, processed and analyzed by AH, BW, SW, CS. The manuscript was written by SJB, BS, MF, CS and AS and approved by all authors. All authors read and approved the final manuscript.
Funding
Open Access funding enabled and organized by Projekt DEAL. This study was funded by the German Research Foundation (DFG; SE 581/22-1), Dr. Werner Jackstädt Foundation, and by a grant from the German-Israeli Foundation (GIF; I-37-414.11-2016).
Availability of data and materials
The data and materials are available upon request.
Ethics approval and consent to participate
From 2008 all patients gave informed consent, while for samples before 2008, the Ethic Commission in Erlangen waived the need for informed individual consent. The study is based on the approvals of the Ethic Commissions of the University Hospital Erlangen (No. 3755) and was conducted according to the principles expressed in the Declaration of Helsinki.
Consent of publication
All authors approved the final version of this paper.
Competing interests
The authors declare that they have no competing interests.
Footnotes
Publisher's Note
Springer Nature remains neutral with regard to jurisdictional claims in published maps and institutional affiliations.
Michael Friedrich, Christine Stoehr and Simon Jasinski-Bergner contributed equally.
References
- 1.Nabi S, Kessler ER, Bernard B, Flaig TW, Lam ET. Renal cell carcinoma: a review of biology and pathophysiology. F1000Res. 2018;7:307. doi: 10.12688/f1000research.13179.1. [DOI] [PMC free article] [PubMed] [Google Scholar]
- 2.Moch H, Cubilla AL, Humphrey PA, Reuter VE, Ulbright TM. The 2016 WHO classification of tumours of the urinary system and male genital organs-part A: renal, penile, and testicular tumours. Eur Urol. 2016;70:93–105. doi: 10.1016/j.eururo.2016.02.029. [DOI] [PubMed] [Google Scholar]
- 3.Hsieh JJ, Purdue MP, Signoretti S, Swanton C, Albiges L, Schmidinger M, Heng DY, Larkin J, Ficarra V. Renal cell carcinoma. Nat Rev Dis Primers. 2017;3:17009. doi: 10.1038/nrdp.2017.9. [DOI] [PMC free article] [PubMed] [Google Scholar]
- 4.Chow WH, Dong LM, Devesa SS. Epidemiology and risk factors for kidney cancer. Nat Rev Urol. 2010;7:245–257. doi: 10.1038/nrurol.2010.46. [DOI] [PMC free article] [PubMed] [Google Scholar]
- 5.Kabaria R, Klaassen Z, Terris MK. Renal cell carcinoma: links and risks. Int J Nephrol Renovasc Dis. 2016;9:45–52. doi: 10.2147/IJNRD.S75916. [DOI] [PMC free article] [PubMed] [Google Scholar]
- 6.Saad AM, Gad MM, Al-Husseini MJ, Ruhban IA, Sonbol MB, Ho TH. Trends in renal-cell carcinoma incidence and mortality in the United States in the last 2 decades: a SEER-based study. Clin Genitourin Cancer. 2019;17:46–57. doi: 10.1016/j.clgc.2018.10.002. [DOI] [PMC free article] [PubMed] [Google Scholar]
- 7.Vachhani P, George S. VEGF inhibitors in renal cell carcinoma. Clin Adv Hematol Oncol. 2016;14(12):1016–1028. [PubMed] [Google Scholar]
- 8.Rassy E, Flippot R, Albiges L. Tyrosine kinase inhibitors and immunotherapy combinations in renal cell carcinoma. Ther Adv Med Oncol. 2020;12:1758835920907504. doi: 10.1177/1758835920907504. [DOI] [PMC free article] [PubMed] [Google Scholar]
- 9.Considine B, Hurwitz ME. Current status and future directions of immunotherapy in renal cell carcinoma. Curr Oncol Rep. 2019;21:34. doi: 10.1007/s11912-019-0779-1. [DOI] [PubMed] [Google Scholar]
- 10.Carosella ED, Ploussard G, LeMaoult J, Desgrandchamps F. A systematic review of immunotherapy in urologic cancer: evolving roles for targeting of CTLA-4, PD-1/PD-L1, and HLA-G. Eur Urol. 2015;68:267–279. doi: 10.1016/j.eururo.2015.02.032. [DOI] [PubMed] [Google Scholar]
- 11.Bukur J, Jasinski S, Seliger B. The role of classical and non-classical HLA class I antigens in human tumors. Semin Cancer Biol. 2012;22:350–358. doi: 10.1016/j.semcancer.2012.03.003. [DOI] [PubMed] [Google Scholar]
- 12.Friedrich M, Jasinski-Bergner S, Lazaridou MF, Subbarayan K, Massa C, Tretbar S, Mueller A, Handke D, Biehl K, Bukur J, et al. Tumor-induced escape mechanisms and their association with resistance to checkpoint inhibitor therapy. Cancer Immunol Immunother. 2019;68:1689–1700. doi: 10.1007/s00262-019-02373-1. [DOI] [PMC free article] [PubMed] [Google Scholar]
- 13.Morandi F, Pistoia V. Interactions between HLA-G and HLA-E in physiological and pathological conditions. Front Immunol. 2014;5:394. doi: 10.3389/fimmu.2014.00394. [DOI] [PMC free article] [PubMed] [Google Scholar]
- 14.Berlato C, Khan MN, Schioppa T, Thompson R, Maniati E, Montfort A, Jangani M, Canosa M, Kulbe H, Hagemann UB, et al. A CCR4 antagonist reverses the tumor-promoting microenvironment of renal cancer. J Clin Invest. 2017;127:801–813. doi: 10.1172/JCI82976. [DOI] [PMC free article] [PubMed] [Google Scholar]
- 15.Friedrich M, Heimer N, Stoehr C, Steven A, Wach S, Taubert H, Hartmann A, Seliger B. CREB1 is affected by the microRNAs miR-22-3p, miR-26a-5p, miR-27a-3p, and miR-221-3p and correlates with adverse clinicopathological features in renal cell carcinoma. Sci Rep. 2020;10:6499. doi: 10.1038/s41598-020-63403-y. [DOI] [PMC free article] [PubMed] [Google Scholar]
- 16.Bukur J, Rebmann V, Grosse-Wilde H, Luboldt H, Ruebben H, Drexler I, Sutter G, Huber C, Seliger B. Functional role of human leukocyte antigen-G up-regulation in renal cell carcinoma. Cancer Res. 2003;63:4107–4111. [PubMed] [Google Scholar]
- 17.Lin A, Yan WH. Heterogeneity of HLA-G expression in cancers: facing the challenges. Front Immunol. 2018;9:2164. doi: 10.3389/fimmu.2018.02164. [DOI] [PMC free article] [PubMed] [Google Scholar]
- 18.Carosella ED, Rouas-Freiss N, Tronik-Le Roux D, Moreau P, LeMaoult J. HLA-G: an immune checkpoint molecule. Adv Immunol. 2015;127:33–144. doi: 10.1016/bs.ai.2015.04.001. [DOI] [PubMed] [Google Scholar]
- 19.da Silva IL, Montero-Montero L, Ferreira E, Quintanilla M. New insights into the role of Qa-2 and HLA-G non-classical MHC-I complexes in malignancy. Front Immunol. 2018;9:2894. doi: 10.3389/fimmu.2018.02894. [DOI] [PMC free article] [PubMed] [Google Scholar]
- 20.Jasinski-Bergner S, Reches A, Stoehr C, Massa C, Gonschorek E, Huettelmaier S, Braun J, Wach S, Wullich B, Spath V, et al. Identification of novel microRNAs regulating HLA-G expression and investigating their clinical relevance in renal cell carcinoma. Oncotarget. 2016;7:26866–26878. doi: 10.18632/oncotarget.8567. [DOI] [PMC free article] [PubMed] [Google Scholar]
- 21.Jasinski-Bergner S, Stoehr C, Bukur J, Massa C, Braun J, Huttelmaier S, Spath V, Wartenberg R, Legal W, Taubert H, et al. Clinical relevance of miR-mediated HLA-G regulation and the associated immune cell infiltration in renal cell carcinoma. Oncoimmunology. 2015;4:e1008805. doi: 10.1080/2162402X.2015.1008805. [DOI] [PMC free article] [PubMed] [Google Scholar]
- 22.Dunker K, Schlaf G, Bukur J, Altermann WW, Handke D, Seliger B. Expression and regulation of non-classical HLA-G in renal cell carcinoma. Tissue Antigens. 2008;72:137–148. doi: 10.1111/j.1399-0039.2008.01090.x. [DOI] [PubMed] [Google Scholar]
- 23.Gobin SJ, Biesta P, de Steenwinkel JE, Datema G, van den Elsen PJ. HLA-G transactivation by cAMP-response element-binding protein (CREB). An alternative transactivation pathway to the conserved major histocompatibility complex (MHC) class I regulatory routes. J Biol Chem. 2002;277:39525–39531. doi: 10.1074/jbc.M112273200. [DOI] [PubMed] [Google Scholar]
- 24.Wang X, Cui H, Lou Z, Huang S, Ren Y, Wang P, Weng G. Cyclic AMP responsive element-binding protein induces metastatic renal cell carcinoma by mediating the expression of matrix metallopeptidase-2/9 and proteins associated with epithelial-mesenchymal transition. Mol Med Rep. 2017;15:4191–4198. doi: 10.3892/mmr.2017.6519. [DOI] [PubMed] [Google Scholar]
- 25.Zhuang H, Meng X, Li Y, Wang X, Huang S, Liu K, Hehir M, Fang R, Jiang L, Zhou JX, et al. Cyclic AMP responsive element-binding protein promotes renal cell carcinoma proliferation probably via the expression of spindle and kinetochore-associated protein 2. Oncotarget. 2016;7:16325–16337. doi: 10.18632/oncotarget.7017. [DOI] [PMC free article] [PubMed] [Google Scholar]
- 26.Li BX, Gardner R, Xue C, Qian DZ, Xie F, Thomas G, Kazmierczak SC, Habecker BA, Xiao X. Systemic inhibition of CREB is well-tolerated in vivo. Sci Rep. 2016;6:34513. doi: 10.1038/srep34513. [DOI] [PMC free article] [PubMed] [Google Scholar]
- 27.Seliger B, Jasinski-Bergner S, Quandt D, Stoehr C, Bukur J, Wach S, Legal W, Taubert H, Wullich B, Hartmann A. HLA-E expression and its clinical relevance in human renal cell carcinoma. Oncotarget. 2016;7:67360–67372. doi: 10.18632/oncotarget.11744. [DOI] [PMC free article] [PubMed] [Google Scholar]
- 28.Kim HP, Leonard WJ. CREB/ATF-dependent T cell receptor-induced FoxP3 gene expression: a role for DNA methylation. J Exp Med. 2007;204:1543–1551. doi: 10.1084/jem.20070109. [DOI] [PMC free article] [PubMed] [Google Scholar]
- 29.Fontenot JD, Gavin MA, Rudensky AY. FoxP3 programs the development and function of CD4+CD25+ regulatory T cells. Nat Immunol. 2003;4:330–336. doi: 10.1038/ni904. [DOI] [PubMed] [Google Scholar]
Associated Data
This section collects any data citations, data availability statements, or supplementary materials included in this article.
Data Availability Statement
The data and materials are available upon request.


