

Background:
Most clinical guidelines recommend measuring postoperative carcinoembryonic antigen (CEA) levels to predict the prognosis of colorectal cancer. However, type II diabetes can increase serum CEA levels which may bias the prognosis. Thus, we aimed to evaluate the impact of type II diabetes on CEA prognostic accuracy in colorectal cancer.
Methods:
This retrospective cohort study included 407 patients who underwent curative resection for stage I to III colorectal adenocarcinoma in a single institution between January 2010 and June 2018. The patients were categorized into two groups according to their postoperative serum CEA levels: group A <5.0 ng/mL (n = 341) and group B ≥5.0 ng/mL (n = 66). Patients were also categorized into two subgroups according to their history of type II diabetes: patients with type II diabetes mellitus (n = 112) and patients without type II diabetes (n = 295).
Results:
The 3-year disease-free survival (DFS) rates were significantly higher in patients with normal postoperative CEA (group A, 83.8%) than in patients with elevated preoperative and postoperative CEA (group B, 63.6%) (p < 0.001). However, although patients with type II diabetes mellitus had higher postoperative CEA levels than those without type II diabetes mellitus (3.1 vs 2.5 ng/mL, p < 0.001), group B patients with type II diabetes mellitus had a significantly higher 3-year DFS rate than those without type II diabetes mellitus (80.0% vs 55.6%, p = 0.003).
Conclusion:
Type II diabetes was associated with higher preoperative and postoperative CEA levels in patients with colorectal cancer. Consequently, elevated postoperative CEA level was not associated with shorter 3-year DFS in patients with type II diabetes, as opposed to patients without type II diabetes. Therefore, colorectal cancer patients with type II diabetes may need alternative tumor markers to be used during the surveillance strategy after curative surgery.
Keywords: Carcinoembryonic antigen, Colorectal neoplasms, Diabetes mellitus
1. INTRODUCTION
Serum carcinoembryonic antigen (CEA) is the most widely used tumor marker for patients with colorectal cancer. Most published guidelines, including those from the National Comprehensive Cancer Network and American Society of Oncologists, recommend postoperative CEA level testing every 3 to 6 months.1,2 Some studies reported that postoperative CEA levels serve as a better prognostic factor than preoperative CEA levels. In these studies, postoperative, but not preoperative, CEA status was shown as a significant prognostic predictor in multivariable analyses, with high postoperative CEA levels associated with poor prognosis.3–5 High preoperative CEA levels did not return to reference values after surgery in approximately one third of the patients with colorectal cancer. This may indicate the presence of a persistent disease, requiring further evaluation.4,6
Although CEA is a common tumor marker, its levels can be influenced by many factors, such as tobacco use, liver disease, and acute or chronic inflammation.7–10 In previous studies, CEA has also been reported to be positively associated with hyperglycemia in patients with diabetes,10–12 which can lead to inaccurate cancer diagnosis and prognosis. However, the impact of diabetes on the CEA levels has not been investigated in colorectal cancer patients. Thus, this study aimed to determine the effect of diabetes on the prognostic accuracy of CEA in patients with colorectal cancer patients.
2. METHODS
After obtaining approval from the Institutional Review Board of the National Yan-Ming University Hospital (NYMUH IRB No. 2020A001) and a waiver of the requirement for patient consent, prospectively maintained databases were queried for all consecutive patients.
2.1. Patients
In total, 611 patients with colorectal adenocarcinoma received curative treatment at the National Yang-Ming University Hospital between January 1, 2010 and June 30, 2018. We excluded 204 patients based on the following criteria: stage IV disease (n = 78), loss to follow-up (n = 27), diagnosis of carcinoma in situ (n = 33), and incomplete CEA data (n = 66). Thus, our study ultimately comprised 407 patients.
Patients were grouped according to their CEA status as follows: group A, reference (<5.0 ng/mL) postoperative CEA levels (n = 341) and group B, elevated (≥5.0 ng/mL) postoperative CEA levels (n = 66). The patients were also grouped according to their history of diabetes. Diabetes mellitus (DM) group comprised patients diagnosed with type II diabetes, with or without regular control of their diabetes (n = 112). No-DM group comprised patients without type II diabetes (n = 295). Type II diabetes was diagnosed according to the criteria established by the American Diabetes Association13 that included the following: (1) fasting blood sugar ≥126 mg/dL, (2) 2-hour blood sugar ≥200 mg/dL during a 75-g oral glucose tolerance test, (3) random plasma glucose ≥200 mg/dL (11.1 mmol/L) in patients with classic symptoms of hyperglycemia or hyperglycemic crisis, and (4) hemoglobin A1c ≥6.5%. There were no patients with type I diabetes enrolled in our study.
In this study, smokers were defined as people who have smoked in their lifetime and are smoking cigarettes during the duration of this study. Nonsmokers comprised never smokers (defined as people who have never smoked) and former smokers (defined as people who have smoked in their lifetime but had quit smoking before surgery).
2.2. Data collection
The National Yang-Ming University Hospital Cancer Registry prospectively developed a computerized database and has been updating it continuously. The recorded variables included the following: patient demographic data and major comorbidities; tumor location, number, and stage; gross and microscopic pathological characteristics; and patient status at the last follow-up. Other data such as CEA levels, HbA1c levels, and chemotherapy regimen were retrospectively collected by the authors.
2.3. Evaluation and treatment
Tumor staging was based on the TNM system described in the 7th edition of the International Union Against Cancer/AJCC.14 Serum CEA levels were measured in a single laboratory using an Elecsys E170 analyzer (Roche Diagnostics, Indianapolis, IN, USA), with a recommended upper reference limit of 5 ng/mL. Preoperative CEA levels were measured immediately before the surgery, and postoperative CEA levels were measured 4 to 6 weeks after surgery. All patients were evaluated via staging workups that included colonoscopy, complete blood count, serum CEA measurement, chest radiography, and computed tomography (CT) of the abdomen.
All patients underwent radical surgical resection, which was defined as segmental resection of tumor involving the bowel with a complete mesenteric resection. The surgical safe margins from the tumor were at least 5 cm in colon cancer and 1 cm in rectal cancer. Thirty-one patients also underwent preoperative neoadjuvant chemoradiation therapy (CRT) for locally advanced rectal cancer; preoperative CEA level was measured before CRT initiation. The CRT protocol was as described in a previous publication.15 Postoperative adjuvant chemotherapy was considered for 136 patients with pathologic stage III disease. Among these, 14 did not receive the adjuvant chemotherapy owing to the patient refusal or poor performance status. The chemotherapy regimens were: 5-fluorouracil/leucovorin/oxaliplatin (FOLFOX) in 96 patients, capecitabine/oxaliplatin (XELOX) in 2 patients, oral tegafur/uracil (UFUR) in 22 patients, and oral capecitabine in 2 patients. Postoperative adjuvant chemotherapy was also administered to 99 patients with pathologic stage II disease and risk factors such as pathologic stage pT4, lymphovascular invasion, perineural invasion, and anastomosis leakage. The regimen was FOLFOX in 52 patients and oral UFUR in 47 patients.
2.4. Surveillance protocol
All patients were followed up in the outpatient department every 3 months during the first 2 years after surgery, every 6 months during the third and fourth years, and annually thereafter. Follow-up examinations included measurement of serum CEA levels, chest and abdominopelvic CT, and colonoscopy. It was our policy to perform the first follow-up colonoscopy 6 months after the surgery in those patients who had no preoperative colonoscopy. If the patient underwent a complete colonoscopy before surgery, the first follow-up colonoscopy was performed 1 year after the surgery.
2.5. Statistical analysis
Optimal cutoff CEA values were determined using receiver operating characteristic (ROC) curve analysis and Youden’s index. Chi-square test and Mann-Whitney U test were used to analyze categorical and continuous variables, respectively. Survival curves were plotted using the Kaplan-Meier method, and survival values were compared using the log-rank test. Death and disease recurrence were treated as events in the analysis. Differences in disease-free survival (DFS) rates in the univariate analysis were assessed using the log-rank test. Hazard ratios and associations with DFS were determined via multivariable Cox regression analysis. Variables with p < 0.05 on univariate analysis were included in the multivariable model. Data were analyzed using MedCalc statistical software version 19.2 (MedCalc Software bvba, Ostend, Belgium), and p < 0.05 was considered statistically significant.
3. RESULTS
3.1. Patient characteristics
3.1.1. Overall population
Among the 407 patients included in our study, 219 (54%) were men. The median age was 68 years (range: 28-93 years), and the median preoperative and postoperative CEA concentrations were 3.7 ng/mL (range: 0.5-276 ng/mL) and 2.6 ng/mL (range: 0.4-84.9 ng/mL), respectively. Tumors were located in the right colon in 113 patients (32%), the left colon in 157 patients (38%), and the rectum in 121 patients (30%).
The median follow-up interval was 49 months (range: 4-117 months). Tumors recurred in 60 patients (15%) before the last follow-up. The sites of tumor recurrence were the liver (n = 26), lungs (n = 25), peritoneal carcinomatosis (n = 9), para-aortic lymph nodes (n = 10), bones (n = 4), and brain (n = 2). Local recurrence was observed in 15 patients. There were 83 patients who died before the last follow-up, with 46 deaths caused by cancer and 37 by other causes. The 3- and 5-year DFS rates for all patients were 80.8% and 74.4%, respectively.
3.1.2. By CEA level
The descriptive statistics for patients in group A (normal postoperative CEA levels) and group B (elevated postoperative CEA levels) are shown in Table 1. There were no significant differences in tumor location, N stage, histologic differentiation, or lymphovascular and perineural invasion status between the two groups. Group B comprised a higher percentage of male patients and had a higher median age. The percentage of right colon cancer was higher in group B (42%) than in group A (30%) (p = 0.045). Group B patients tended to have a more advanced T stage than did patients in group A. In addition, a higher number of patients received adjuvant chemotherapy in group B than in group A. The percentage of current smokers was higher in group B (41%) than in group A (19%) (p < 0.001). The percentage of diabetes cases was also higher in group B (53%) than in group A (22%) (p < 0.001).
Table 1.
Patient clinical characteristics by postoperative CEA levels
| Group A (n = 341) | Group B (n = 66) | p | |
|---|---|---|---|
| Sex | |||
| Male | 176 (52%) | 43 (65%) | 0.044 |
| Female | 165 (48%) | 23 (35%) | |
| Age, y, median (range) | 67 (28-93) | 72 (44-89) | 0.044 |
| Tumor location | |||
| Right colon | 101 (30%) | 28 (42%) | 0.045 |
| Left colon | 134 (39%) | 23 (35%) | |
| Rectum | 106 (31%) | 15 (23%) | |
| Preoperative CEA, ng/mL, median (range) | 3.1 (0.5-276) | 7.9 (2.8-263.5) | <0.001 |
| Postoperative CEA, ng/mL, median (range) | 2.3 (0.4-4.8) | 6.7 (5.1-84.9) | <0.001 |
| HbA1c, %, median (range) | 6.2 (4.9-11.6) | 7.2 (4.7-16.7) | <0.001 |
| T stage | |||
| T1 | 69 (20%) | 2 (3%) | <0.001 |
| T2 | 58 (17%) | 8 (12%) | |
| T3 | 201 (59%) | 47 (71%) | |
| T4 | 13 (4%) | 9 (14%) | |
| N stage | |||
| N0 | 233 (68%) | 38 (58%) | 0.232 |
| N1 | 79 (23%) | 21 (32%) | |
| N2 | 29 (9%) | 7 (10%) | |
| Differentiation | |||
| Well | 21 (6%) | 5 (8%) | 0.799 |
| Moderately | 313 (92%) | 59 (89%) | |
| Poorly | 7 (2%) | 2 (3%) | |
| LVI | |||
| Yes | 171 (50%) | 37 (56%) | 0.379 |
| No | 170 (50%) | 29 (44%) | |
| PNI | |||
| Yes | 32 (9%) | 9 (14%) | 0.294 |
| No | 309 (91%) | 57 (86%) | |
| Chemotherapy | |||
| Yes | 189 (55%) | 47 (71%) | 0.017 |
| No | 152 (45%) | 19 (29%) | |
| Smoking | |||
| Yes | 65 (19%) | 27 (41%) | <0.001 |
| No | 276 (81%) | 39 (59%) | |
| Diabetes | |||
| Yes | 76 (22%) | 35 (53%) | <0.001 |
| No | 265 (78%) | 31 (47%) | |
Data are presented as n (%), unless otherwise indicated. Group A, postoperative CEA values <5 ng/mL; Group B, postoperative CEA values ≥5 ng/mL.
CEA = carcinoembryonic antigen; HbA1c = hemoglobin A1c; LVI = lymphovascular invasion; PNI = perineural invasion.
3.1.3. By diabetes history
The descriptive statistics for DM and no-DM groups are shown in Table 2. The patients in DM group had a higher median age than those in no-DM group. Preoperative CEA levels were significantly higher in the patients in DM group than those in the no-DM group (4.8 vs 3.5 ng/mL, p = 0.002). Postoperative CEA levels were also significantly higher in the DM group as compared with the no-DM group (3.1 vs 2.5 ng/mL, p < 0.001). HbA1c levels were significantly higher in the DM group as compared with the no-DM group (7.2 vs 5.8 ng/mL, p < 0.001). The percentages of current smokers were similar in both groups. There were no significant differences in the pathological characteristics or 3-year DFS rate in patients between the DM and no-DM groups (81.0% vs 81.1%, p = 0.720).
Table 2.
Patient characteristics by history of diabetes
| No-DM group (n = 295) | DM group (n = 112) | p | |
|---|---|---|---|
| Sex | |||
| Male | 161 (54%) | 58 (52%) | 0.614 |
| Female | 134 (46%) | 54 (48%) | |
| Age, y, median (range) | 67 (28-93) | 70 (49-89) | 0.031 |
| Tumor location | |||
| Right colon | 88 (30%) | 41 (37%) | 0.297 |
| Left colon | 120 (40%) | 37 (33%) | |
| Rectum | 87 (30%) | 34 (30%) | |
| Preoperative CEA, ng/mL, median (range) | 3.5 (0.5-263.5) | 4.8 (1.1-276) | 0.002 |
| Postoperative CEA, ng/mL, median (range) | 2.5 (0.4-84.9) | 3.1 (0.8-18.4) | <0.001 |
| HbA1c, %, median (range) | 5.8 (4.7-6.4) | 7.2 (5.2-16.7) | <0.001 |
| T stage | |||
| T1 | 52 (18%) | 19 (17%) | 0.952 |
| T2 | 47 (16%) | 19 (17%) | |
| T3 | 179 (60%) | 69 (62%) | |
| T4 | 17 (6%) | 5 (4%) | |
| N stage | |||
| N0 | 192 (65%) | 79 (71%) | 0.155 |
| N1 | 72 (24%) | 28 (25%) | |
| N2 | 31 (11%) | 5 (5%) | |
| Differentiation | |||
| Well | 18 (6%) | 8 (7%) | 0.854 |
| Moderately | 271 (92%) | 101 (90%) | |
| Poorly | 6 (2%) | 3 (3%) | |
| LVI | |||
| Yes | 152 (52%) | 56 (50%) | 0.784 |
| No | 143 (48%) | 56 (50%) | |
| PNI | |||
| Yes | 33 (11%) | 8 (7%) | 0.227 |
| No | 262 (89%) | 104 (93%) | |
| Chemotherapy | |||
| Yes | 169 (57%) | 67 (60%) | 0.644 |
| No | 126 (43%) | 45 (40%) | |
| Smoking | |||
| Yes | 63 (21%) | 29 (26%) | 0.329 |
| No | 232 (79%) | 83 (74%) | |
Data are presented as n (%), unless otherwise indicated.
CEA = carcinoembryonic antigen; DM = diabetes mellitus; HbA1c = hemoglobin A1c; LVI = lymphovascular invasion; PNI = perineural invasion.
3.2. Disease-free survival
The 3-year DFS rate was significantly higher in group A (83.8%) than in group B (63.6%) (p < 0.001; Fig. 1A). Among patients in the no-DM group, the 3-year DFS rate was also higher in group A than in group B (84.3% vs 42.9%, p < 0.001; Fig. 1B). However, among patients in the DM group, no difference in the 3-year DFS rates was found between groups A and B (82.6% vs 82.2%, p = 0.536; Fig. 1C).
Fig. 1.
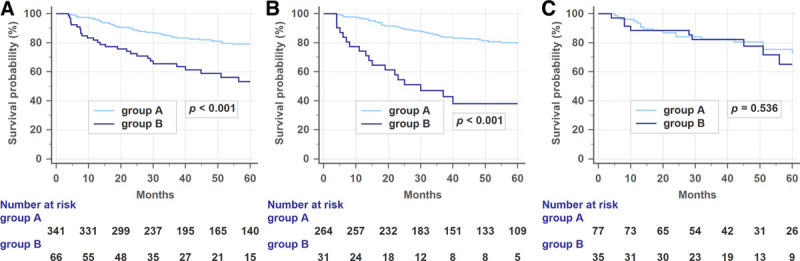
(A) Disease-free survival (DFS) rates in all patients relative to postoperative carcinoembryonic antigen (CEA) levels. The 3-year DFS was higher in group A than in group B. (B) DFS rates in patients without diabetes relative to postoperative CEA levels. Among patients without diabetes, the 3-year DFS rate was also higher in group A than in group B. (C) DFS rates in patients with diabetes relative to postoperative CEA levels. Among patients with diabetes, the DFS rates were similar in both groups.
There was no significant difference in the 3-year DFS between DM and no-DM patients (81.0% vs 81.1%, p = 0.720). However, in subgroup analysis, group B patients with diabetes had a significantly higher 3-year DFS rate than those without diabetes (82.2% vs 42.9%, p = 0.003; Fig. 2).
Fig. 2.
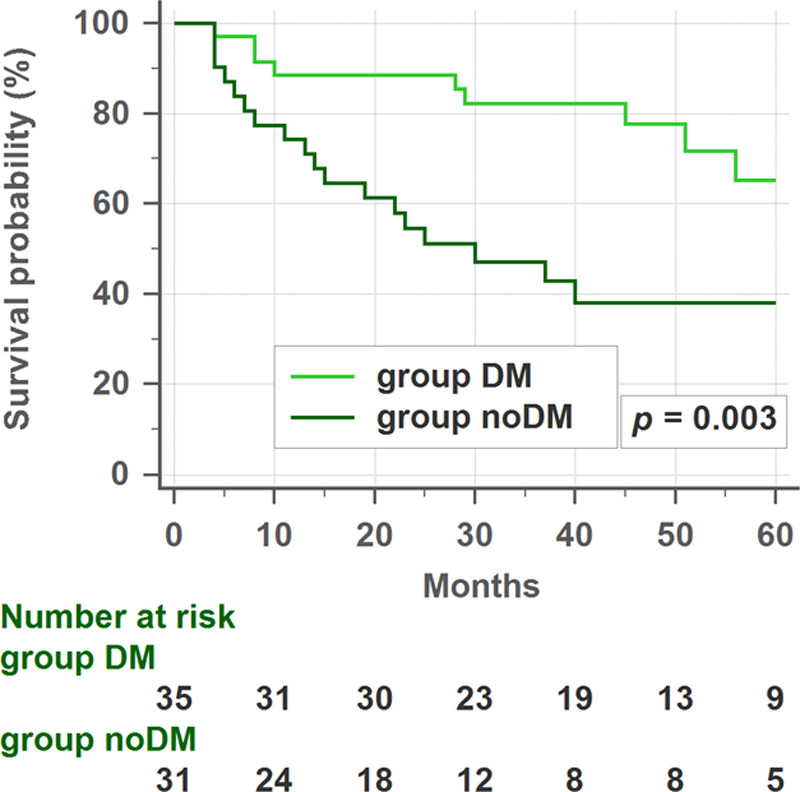
Disease-free survival (DFS) rates in group B patients (elevated postoperative carcinoembryonic antigen [CEA] levels) with or without diabetes. In the subgroup analysis, patients with diabetes had higher 3-year DFS rates than patients without diabetes. DM = diabetes mellitus.
Univariate analysis showed that preoperative CEA levels, postoperative CEA levels, tumor stage, age, lymphovascular invasion, and perineural invasion status were predictive factors of DFS (Table 3). In multivariable analysis, postoperative CEA levels, tumor stage, and age were significant independent prognostic factors for DFS (Table 4). In subgroup analysis, both univariate (Table 5) and multivariable analyses (Table 6) showed that only tumor stage was a significant independent prognostic factor for DFS in patients with type II diabetes.
Table 3.
Univariate analysis of prognostic factors for disease-free survival
| No. of patients | 3-y DFS rate | p | |
|---|---|---|---|
| Sex | |||
| Male | 219 | 77.0% | 0.136 |
| Female | 188 | 84.5% | |
| Age, y | |||
| <75 | 279 | 83.4% | <0.001 |
| ≥75 | 128 | 75.1% | |
| Preoperative CEA | |||
| <5 | 240 | 88.4% | <0.001 |
| ≥5 | 167 | 70.0% | |
| Postoperative CEA | |||
| <5 | 341 | 83.8% | <0.001 |
| ≥5 | 66 | 63.6% | |
| Tumor location | |||
| Right | 129 | 76.9% | 0.207 |
| Left | 157 | 80.7% | |
| Rectum | 121 | 85.1% | |
| Differentiation | |||
| Well | 26 | 86.8% | 0.627 |
| Moderately | 372 | 80.5% | |
| Poorly | 9 | 76.2% | |
| LVI | |||
| Yes | 208 | 73.0% | <0.001 |
| No | 199 | 88.4% | |
| PNI | |||
| Yes | 41 | 60.6% | <0.001 |
| No | 366 | 83.0% | |
| TNM stage | |||
| I | 125 | 94.6% | <0.001 |
| II | 146 | 84.3% | |
| III | 136 | 63.4% | |
| Smoking | |||
| Yes | 92 | 80.5% | 0.471 |
| No | 315 | 80.9% | |
| Diabetes | |||
| Yes | 112 | 81.0% | 0.720 |
| No | 295 | 81.1% | |
CEA = carcinoembryonic antigen; DFS = disease-free survival; LVI = lymphovascular invasion; PNI = perineural invasion; TNM = tumor-node-metastasis.
Table 4.
Multivariate analysis of prognostic factors for disease-free survival
| Hazard ratio | 95% CI | p | |
|---|---|---|---|
| Postoperative CEA | |||
| <5 | 1 | ||
| ≥5 | 1.925 | 1.162-3.191 | 0.011 |
| TNM stage | |||
| I | 1 | ||
| II | 2.667 | 1.152-6.174 | 0.022 |
| III | 5.452 | 2.396-12.408 | <0.001 |
| Age, y | |||
| <75 | 1 | ||
| ≥75 | 1.873 | 1.262-2.779 | 0.002 |
CEA = carcinoembryonic antigen; CI = confidence interval; TNM = tumor-node-metastasis.
Table 5.
Univariate analysis of prognostic factors for DFS in DM patients
| No. of patients | 3-y DFS rate | p | |
|---|---|---|---|
| Sex | |||
| Male | 58 | 82.6% | 0.716 |
| Female | 54 | 82.5% | |
| Age, y | |||
| <75 | 75 | 83.5% | 0.596 |
| ≥75 | 37 | 79.8% | |
| Preoperative CEA | |||
| <5 | 61 | 86.4% | 0.063 |
| ≥5 | 51 | 77.6% | |
| Postoperative CEA | |||
| <5 | 77 | 82.6% | 0.536 |
| ≥5 | 35 | 82.2% | |
| Tumor location | |||
| Right | 41 | 81.8% | 0.331 |
| Left | 37 | 72.8% | |
| Rectum | 34 | 93.9% | |
| Differentiation | |||
| Well | 8 | 70.0% | 0.414 |
| Moderately | 101 | 83.7% | |
| Poorly | 3 | 66.7% | |
| LVI | |||
| Yes | 56 | 78.3% | 0.467 |
| No | 56 | 86.5% | |
| PNI | |||
| Yes | 8 | 75.0% | 0.173 |
| No | 104 | 83.0% | |
| TNM stage | |||
| I | 35 | 93.7% | 0.029 |
| II | 44 | 79.1% | |
| III | 33 | 75.1% | |
| Smoking | |||
| Yes | 29 | 86.2% | 0.782 |
| No | 83 | 81.0% | |
| Metformin | |||
| Yes | 78 | 88.1% | 0.126 |
| No | 34 | 68.7% | |
CEA = carcinoembryonic antigen; DFS = disease-free survival; DM = diabetes mellitus; LVI = lymphovascular invasion; PNI = perineural invasion; TNM = tumor-node-metastasis.
Table 6.
Multivariate analysis of prognostic factors for DFS in DM patients
| Hazard ratio | 95% CI | p | |
|---|---|---|---|
| TNM stage | |||
| I | 1 | ||
| II | 2.298 | 0.748-9.738 | 0.130 |
| III | 4.350 | 1.087-14.513 | 0.037 |
CI = confidence interval; DFS = disease-free survival; DM = diabetes mellitus; TNM = tumor-node-metastasis
3.3. Optimal cutoff values of serum CEA levels for patients with diabetes
The optimal cutoff for CEA levels values in patients with type II diabetes was determined using ROC curve analysis. Preoperative and postoperative serum CEA levels showed no prognostic efficacy for colorectal cancer in patients with type II diabetes, with areas under the receiver operating characteristic curve (AUC) values of 0.591 and 0.557, respectively. The optimal cutoff value for preoperative serum CEA levels was 5.8 ng/mL; this value had a sensitivity, specificity, and Youden’s index of 55.6%, 64.0%, and 0.196, respectively. Meanwhile, the optimal cutoff value for postoperative serum CEA levels was 1.7 ng/mL, with sensitivity, specificity, and Youden’s index of 96.5%, 19.7%, and 0.163, respectively.
4. DISCUSSION
In this study, we evaluated the impact of diabetes on CEA prognostic accuracy in colorectal cancer. Postoperative serum CEA levels serve as an established prognostic factor for patients with colorectal cancer. However, CEA levels may depend on other physiological conditions such as type II diabetes rather than the cancer alone. These physiological conditions could influence the prognosis evaluation. Until now, there was no information on the prognostic value of postoperative CEA levels in patients with diabetes and colorectal cancer. In this study, we showed that postoperative CEA levels significantly influenced DFS rates. Patients with normal postoperative serum CEA levels (group A) had a better prognosis than those with elevated postoperative CEA levels (group B). These results are consistent with those shown in previous studies.4,5,16–19 However, as a novel finding, we showed that patients with elevated postoperative CEA levels and diabetes may not have a worse prognosis than those without diabetes. To the best of our knowledge, this is the first study to determine the prognostic value of postoperative CEA levels in colorectal cancer patients with diabetes.
CEA has been shown to be positively associated with hyperglycemia in patients with diabetes.10–12,14 Some studies reported that HbA1c levels correlated with the levels of CEA in patients with diabetes.10,14 However, the mechanism behind this phenomenon is unclear. Potential mechanisms by which diabetes might lead to increased CEA levels include chronic immune cell recruitment and inflammation. It has also been reported that patients with diabetes had increased levels of inflammatory molecules such as C-reactive protein (CRP) and interleukin-6.15,18 These findings may partially explain the elevated CEA levels found in patients with diabetes. In our study, patients in the DM group had higher preoperative and postoperative serum CEA levels than patients in the no-DM group (4.8 vs 3.5, p = 0.002; 3.1 vs 2.5, p < 0.001). Furthermore, the proportion of patients with elevated postoperative CEA was also higher in the DM group (31.3% vs 10.5%, p < 0.001). This suggests that the CEA values obtained in patients with diabetes may not represent the actual levels of CEA caused by the cancer disease. This could explain why elevated postoperative serum CEA level appears as a less accurate prognostic factor in colorectal cancer patients with diabetes.
Our data showed no significant difference in the 3-year DFS between DM and no-DM patients (81.0% vs 81.1%, p = 0.720). The association between diabetes and survival in patients with colorectal cancer has yet to be established, with most19–22 but not all studies23–25 linking diabetes with worse survival rates. Furthermore, DM patients treated with metformin showed an improved survival outcome compared with DM patients treated with other agents.26–28 Although Kaplan-Meier curve showed a trend towards survival benefit in patients with type II diabetes and Metformin use (88.1% vs 68.7%, p = 0.126), the sample size was too small to show statistical significance in our study. Most patients with type II diabetes (69.6%) in our study were treated with metformin as one of the prescribed medications, which may have affected our results.
Serum CEA is a widely accepted tumor marker, particularly for colorectal cancer. An elevated preoperative CEA level is considered an independent prognostic factor in colorectal carcinoma.17,29,30 However, some studies reported that postoperative CEA levels had a higher prognostic value than preoperative CEA levels. In these studies, postoperative, but not preoperative, CEA status was shown as a significant prognostic predictor in multivariable analyses.3–5 Konishi et al5 found no significant difference in the 3-year DFS rates between patients with normalized postoperative CEA levels and those with normal preoperative CEA levels. An elevated preoperative CEA level is not informative when the postoperative level is normal; thus, preoperative CEA measurements may be disregarded. In agreement with this suggestion, postoperative CEA levels had a higher prognostic value as compared with preoperative CEA levels in our multivariable model.
In our study, both preoperative and postoperative serum CEA levels showed no prognostic efficacy for DM patients, with AUC values of 0.591 and 0.557, respectively. It was not plausible to redefine serum CEA level elevation by simply increasing the threshold because we found no linear correlation between serum CEA values and DFS in this subgroup. The optimal cutoff value for postoperative serum CEA levels in patients in DM group was 1.7 ng/mL, which was even lower than the global standard CEA cutoff value of 5.0 ng/mL.29 As such, we failed to identify a predictive threshold for DM patients before and after the surgery.
In addition to postoperative CEA levels, we found that tumor stage and age were also independent prognostic factors for DFS on multivariable analysis. Regional lymph node involvement is one of the strongest predictors of outcome following surgical resection of colorectal cancers. In fact, nodal spread, rather than elevated CEA, is an accepted indication for adjuvant therapy for colorectal cancer in most guidelines.1,2 Advanced age has also been shown to reduce overall survival and DFS rates and, to a lesser extent, cancer-specific survival rates in patients with colorectal cancer.31–34
The major limitation of our study was the variability of the adjuvant chemotherapy regimens. As the sample size of patients who were treated with XELOX and capecitabine was too small for conclusions, we compared FOLFOX/XELOX treatment with UFUR/capecitabine instead. The analysis comparing patients treated with different chemotherapy regimens showed no significant difference in DFS (FOLFOX/XELOX vs UFUR/capecitabine, 73.3% vs 75.2%, p = 0.544). As a further limitation, we did not consider the tobacco usage, which is one of the most common causes of CEA elevation. However, the percentage of smokers was similar in the DM and no-DM groups (26% vs 21%, p = 0.329). An additional limitation was the lack of consideration of other factors (eg, chronic obstructive pulmonary disease, liver disease, and acute or chronic inflammation) that could also generate false-positive CEA results. Finally, our study was retrospective, with a relatively small number of patients, and the follow-up period for some patients was short. In the future, large prospective studies analyzing CEA kinetics via measurements of follow-up CEA levels are required. The levels of HbA1c and the use of diabetic medications should also be taken into consideration.
Our findings demonstrated that type II diabetes was associated with higher preoperative and postoperative CEA levels in patients with colorectal cancer. Consequently, elevated postoperative CEA level was not associated with shorter 3-year DFS in patients with type II diabetes, as opposed to patients without type II diabetes. Therefore, colorectal cancer patients with type II diabetes may need alternative tumor markers to be used in a surveillance strategy after curative surgery.
ACKNOWLEDGMENTS
This article was supported by grants from National Yang-Ming University Hospital (grant number RD2020-011). The authors would like to acknowledge Wei-Ching Lin for her help in coordinating the clinical aspects of this study.
Footnotes
Conflicts of interest: The authors declare that they have no conflicts of interest related to the subject matter or materials discussed in this article.
REFERENCES
- 1.National Comprehensive Cancer Network Colon Cancer (Version 1.2020). Available at https://www.nccn.org/professionals/physician_gls/default.aspx. Accessed February 1, 2020.
- 2.Locker GY, Hamilton S, Harris J, Jessup JM, Kemeny N, Macdonald JS, et al. ; ASCO ASCO 2006 update of recommendations for the use of tumor markers in gastrointestinal cancer. J Clin Oncol. 2006;24:5313–27. [DOI] [PubMed] [Google Scholar]
- 3.Choi JS, Min JS. Significance of postoperative serum level of carcinoembryonic antigen (CEA) and actual half life of CEA in colorectal cancer patients. Yonsei Med J. 1997;38:1–7. [DOI] [PubMed] [Google Scholar]
- 4.Lin JK, Lin CC, Yang SH, Wang HS, Jiang JK, Lan YT, et al. Early postoperative CEA level is a better prognostic indicator than is preoperative CEA level in predicting prognosis of patients with curable colorectal cancer. Int J Colorectal Dis. 2011;26:1135–41. [DOI] [PubMed] [Google Scholar]
- 5.Konishi T, Shimada Y, Hsu M, Tufts L, Jimenez-Rodriguez R, Cercek A, et al. Association of preoperative and postoperative serum carcinoembryonic antigen and colon cancer outcome. JAMA Oncol. 2018;4:309–15. [DOI] [PMC free article] [PubMed] [Google Scholar]
- 6.Bhatti I, Patel M, Dennison AR, Thomas MW, Garcea G. Utility of postoperative CEA for surveillance of recurrence after resection of primary colorectal cancer. Int J Surg. 2015;16(Pt A):123–8. [DOI] [PubMed] [Google Scholar]
- 7.Loewenstein MS, Zamcheck N. Carcinoembryonic antigen (CEA) levels in benign gastrointestinal disease states. Cancer. 1978;42(3 Suppl):1412–8. [DOI] [PubMed] [Google Scholar]
- 8.Stockley RA, Shaw J, Whitfield AG, Whitehead TP, Clarke CA, Burnett D. Effect of cigarette smoking, pulmonary inflammation, and lung disease on concentrations of carcinoembryonic antigen in serum and secretions. Thorax. 1986;41:17–24. [DOI] [PMC free article] [PubMed] [Google Scholar]
- 9.Sajid KM, Chaouachi K, Mahmood R. Hookah smoking and cancer: carcinoembryonic antigen (CEA) levels in exclusive/ever hookah smokers. Harm Reduct J. 2008;5:19. [DOI] [PMC free article] [PubMed] [Google Scholar]
- 10.Lu J, Wang H, Zhang X, Yu X. HbA1c is positively associated with serum carcinoembryonic antigen (CEA) in patients with diabetes: a cross-sectional study. Diabetes Ther. 2018;9:209–17. [DOI] [PMC free article] [PubMed] [Google Scholar]
- 11.No JI, Yang JY, Hyun HJ, Yeon CS, Choi HJ. Factors associated with serum levels of carcinoembryonic antigen in healthy non-smokers. Korean J Fam Med. 2013;34:413–9. [DOI] [PMC free article] [PubMed] [Google Scholar]
- 12.Kang HY, Choe EK, Park KJ, Lee Y. Factors requiring adjustment in the interpretation of serum carcinoembryonic antigen: a cross-sectional study of 18,131 healthy nonsmokers. Gastroenterol Res Pract. 2017;2017:9858931. [DOI] [PMC free article] [PubMed] [Google Scholar]
- 13.American Diabetes Association Classification and diagnosis of diabetes: standards of medical care in diabetes-2018. Diabetes Care. 2018;41:S13–27. [DOI] [PubMed] [Google Scholar]
- 14.Chung S, Lee Y, Roh EY. HbA1c showed a positive association with carcinoembryonic antigen (CEA) level in only diabetes, not prediabetic or normal individuals. J Clin Lab Anal. 2019;33:e22900. [DOI] [PMC free article] [PubMed] [Google Scholar]
- 15.Pham MN, Hawa MI, Pfleger C, Roden M, Schernthaner G, Pozzilli P, et al. ; Action LADA Study Group Pro- and anti-inflammatory cytokines in latent autoimmune diabetes in adults, type 1 and type 2 diabetes patients: Action LADA 4. Diabetologia. 2011;54:1630–8. [DOI] [PubMed] [Google Scholar]
- 16.Slentz K, Senagore A, Hibbert J, Mazier WP, Talbott TM. Can preoperative and postoperative CEA predict survival after colon cancer resection? Am Surg. 1994;60:528–31; discussion 531–2. [PubMed] [Google Scholar]
- 17.Wang JY, Lu CY, Chu KS, Ma CJ, Wu DC, Tsai HL, et al. Prognostic significance of pre- and postoperative serum carcinoembryonic antigen levels in patients with colorectal cancer. Eur Surg Res. 2007;39:245–50. [DOI] [PubMed] [Google Scholar]
- 18.Xiang Y, Zhou P, Li X, Huang G, Liu Z, Xu A, et al. Heterogeneity of altered cytokine levels across the clinical spectrum of diabetes in China. Diabetes Care. 2011;34:1639–41. [DOI] [PMC free article] [PubMed] [Google Scholar]
- 19.Zhu B, Wu X, Wu B, Pei D, Zhang L, Wei L. The relationship between diabetes and colorectal cancer prognosis: a meta-analysis based on the cohort studies. PLoS One. 2017;12:e0176068. [DOI] [PMC free article] [PubMed] [Google Scholar]
- 20.Mills KT, Bellows CF, Hoffman AE, Kelly TN, Gagliardi G. Diabetes mellitus and colorectal cancer prognosis: a meta-analysis. Dis Colon Rectum. 2013;56:1304–19. [DOI] [PMC free article] [PubMed] [Google Scholar]
- 21.Dehal AN, Newton CC, Jacobs EJ, Patel AV, Gapstur SM, Campbell PT. Impact of diabetes mellitus and insulin use on survival after colorectal cancer diagnosis: the Cancer Prevention Study-II Nutrition Cohort. J Clin Oncol. 2012;30:53–9. [DOI] [PubMed] [Google Scholar]
- 22.Meyerhardt JA, Catalano PJ, Haller DG, Mayer RJ, Macdonald JS, Benson AB, 3rd, et al. Impact of diabetes mellitus on outcomes in patients with colon cancer. J Clin Oncol. 2003;21:433–40. [DOI] [PubMed] [Google Scholar]
- 23.Karlin NJ, Amin SB, Kosiorek HE, Buras MR, Verona PM, Cook CB. Survival and glycemic control in patients with colorectal cancer and diabetes mellitus. Future Sci OA. 2018;4:FSO335. [DOI] [PMC free article] [PubMed] [Google Scholar]
- 24.Noh GY, Hwang DY, Choi YH, Lee YY. Effect of diabetes mellitus on outcomes of colorectal cancer. J Korean Soc Coloproctol. 2010;26:424–8. [DOI] [PMC free article] [PubMed] [Google Scholar]
- 25.Jullumstrø E, Kollind M, Lydersen S, Edna TH. Diabetes mellitus and outcomes of colorectal cancer. Acta Oncol. 2009;48:361–7. [DOI] [PubMed] [Google Scholar]
- 26.Garrett CR, Hassabo HM, Bhadkamkar NA, Wen S, Baladandayuthapani V, Kee BK, et al. Survival advantage observed with the use of metformin in patients with type II diabetes and colorectal cancer. Br J Cancer. 2012;106:1374–8. [DOI] [PMC free article] [PubMed] [Google Scholar]
- 27.Lee JH, Kim TI, Jeon SM, Hong SP, Cheon JH, Kim WH. The effects of metformin on the survival of colorectal cancer patients with diabetes mellitus. Int J Cancer. 2012;131:752–9. [DOI] [PubMed] [Google Scholar]
- 28.Mei ZB, Zhang ZJ, Liu CY, Liu Y, Cui A, Liang ZL, et al. Survival benefits of metformin for colorectal cancer patients with diabetes: a systematic review and meta-analysis. PLoS One. 2014;9:e91818. [DOI] [PMC free article] [PubMed] [Google Scholar]
- 29.Thirunavukarasu P, Sukumar S, Sathaiah M, Mahan M, Pragatheeshwar KD, Pingpank JF, et al. C-stage in colon cancer: implications of carcinoembryonic antigen biomarker in staging, prognosis, and management. J Natl Cancer Inst. 2011;103:689–97. [DOI] [PubMed] [Google Scholar]
- 30.Tarantino I, Warschkow R, Worni M, Merati-Kashani K, Köberle D, Schmied BM, et al. Elevated preoperative CEA is associated with worse survival in stage I-III rectal cancer patients. Br J Cancer. 2012;107:266–74. [DOI] [PMC free article] [PubMed] [Google Scholar]
- 31.Simmonds PD, Best L, George S, Baughan C, Buchanan R, Davis C, et al. Surgery for colorectal cancer in elderly patients: a systematic review. Lancet. 2000;356:968–74. [PubMed] [Google Scholar]
- 32.Hermans E, van Schaik PM, Prins HA, Ernst MF, Dautzenberg PJ, Bosscha K. Outcome of colonic surgery in elderly patients with colon cancer. J Oncol. 2010;2010:865908. [DOI] [PMC free article] [PubMed] [Google Scholar]
- 33.Arnaud JP, Schloegel M, Ollier JC, Adloff M. Colorectal cancer in patients over 80 years of age. Dis Colon Rectum. 1991;34:896–8. [DOI] [PubMed] [Google Scholar]
- 34.Doat S, Thiébaut A, Samson S, Ricordeau P, Guillemot D, Mitry E. Elderly patients with colorectal cancer: treatment modalities and survival in France. National data from the ThInDiT cohort study. Eur J Cancer. 2014;50:1276–83. [DOI] [PubMed] [Google Scholar]