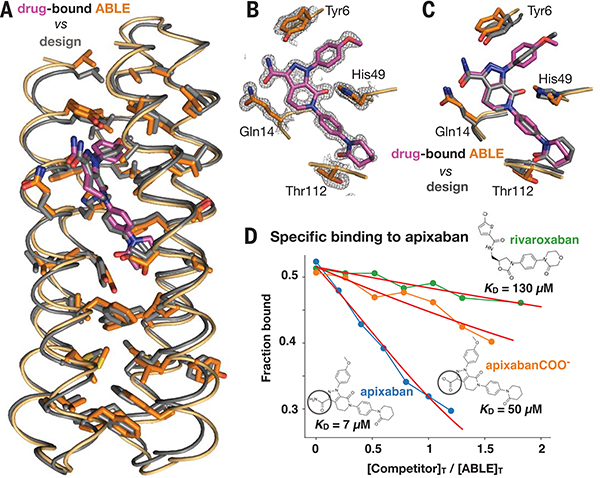
Fig. 4. The structure of apixaban-bound ABLE agrees with the design.
(A) Superposition of backbone Cα atoms of structure (protein in orange, apixaban in purple) and design (gray; 0.7 Å RMSD), showing side chains of amino acids in the protein core. (B) ABLE’s binding site from the structure (1.3-Å resolution), showing vdM-derived interactions with apixaban (purple). The 2mFo-DFc composite omit map is contoured at 1.5 σ. The map was generated from a model that omitted coordinates of apixaban. The protein backbone of these residues is shown in cartoon format. (C) Overlay of designed interactions (gray), after the designed model was superimposed onto the Cα atoms of the structure (protein in orange, apixaban in purple). (D) Fluorescence anisotropy competition experiments (485-nm excitation, 528-nm emission) showed that ABLE binds apixaban specifically. The bound fluorophore apixaban–polyethylene glycol–fluorescein isothiocyanate (apixaban-PEG-FITC) (supplementary text and fig. S9) is dislodged by addition of competing ligand. Anisotropy was converted to the fraction bound by use of a one-site binding model (supplementary text). The ABLE concentration was 20 μM, and the apixaban-PEG-FITC concentration was 25 nM in buffer containing 50 mM NaPi, 100 mM NaCl (pH 7.4). Apixaban COO− is identical to apixaban except that it contains a carboxylate instead of a carboxamide (circled). Rivaroxaban is another inhibitor that also binds tightly to factor Xa by using the same binding mode as apixaban but shows only very weak binding to ABLE. Fits to a competitive binding model are shown in red. KD values: rivaroxaban, 130 (± 10) μM; apixaban COO−, 50 (± 5) μM; apixaban, 7 (± 2) μM.

