

Abstract
A process for maximizing the titer of lentivirus particles, deemed to be a necessity for transducing primary cells, has been developed. Lentivirus particles, with a set of transgenes encoding an artificial cell-signaling pathway, were used to transform primary T cells as vectors for calibrated synthesis of desired proteins in situ, i.e. T-cell Biofactory cells. The process was also used to generate primary T cells expressing antigen-specific chimeric antigen receptors, i.e. CAR T cells. The two differenty engineered primary T cells were expanded and validated for their respective functions, i.e. calibrated synthesis of desired proteins upon engaging the target cells, which was specific for the T-cell Biofactory cells; and cytolysis of the target cells common to both types of cells. The process is compliant with current Good Manufacturing Practices (cGMP) and can be used to support the scale up for clinical translation.
Keywords: Cell manufacturing, high-titer lentivirus production, cell engineering, CAR T cells, drug delivery
Graphical Abstract
A process for maximizing lentivirus titer has been developed and utilized for transforming primary T cells into vectors for calibrated synthesis of desired proteins in situ, i.e. T-cell Biofactory cells. The transformed cells were expanded and validated for their innate cytolytic and engineered functions in-vitro.

3.0. Introduction
Inter-patient variability is a challenge in context of optimal dosing. Continuous monitoring of the disease state for individual patient is not pragmatic[1,2]. Current standard of care in drug delivery is to administer doses normalized to the body weight and surface area[3]. However, the disease burden, that is different for similar-sized patients, is not accounted for[4,5]. Excess of therapeutic agents in systemic circulation lead to morbidity and their suboptimal levels lead to drug resistance. As such, options for many cell-based diseases (e.g. cancers, viral infections, autoimmune disorders) that evade the immune system are limited. To address this challenge, we recently reported[6] on a cell-based living vector that, upon interacting with the antigen-presenting target cells, synthesizes proportionate amounts of desired proteins in situ. While the transformation and subsequent stabilization is realizable with immortalized cell lines, this is a challenge with primary cells that have limited lifespan. As a next step towards the continuum of our research and to position the technology further along the path of clinical translation, we have now exchanged the immortalized cell line with the primary human T cells as the cellular chassis, i.e. antigen-specific primary T-cell Biofactory cell.
Replication-deficient pseudotyped lentivirus vector, derived from the human immunodeficiency virus, has been the primary vehicle for developing cell-based therapeutics [7,8]. A significant body of knowledge exists regarding the different factors that impact the production of lentivirus particles but a systematic comparison to cumulatively enhance the titer is missing. Here we report on a robust process for manufacturing lentivirus vectors and used them to transform primary T cells into antigen-specific T-cell Biofactory. We show the process capablity of producing a functional titer of 108 Infectious Units (IFU)/mL from a single 100-mm cell culture dish (area= 55 cm2); and scaled it up to T175 flask (area= 175 cm2). The process reported in this work is compliant with current Good Manufacturing Practices (cGMP) and can thus be scaled up for use in Phase I/II trials.
We showed that the resulting Folate Receptor alpha (FRα)-specific T-cell Biofactory cells were functionally active as, upon engaging with the target cells (FRα+ OVCAR3), they lysed the target cells and performed their engineered function of synthesizing non-human proteins. The feasibility of the primary T-cell Biofactory was validated by using a reporter enzyme, the DNA template of which will be replaced with a protein of desired function for respective clinical applications. In parallel, we also used the process to generate FRα-specific chimeric antigen receptor (FRα-CAR) T cells that are further along the translational path and the manufacturing of which continues to be a challenge[9,10].
4.0. Results
A lentivirus manufacturing process was designed and is outlined in Figure 1. Factors expected to impact the process yield were compared and configured for maximizing the lentivirus titer. Briefly, a producer cell line was expanded and transfected with plasmids encoding transgenes responsible for assembling the replication-deficient pseudoviruses. The cell culture supernatant, expected to contain lentivirus particles, was harvested, processed, and concentrated. A physical titer of ~6 × 10⁸ viral particles per cm2 of cell growth surface, was obtained. Assuming the relationship between physical and functional titer to be 100:1[11], this results into a functional titer of ~6 × 10⁶ IFU/cm2 of cell growth surface, i.e. total yield of ~109 IFU from one T175 flask. The lentivirus particles were finally used to transform primary T cells at the Multiplicity of Infection (MOI) of 10.
Figure 1. Schematic of the process.
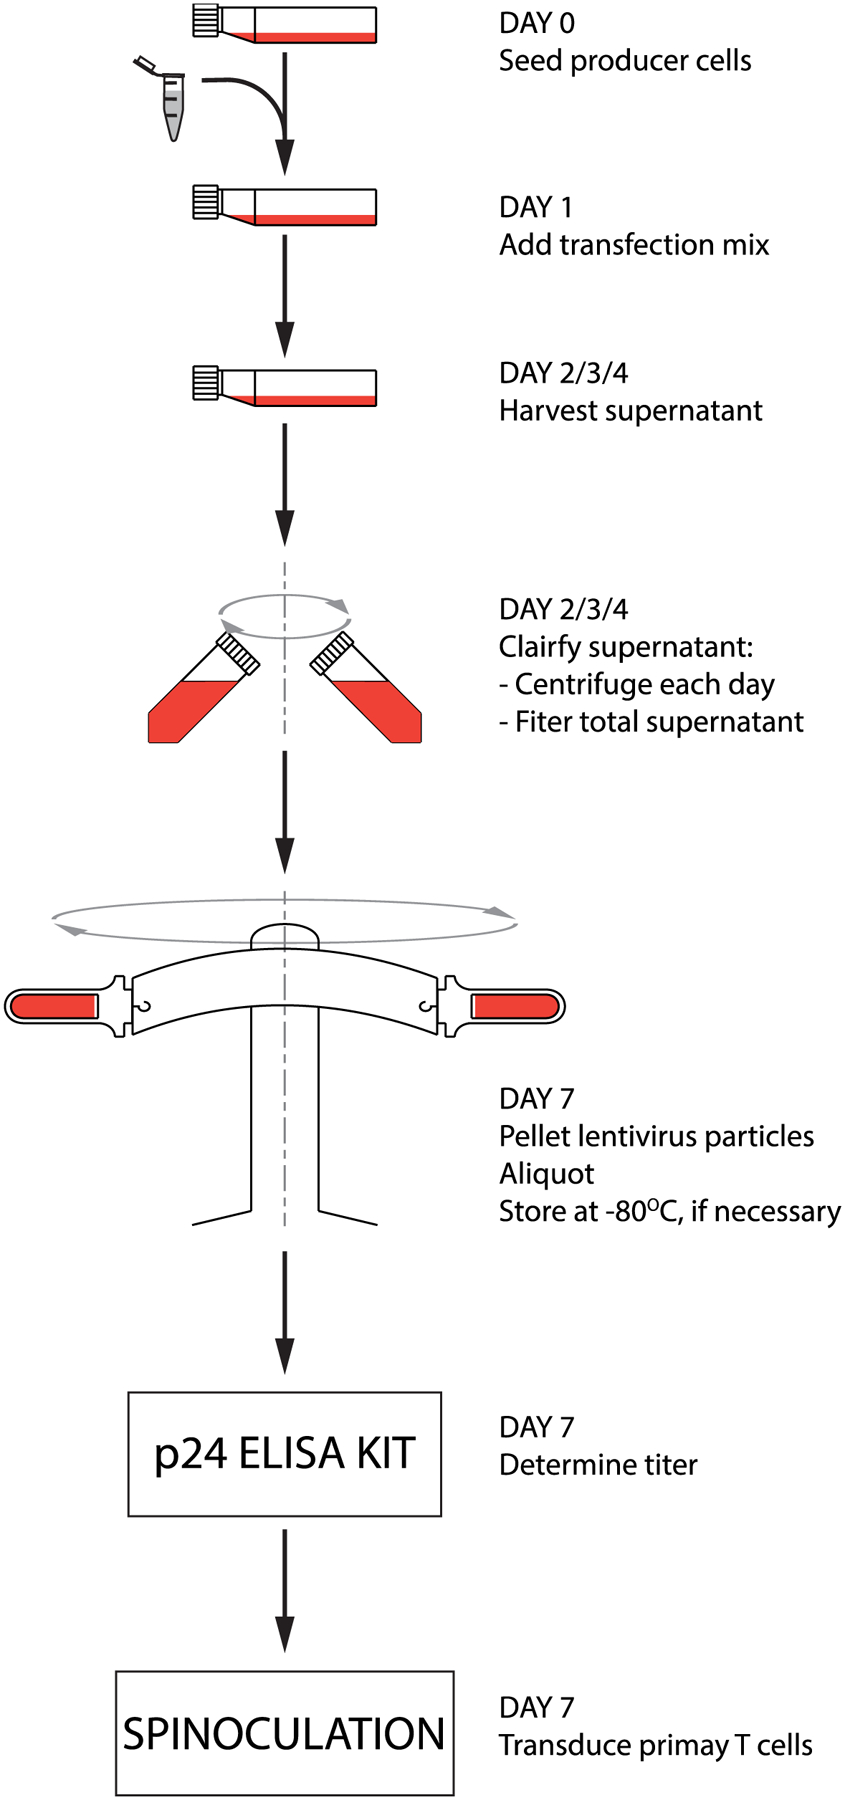
Process flow for lentivirus production scaled-up to obtain functional lentivirus titer of ~6 × 10⁶ Infectious Units (IFU)/cm2 of cell growth surface (i.e. ~109 IFU for a single T175 flask).
Figure 2 presents the comparison made in 100-mm tissue culture dishes (55 cm2) for various factors that affect lentivirus production and the eventual scale-up of the process in T175 flask (175 cm2). The number of HEK293T producer cells seeded per unit area that reached 70–80% confluency at 24 hrs was determined to be 75,000 cells/cm2 of the growth surface. As presented in Figure 2A, this produced a higher titer of the lentivirus compared to 55,000 or 100,000 cells/cm2. The lentivirus production was comparatively higher in HEK293T/17, as presented in Figure 2B, and has also been identified by others for increased transfectability and improved lentivirus production[12]. Cumulative DNA quantity transfected into the producer cells impacts the lentivirus production[13], which was also observed by us and reported in Figure 2C. Lentivirus titer was higher when 2.5 μg of total DNA was transfected into 106 cells compared to 5.0 μg.
Figure 2. Factors affecting the lentivirus process yield.
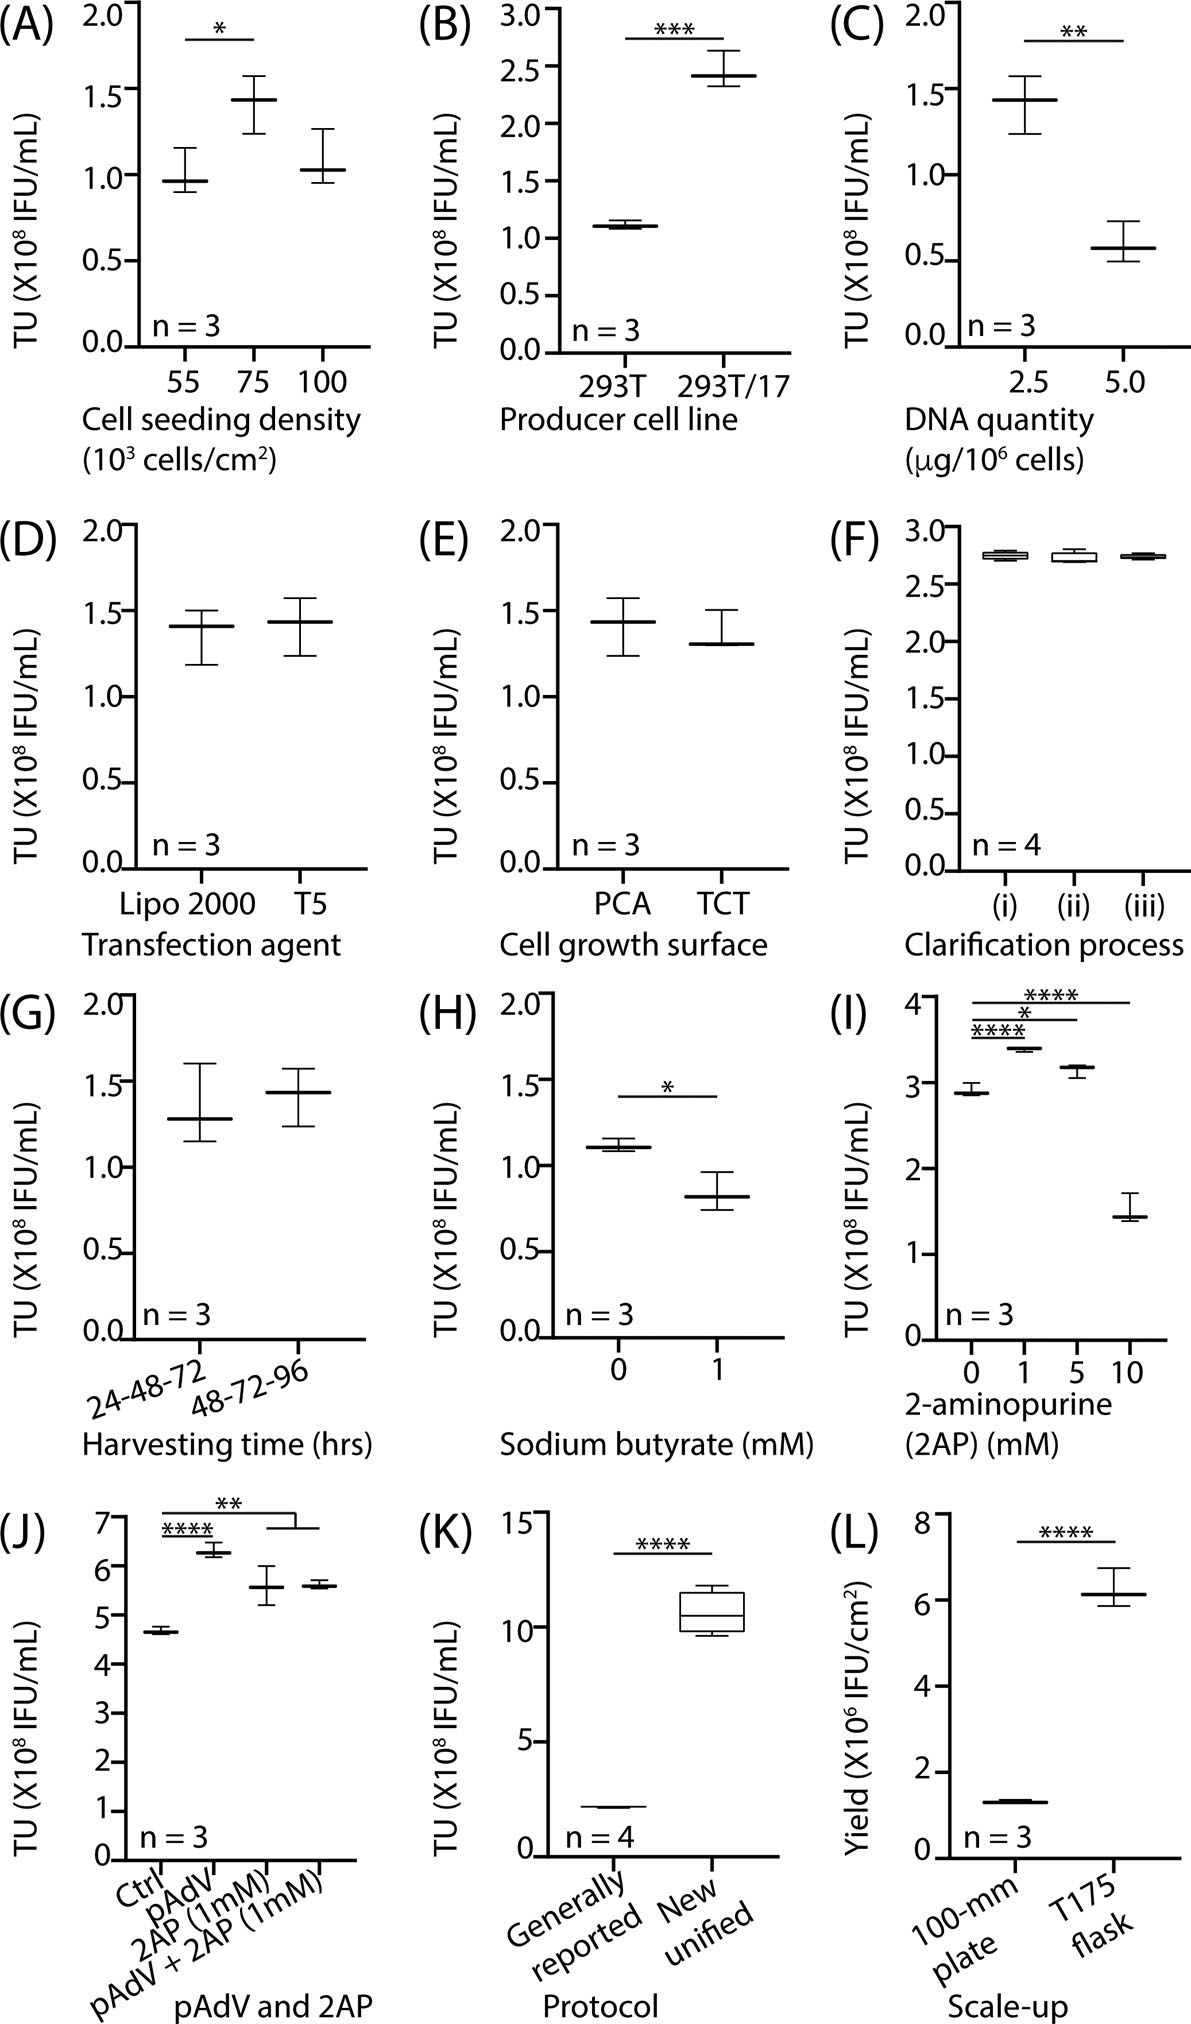
Various factors associated with the lentivirus production were compared and quantified using Lenti-X™ p24 Rapid titer ELISA. As per a previous report (see Ref.[11]) and manufacturer’s instructions, total lentivirus particles were normalized to Infectious Units (IFU) using the ratio of 1 IFU for every 100 lentivirus particles. Effect of (A) producer cell seeding densities; (B) types of producer cell lines; (C) DNA quantities used for the transfection; (D) types of transfection reagents; (E) types of cell growth surfaces; (F) types of supernatant clarification processes; (G) supernatant harvesting times; (H) Sodium Butyrate (HDAC inhibitor); (I) 2AP (Protein Kinase R inhibitor); (J) pAdVAntange™ and its combination with 2AP. A unified protocol, based on the favorable values for the above factors, was generated and compared (K) with the generally reported protocol, that has also been used by us (see Ref.[6]). The process was scaled-up (L) from 100-mm plate (55cm2) to 175cm2 flask Note: HEK293T cell line was used as a producer cell for (A, C – E, G, H); HEK293T/17 was used as a producer cell for (F, I – L). GraphPad Prism 8.1.1 (GraphPad Software, Inc) was utilized. All data were represented on a Tukey box-and-whisker plot (n ≥ 3). Statistical analysis was performed using parametric two-tailed t-test for all comparisons involving two groups and one-way ANOVA for those comparisons involving more than two groups. *p < 0.05, **p < 0.01, ***p < 0.001 and ****p < 0.0001.
Legend: (A-L) TU: Transduction units (functional titer), (D) Lipo 2000: Lipofectamine® 2000, T5: Transporter 5™; (E) PCA: PureCoat™ Amine, TCT: Tissue culture treated; (F) (i) filtered daily (0.45 μm), (ii) filtered (0.45 μm) total harvest on the 3rd day, or (iii) centrifuged daily (500g, 10 min at 25°C) and filtered (0.45 μm) the total harvest on the 3rd day; (G) 24-48-72: supernatant harvested at 24, 48, and 72 hr, 48-72-96: supernatant harvested at 48, 72, and 96 hr; (I, J) 2AP: 2-amino purine, PKRi: Protein Kinase R inhibitor, pAdV: pAdVAntage. (A-L)
While the knowledge generated above helped in configuring the process factors, i.e. the cell seeding density and the amount of DNA, we investigated additional downstream processing factors expected to improve the lentivirus yield, namely— nature of transfection agent, nature of cell growth surface, clarification process to remove cellular debris, and time for harvesting the supernatant. Figure 2D compares Lipofectamine 2000 and Transporter 5™ as transfection agents. As reported by others[14], no significant difference was observed in terms of lentivirus titer. We selected Transporter 5™ due to its lower cost[15]. Figure 2E reports on the comparison of the two cell growth surfaces. Similar lentivirus titer was observed in both cases. Aminated surface, which maintains positive charge due to protonation of amines at pH ~7, was selected because the negatively charged producer cells are expected to more tightly adhere and reduce sluoghing[16–18].
Figure 2F compares the three clarification processes used for removing the cellular debris from the supernatant. The supernatant was harvested on 3 subsequent days post-transfection (24 hr, 48 hr, and 72 hr) and treated as follows: (i) filtered daily (0.45 μm), (ii) filtered (0.45 μm) total harvest on the 3rd day, or (iii) centrifuged daily (500g, 10 min at 25°C) and filtered (0.45 μm) the total harvest on the 3rd day. The goal was to determine the process that will have minimal loss of the lentivirus particles. No significant difference, in terms of lentivirus titer, among the three processes was observed. We decided to select the process (iii) for integration in the lentivirus generation protocol. The rationale for this choice is that centrifugation of the harvest to remove cellular debris has been reported to minimize the loss of lentivirus particles from premature clogging of filter membrane[19,20]. Figure 2G reports on the duration for which producer cells were allowed to generate the lentiviral particles. Based on the previous reports transiently transfected genes exhibit highest expression between 60 and 72 hrs post-transfection[21,22]. Thus, we compared the supernatant harvested at 24-48-72 hrs with that harvested at 48-72-96 hrs. No significant difference was observed. Due to shorter process duration, i.e. 72 hrs v/s 96 hrs, we used the supernatant harvesting time of 24-48-72 hrs for all future experiments.
Subsequently, we explored chemical agents that offer the potential to improve lentivirus titer by intervening with the intracellular signaling. Figure 2H shows the effect of a well-known histone deacetylase (HDAC) inhibitor, sodium butyrate. Lentivirus titer however reduced by 25% when 1 mM sodium butyrate was added to the cell culture. This is not unexpected as similar observations have been reported by others[13,23]. HDAC inhibitors are expected to increase the lentivirus production by preventing DNA compaction that may improve promoter accessibility. However, sodium butyrate was empirically found to be effective only when calcium phosphate was used as the transfection reagent[24]. Figure 2I compares the effect of different concentrations of 2-aminopurine (2AP), a protein kinase R (PKR) inhibitor. A statistically significant benefit was observed for upto 5 mM addition of 2AP beyond which the lentivirus titer reduced.
Figure 2J shows 0.1 μg/106 cells pAdVAntage™ (pAdV) (Promega) Vector, when added to the total of previously optimized 2.5 μg/106 cells DNA cocktail, statistically significantly increases the lentivirus production. The pAdV encodes for the two virus associated RNA genes (VAI and VAII), transcription products of which bind to PKR, a dsRNA-activated inhibitor. The dsRNA activated PKR signaling is a part of cell’s intracellular antiviral response and diminishes virus production by inhibiting translation elongation factor, elf-2[25]; which eventually blocks the translation[26,27] of proteins responsible for viral capsid synthesis and with viral component encapsulation[28]. Based on these observations, we explored the cumulative effect of 2AP and pAdV. The results are shown in Figure 2J when pAdV (0.1 μg/106 cells) was added during the transfection and 2AP (1 mM) was added to the cell culture media. Negative controls included (i) none of the two additives, (ii) 0.1 μg/106 cells pAdV added to the DNA cocktail without 2AP in the media, (iii) 1 mM 2AP added to the media without pAdV in the DNA cocktail. We selected pAdV for our lentivirus manufacturing process because our tests indicated a higher titer with pAdV when compared to other samples.
A unified protocol was finally generated and the results are presented in Figure 2K. A ~4.8-fold increase in the titer over a generally reported protocol, also used in our previous work[6], was observed. To demonstrate the scalability of the process, that will also be relevant in phase I/II trials, we translated the lentivirus production process to T175 flask. The T175 has the surface area of 175 cm2, which is ~3.2-fold larger than that offered by a 100-mm cell culture dish (area= 55 cm2). All other factors, i.e. DNA quantity, media, etc., were therefore scaled up by 3.2-fold. The results are shown in Figure 2L and demonstrate ~3.7-fold increase in lentivirus yield per cm2 of the growth surface.
Figure 3 illustrates the application of two different lentivirus vectors (Figure 3A) for generating two different Effector cells (1) FRα-CAR T cells, and (2) FRα-specific T-cell Biofactory cells; both of which can also be redirected to other cell-surface antigens and has been shown in our previous work[6,29]. The lentivirus vectors, shown in Figure 3A(i) was first used to understand transduction in immortalized cell lines (HEK293T cells, Jurkat clone E6–1 cells). This has been presented in Figure 3B and was instrumental in developing the transduction procedure for primary T cells. The final process achieved ~50% HEK293T transduction efficiency at the MOI of 19, which was ~4.5-fold higher than the transduction observed in Jurkat clone E6–1 cells and has also been reported by others[30,31].
Figure 3. Functional evaluation and applications of lentivirus vectors.
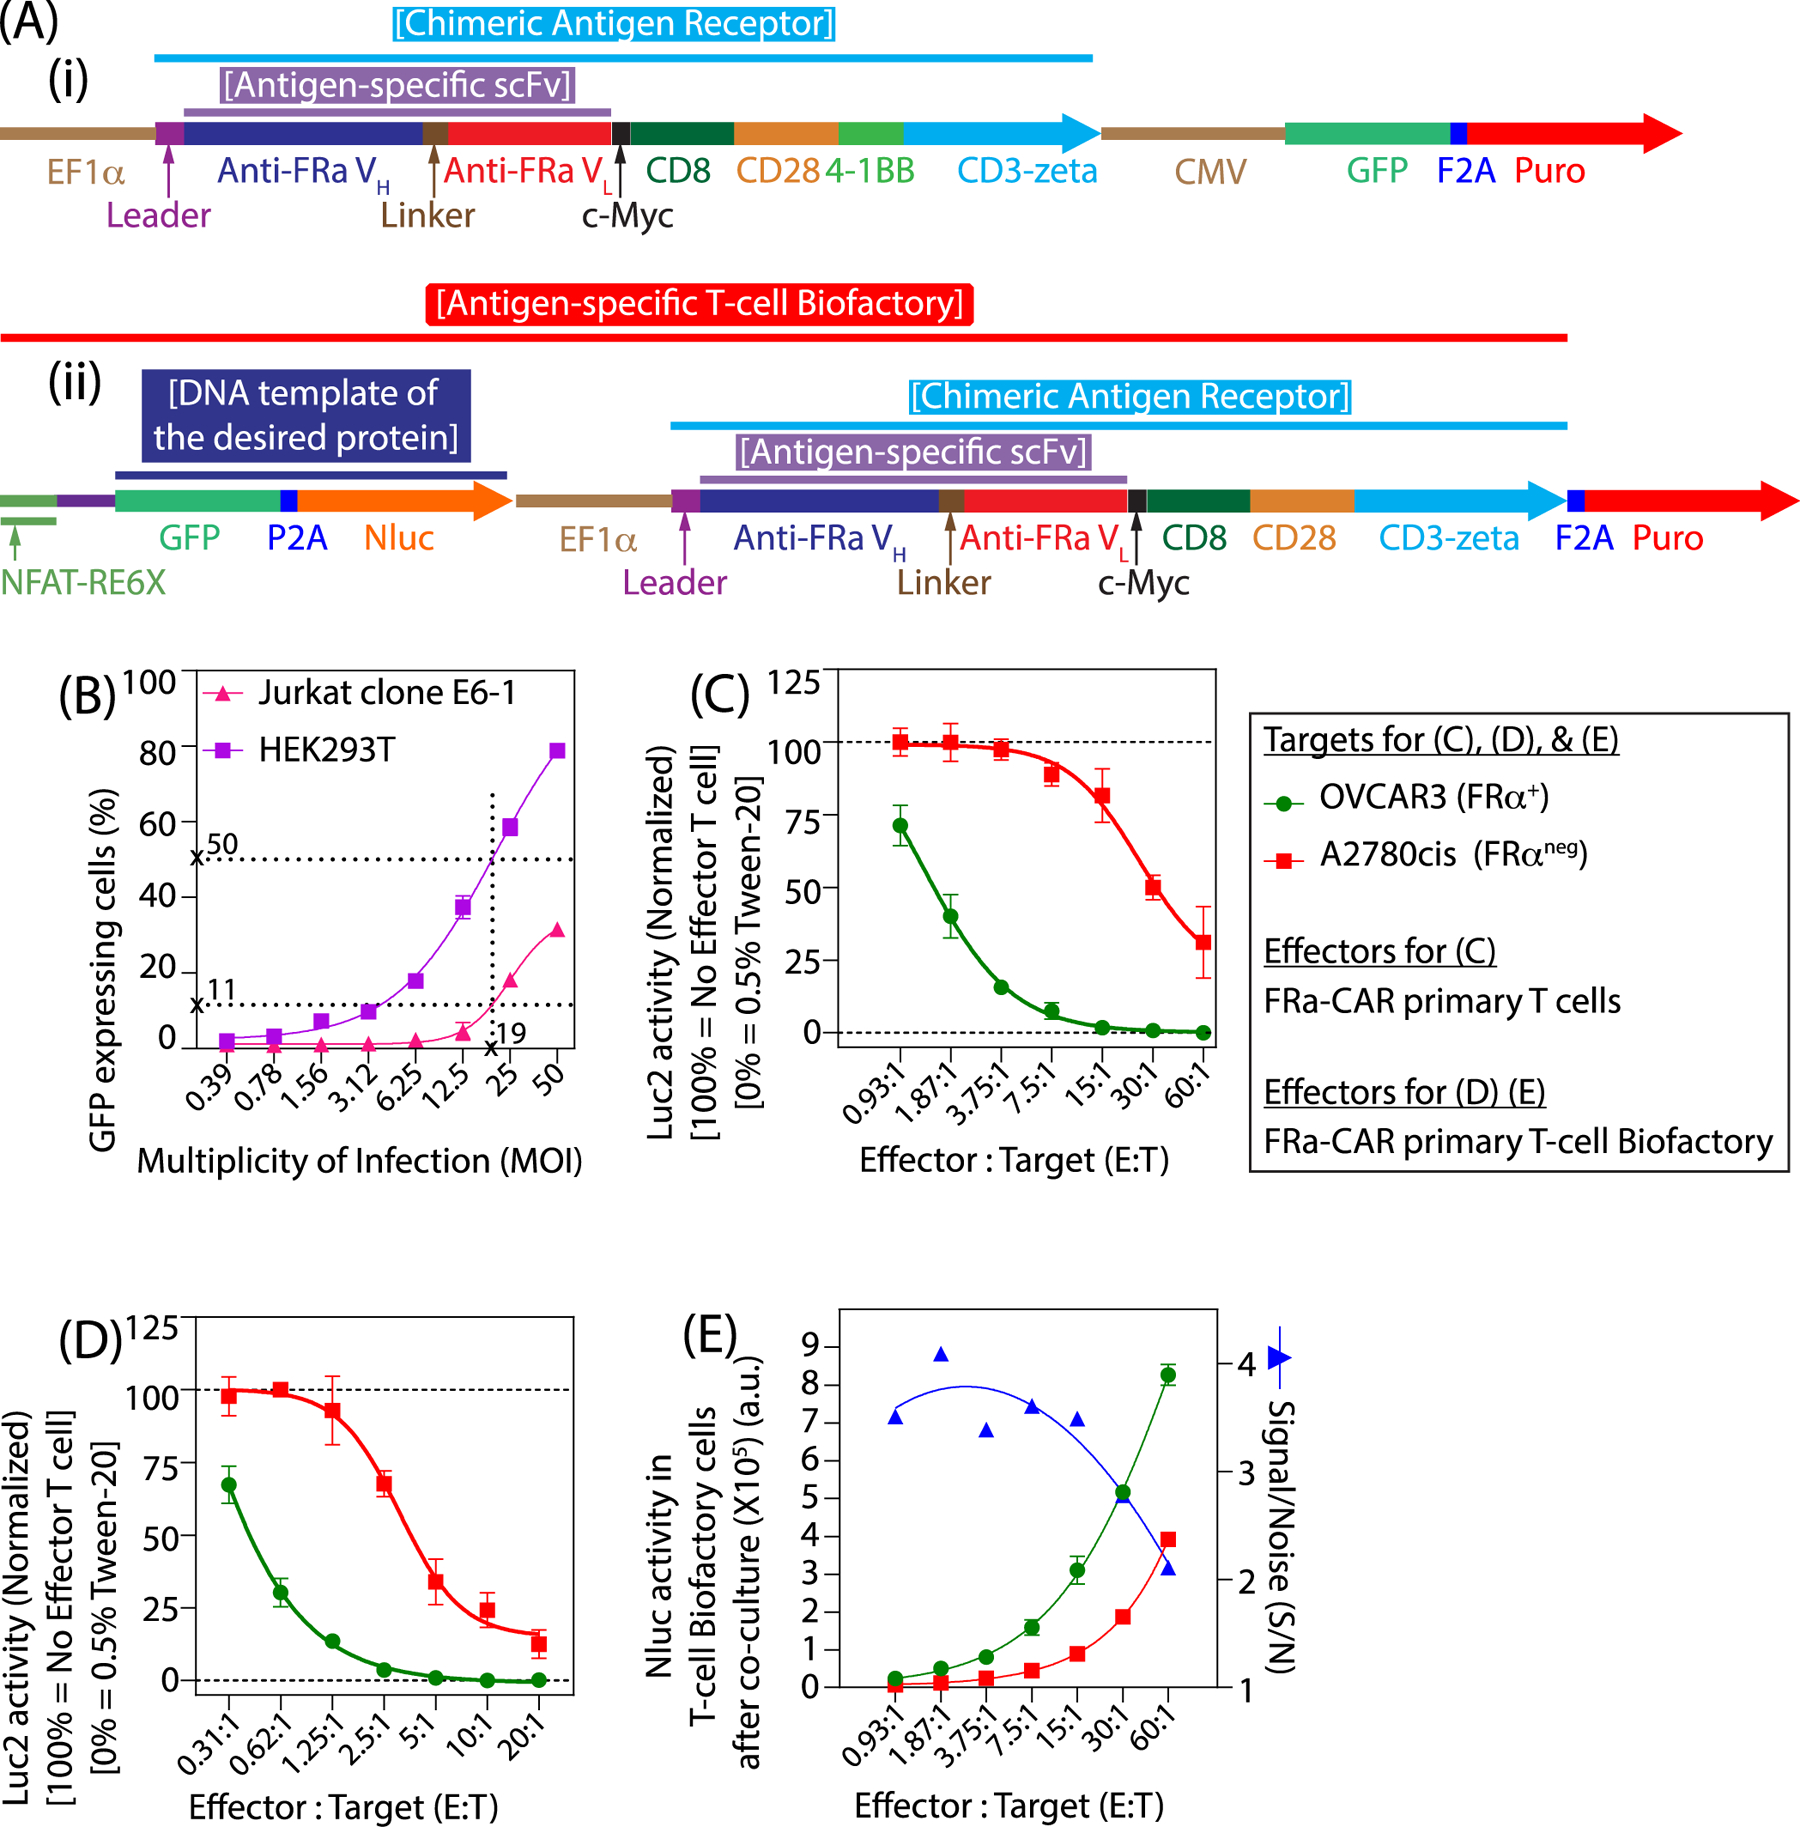
(A) Schematics of the plasmid constructs used to generate the two lentivirus vectors for (i) FRα-CAR T cells, and (ii) FRα-specific T-cell Biofactory cells; both of which can also be redirected to other cell-surface antigens. (B) Transduction efficiency of the lentivirus particles was calculated by assessing the GFP expression in HEK293T and acute T leukemia cell line (Jurkat clone E6–1) transduced at various Multiplicity of Infection (MOI). Target-specific cytolytic activities of (C) primary FRα-CAR+ T cells and (D) primary FRα-specific T-cell Biofactory were calculated by assessing the reduction in Luc2 activity in a co-culture with Luc2 expressing OVCAR3 (FRα+) or A2780cis (FRαneg) cell lines. (C, D) Luc2 activity were fit using a four-parameter logistic model, Activity = Activitymin + {Activitymax − Activitymin}/{1+10^ [b* (log10[η(E:T)50] − X)]}. (E) Target-specific engineered function of synthesizing the desired protein from the primary FRα-specific T-cell Biofactory was calculated by assessing the Nluc activity from the T-cell Biofactory cells in a co-culture with OVCAR3 (FRα+) or A2780cis (FRαneg) cell lines. The Nluc activity were fit using a four-parameter logistic model, Activity = Activitymin + {Activitymax – Activitymin}/ {1+10^ [b* (log10[η(E:T)50] – X)]}. (C-E) X is the log10 of the number of Effector T cells (primary FRα-CAR+ T cells or primary FRα-specific T-cell Biofactory cells), Activitymax is an estimated parameter defining an upper asymptote for the reporter activity, Activitymin is an estimated parameter defining a lower asymptote for the reporter activity, b is a “Hill” parameter defining the slope at the inflection point of the fitted curve, and η(E:T)50 is an estimated E:T value corresponding to (Activitymax – Activitymin)/2. The error bars are 1 standard deviation above and below the mean and can also be considered as one half-width of an 68% confidence interval for that mean. The specificity of T-cell Biofactory was plotted as the signal-to-noise ratio (S/N) and was calculated as the ratio of the mean Nluc activity in primary T-cell Biofactory cells when stimulated by the FRα+ OVCAR3 cells and the mean Nluc activity when stimulated by the FRαneg A2780cis cells. The specificity (S/N) data were fit using second order polynomial equation, Y = a + b*X + C*X^2, where X is the log10 of the number of T cell Biofactory cells. Statistical analysis to determine p-values was performed using Two-stage linear step-up procedure of Benjamini, Krieger, and Yekutieli at each E:T with a false discovery rate of less than 1%. GraphPad Prism 8.1.1 (GraphPad Software, Inc) was utilized.
Figure 3C shows the cytolytic activity of the FRα-CAR T cells, generated using lentivirus vectors shown in Figure 3A(i), towards their FRα+ OVCAR3 (Target) cells, which was statistically significantly higher (p < 0.005 at all Effector-to-Target ratios (E:T) below 60:1) compared to that against FRαneg A2780cis (Non-Target) cells. A parameter for defining the target-specific cytolytic efficiency, η(E:T)50, was determined as the E:T at which Luc2 activity (a surrogate biomarker for live cells) in Target or Non-Target cells was 50% of the difference between the maximum and minimum values of their respective normalized Luc2 activities, when co-cultured with the Effector cells for 48 hrs. The η(E:T)50 of FRαneg A2780cis cells (25:1) was ~20-fold higher than that of the FRα+ OVCAR3 cells (1.25:1). Target-specific cytolytic activity of the FRα-CAR T cells was found to be favorable at lower E:T, an observation that has also been made by others in context of CD19-CAR T cells[32].
Figure 3D reports similar findings from the FRα-specific T-cell Biofactory cells, generated using lentivirus vectors shown in Figure 3A(ii). The cytolytic activity was again statistically significantly higher (p < 0.005 at all E:T below 20:1) when co-cultured with FRα+ OVCAR3 (Target) cells, compared to FRαneg A2780cis (Non-Target) cells. η(E:T)50 for A2780cis non-target cells (6:1) was ~25-fold higher than that of the OVCAR3 target cells (0.25:1); and target-specific cytolytic activity was again found to be favorable at lower E:T. Finally, the T-cell Biofactory cells also performed their engineered function of directed synthesis of non-human proteins upon engaging their target cells. Figure 3E shows that upon stimulation by the FRα+ OVCAR3 cells, the FRα-specific T-cell Biofactory cells synthesized a luciferase-based reporter enzyme (NanoLuc® (Nluc®)), which was statistically significantly higher (p < 0.005 at all E:T) compared to when stimulated by the FRαneg A2780cis cells. Signal-to-noise ratio (S/N), a parameter that defines target-specificity, was calculated as the ratio of Nluc activity when the FRα-specific T-cell Biofactory cells were stimulated by the FRα+ OVCAR3 target cells to when stimulated by the FRαneg A2780cis non-target cells. The S/N was found to be favourable at lower effector-to-target cell ratios. Based on the detailed experiments conducted with A2780cis and described previously[6,33], we are able to rule out allorecognition as the major contributor of the engineered T cell activities.
5.0. Discussion
Current advances in cell therapies[34] have led to new approvals by the U.S. Food and Drug Administration (FDA)[35]. While the lentivirus vectors are considered to be the fundamental building blocks[7,8], the lack of a robust manufacturing technology continues to impede the translation of many such life-saving cell-based drugs[10,36,37]. In this work, we have closed this gap by introducing a process that was used to reproducibly manufacture lentivirus vector with a functional titer of ~108 IFU/mL from a single 100-mm cell culture dish (area= 55 cm2). The technology is cGMP compliant and can thus be used for Phase I/II trials. Towards this goal and as a proof-of-concept, we scaled up the lentivirus manufacturing process in T175 flask (area= 175 cm2) and used them to generate the functional antigen-specific T-cell Biofactory cells.
The significance of the T-cell Biofactory platform stems from its (1) innate capability for cellular resolution, i.e. the T cells chemotactically extravasate to disease sites; and (2) engineered modularity that, as demonstrated by us[6,29], can be reprogrammed for (i) targeting different diseases with molecular specificity, as well as (ii) calibrated synthesis of human or non-human proteins with desired functions. Proportionate synthesis of biologics for targeting various diseases therefore offers the promise of circumventing passive diffusion of excessively infused biologics and limit the damage to normal tissues.
Supplementary Material
6.0. Acknowledgements
Research reported in this publication was supported in part by the National Institute of Biomedical Imaging and Bioengineering (DP2EB024245) and the National Cancer Institute (R21CA236640) of the National Institutes of Health (NIH); and the Defense Advanced Research Projects Agency (DARPA) (D19AP00024). The content is solely the responsibility of the authors and does not necessarily represent the official views of the NIH or DARPA. Part of this work was funded by through the NIH Director’s New Innovator Award Program (https://commonfund.nih.gov/newinnovator), grant number DP2EB024245; and DARPA Young Faculty Award (https://www.darpa.mil/work-with-us/for-universities/young-faculty-award), grant number D19AP00024. Authors thank Didier Trono (Ecole Polytechnique Fédérale de Lausanne (EPFL), Lausanne, Switzerland) for providing the lentivirus packaging plasmids. PB thanks Michael Kershaw (Peter MacCallum Cancer Centre, Melbourne, Australia); and Dario Campana (National University of Singapore, Singapore) for helpful discussions.
Footnotes
Competing financial interests. The authors declare no competing financial interests.
Experimental section.
10.0 References
- 1.Ornstein MC & Rini BI (2016) Pharmacokinetically-guided dosing of oral drugs: true precision oncology? Clinical Cancer Research:clincanres.1833.2016. [DOI] [PubMed] [Google Scholar]
- 2.Schmidinger M, Danesi R, Jones R, McDermott R, Pyle L, Rini B, & Négrier S (2018) Individualized dosing with axitinib: rationale and practical guidance. Future Oncology 14(9):861–875. [DOI] [PubMed] [Google Scholar]
- 3.Mathijssen RHJ, de Jong FA, Loos WJ, van der Bol JM, Verweij J, & Sparreboom A (2007) Flat-Fixed Dosing Versus Body Surface Area–Based Dosing of Anticancer Drugs in Adults: Does It Make a Difference? The Oncologist 12(8):913–923. [DOI] [PubMed] [Google Scholar]
- 4.Deeken JF, Figg WD, Bates SE, & Sparreboom A (2007) Toward individualized treatment: prediction of anticancer drug disposition and toxicity with pharmacogenetics. Anti-Cancer Drugs 18(2):111–126. [DOI] [PubMed] [Google Scholar]
- 5.Baker SD, Verweij J, Rowinsky EK, Donehower RC, Schellens JHM, Grochow LB, & Sparreboom A (2002) Role of Body Surface Area in Dosing of Investigational Anticancer Agents in Adults, 1991–2001. JNCI: Journal of the National Cancer Institute 94(24):1883–1888. [DOI] [PubMed] [Google Scholar]
- 6.Repellin CE, Patel P, Beviglia L, Javitz H, Sambucetti L, & Bhatnagar P (2018) Modular Antigen-Specific T-cell Biofactories for Calibrated In Vivo Synthesis of Engineered Proteins. Adv. Biosys 2(12):1800210. [DOI] [PMC free article] [PubMed] [Google Scholar]
- 7.Levine BL, Miskin J, Wonnacott K, & Keir C (2017) Global Manufacturing of CAR T Cell Therapy. Molecular Therapy - Methods & Clinical Development 4:92–101. [DOI] [PMC free article] [PubMed] [Google Scholar]
- 8.Wang X & Rivière I (2016) Clinical manufacturing of CAR T cells: foundation of a promising therapy. Molecular Therapy - Oncolytics 3. [DOI] [PMC free article] [PubMed] [Google Scholar]
- 9.Haddock R, Lin-Gibson S, Lumelsky N, McFarland R, Roy K, Saha K, Zhang J, & Zylberberg C (2017) Manufacturing Cell Therapies: The Paradigm Shift in Health Care of this Century. NAM Perspectives. [Google Scholar]
- 10.Aijaz A, Li M, Smith D, Khong D, LeBlon C, Fenton OS, Olabisi RM, Libutti S, Tischfield J, Maus MV, Deans R, Barcia RN, Anderson DG, Ritz J, Preti R, & Parekkadan B (2018) Biomanufacturing for clinically advanced cell therapies. Nature Biomedical Engineering 2(6):362–376. [DOI] [PMC free article] [PubMed] [Google Scholar]
- 11.Tiscornia G, Singer O, & Verma IM (2006) Production and purification of lentiviral vectors. Nature Protocols 1(1):241–245. [DOI] [PubMed] [Google Scholar]
- 12.Pear WS, Nolan GP, Scott ML, & Baltimore D (1993) Production of high-titer helper-free retroviruses by transient transfection. Proceedings of the National Academy of Sciences 90(18):8392–8396. [DOI] [PMC free article] [PubMed] [Google Scholar]
- 13.Merten O-W, Hebben M, & Bovolenta C (2016) Production of lentiviral vectors. Molecular Therapy - Methods & Clinical Development 3. [DOI] [PMC free article] [PubMed] [Google Scholar]
- 14.Maurisse R, De Semir D, Emamekhoo H, Bedayat B, Abdolmohammadi A, Parsi H, & Gruenert DC (2010) Comparative transfection of DNA into primary and transformed mammalian cells from different lineages. BMC Biotechnology 10(1):9. [DOI] [PMC free article] [PubMed] [Google Scholar]
- 15.Michael Sandbichler Adolf, Aschberger Teresa, & Pelster B (2013) A Method to Evaluate the Efficiency of Transfection Reagents in an Adherent Zebrafish Cell Line. BioResearch Open Access 2(1):20–27. [DOI] [PMC free article] [PubMed] [Google Scholar]
- 16.Štrbková L, Manakhov A, Zajíčková L, Stoica A, Veselý P, & Chmelík R (2016) The adhesion of normal human dermal fibroblasts to the cyclopropylamine plasma polymers studied by holographic microscopy. Surface and Coatings Technology 295:70–77. [Google Scholar]
- 17.Lee JH, Jung HW, Kang I-K, & Lee HB (1994) Cell behaviour on polymer surfaces with different functional groups. Biomaterials 15(9):705–711. [DOI] [PubMed] [Google Scholar]
- 18.Lee JH, Lee JW, Khang G, & Lee HB (1997) Interaction of cells on chargeable functional group gradient surfaces. Biomaterials 18(4):351–358. [DOI] [PubMed] [Google Scholar]
- 19.Rodrigues T, Carvalho A, Carmo M, Carrondo MJT, Alves PM, & Cruz PE (2007) Scaleable purification process for gene therapy retroviral vectors. The Journal of Gene Medicine 9(4):233–243. [DOI] [PubMed] [Google Scholar]
- 20.Segura MM, Mangion M, Gaillet B, & Garnier A (2013) New developments in lentiviral vector design, production and purification. Expert Opinion on Biological Therapy 13(7):987–1011. [DOI] [PubMed] [Google Scholar]
- 21.de los Milagros Bassani Molinas Maria, Beer Christiane, Hesse Friedemann, Wirth Manfred, & Wagner R (2014) Optimizing the transient transfection process of HEK-293 suspension cells for protein production by nucleotide ratio monitoring. Cytotechnology 66. [DOI] [PMC free article] [PubMed] [Google Scholar]
- 22.Ausubel LJ, Hall C, Sharma A, Shakeley R, Lopez P, Quezada V, Couture S, Laderman K, McMahon R, Huang P, Hsu D, & Couture L (2012) Production of CGMP-Grade Lentiviral Vectors. Bioprocess Int 10(2):32–43. [PMC free article] [PubMed] [Google Scholar]
- 23.Sena-Esteves M, Tebbets JC, Steffens S, Crombleholme T, & Flake AW (2004) Optimized large-scale production of high titer lentivirus vector pseudotypes. Journal of Virological Methods 122(2):131–139. [DOI] [PubMed] [Google Scholar]
- 24.Cribbs AP, Kennedy A, Gregory B, & Brennan FM (2013) Simplified production and concentration of lentiviral vectors to achieve high transduction in primary human T cells. BMC Biotechnology 13(1):98. [DOI] [PMC free article] [PubMed] [Google Scholar]
- 25.Farrell PJ, Balkow K, Hunt T, Jackson RJ, & Trachsel H (1977) Phosphorylation of initiation factor eIF-2 and the control of reticulocyte protein synthesis. Cell 11(1):187–200. [DOI] [PubMed] [Google Scholar]
- 26.Kitajewski J, Schneider RJ, Safer B, Munemitsu SM, Samuel CE, Thimmappaya B, & Shenk T (1986) Adenovirus VAI RNA antagonizes the antiviral action of interferon by preventing activation of the interferon-induced eIF-2alpha kinase. Cell 45(2):195–200. [DOI] [PubMed] [Google Scholar]
- 27.O’Malley RP, Mariano TM, Siekierka J, & Mathews MB (1986) A mechanism for the control of protein synthesis by adenovirus VA RNAI. Cell 44(3):391–400. [DOI] [PubMed] [Google Scholar]
- 28.Clemens Michael J. & Elia A (1997) The Double-Stranded RNA-Dependent Protein Kinase PKR: Structure and Function. Journal of Interferon & Cytokine Research 17(9):503–524. [DOI] [PubMed] [Google Scholar]
- 29.Repellin CE, Ganesan P, Fernandez-Alcudia J, Patel P, Beviglia L, Javitz H, Sambucetti L, & Bhatnagar P (2019) Artificial cell-line triad to validate therapeutic T cells engineered for antigen specificity. Advanced Biosystems (in Press). [Google Scholar]
- 30.Abbasalipour M, Khosravi MA, Zeinali S, Khanahmad H, Karimipoor M, & Azadmanesh K (2019) Improvement of K562 Cell Line Transduction by FBS Mediated Attachment to the Cell Culture Plate. BioMed Research International 2019:6. [DOI] [PMC free article] [PubMed] [Google Scholar]
- 31.Kahl CA, Pollok K, Haneline LS, & Cornetta K (2005) Lentiviral vectors pseudotyped with glycoproteins from Ross River and vesicular stomatitis viruses: variable transduction related to cell type and culture conditions. Molecular Therapy 11(3):470–482. [DOI] [PubMed] [Google Scholar]
- 32.Cerignoli F, Abassi YA, Lamarche BJ, Guenther G, Santa Ana D, Guimet D, Zhang W, Zhang J, & Xi B (2018) In vitro immunotherapy potency assays using real-time cell analysis. PLOS ONE 13(3):e0193498. [DOI] [PMC free article] [PubMed] [Google Scholar]
- 33.Repellin CE, Ganesan P, Alcudia JF, Lakshmireddy HKD, Patel P, Beviglia L, Javitz HS, Sambucetti L, & Bhatnagar P (2020) Engineered Ovarian Cancer Cell Lines for Validation of CAR T Cell Function. Adv. Biosys 4(1):1900224. [DOI] [PMC free article] [PubMed] [Google Scholar]
- 34.Fischbach MA, Bluestone JA, & Lim WA (2013) Cell-Based Therapeutics: The Next Pillar of Medicine. Science Translational Medicine 5(179):179ps177–179ps177. [DOI] [PMC free article] [PubMed] [Google Scholar]
- 35.Chavez JC, Bachmeier C, & Kharfan-Dabaja MA (2019) CAR T-cell therapy for B-cell lymphomas: clinical trial results of available products. Ther Adv Hematol 10:2040620719841581–2040620719841581. [DOI] [PMC free article] [PubMed] [Google Scholar]
- 36.Au P, Hursh DA, Lim A, Moos MC, Oh SS, Schneider BS, & Witten CM (2012) FDA Oversight of Cell Therapy Clinical Trials. Science Translational Medicine 4(149):149fs131–149fs131. [DOI] [PubMed] [Google Scholar]
- 37.Culme-Seymour EJ, Davie NL, Brindley DA, Edwards-Parton S, & Mason C (2012) A decade of cell therapy clinical trials (2000–2010). Regenerative Medicine 7(4):455–462. [DOI] [PubMed] [Google Scholar]
Associated Data
This section collects any data citations, data availability statements, or supplementary materials included in this article.