

Abstract
Purpose of review:
Magnetic resonance spectroscopy (MRS) may play a key role for the management of patients with glioma. We highlighted the utility of MRS in the noninvasive diagnosis of gliomas with mutations in isocitrate dehydrogenase (IDH) genes, by providing an overview of the neurochemical alterations observed in different glioma subtypes, as well as during treatment and progression, both in vivo and ex vivo.
Recent findings:
2-hydroxyglutarate (2HG) decrease during anti-cancer treatments was recently shown to be associated with altered levels of other metabolites, including lactate, glutamate and glutathione, suggesting that tumor treatment leads to a metabolic reprogramming beyond 2HG depletion. In combination with 2HG quantification, cystathionine and glycine seem to be the most promising candidates for higher specific identification of glioma sub-types and follow-up of disease progression and response to treatment.
Summary:
The implementation of advanced MRS methods in the routine clinical practice will allow the quantification of metabolites that are not detectable with conventional methods and may enable immediate, accurate diagnosis of gliomas, which is crucial for planning optimal therapeutic strategies and follow-up examinations. The role of different metabolites as predictors of patient outcome still needs to be elucidated.
Keywords: IDH mutation, glioma, brain metabolites, treatment effect, progression
Introduction
In 2009, mutations of the genes encoding the enzymes isocitrate dehydrogenase 1 and 2 (IDH1/2) were discovered in gliomas [1]. IDH mutations are found in ~90% of diffuse grade II and 60% of diffuse grade III gliomas, 5% of primary glioblastomas (GBM), and are absent in other brain tumors [2]. IDH-mutated gliomas form a biologically independent subset of tumors associated with a 2- to 4-fold longer median survival compared to wild-type (WT) tumors [3]. Own to its high diagnostic and prognostic value, IDH mutational status was integrated into the 2016 World Health Organization classification of gliomas [4]. Diffuse glioma classification requires histologic evaluation and assessment of the IDH mutational status and codeletion status of chromosomal arms 1p and 19q (1p/19q codeletion) [5]. 1p/19q codeletion is found only in IDH-mutated gliomas, is linked with the oligodendroglial histologic subtype, and is associated with the best prognosis. IDH-mutated 1p/19q-non-codeleted gliomas are classified as diffuse astrocytomas and are associated with intermediate outcome, while IDH-WT have the poorest prognosis [2].
Magnetic resonance imaging (MRI) plays a vital role in the diagnosis and management of patients with brain tumors [6**]. Among different MRI modalities, in vivo 1H MR spectroscopy (MRS) provides unique metabolic information through the measurement of the neurochemical concentrations in tissue.
The aim of this review is to provide an overview of the metabolic alterations observed in different glioma subtypes both in vivo and ex vivo, and to highlight the possible role of 1H MRS in the noninvasive diagnosis of IDH-mutated gliomas, as well as in monitoring the effect of tumor progression and anti-cancer treatments on the neurochemical profile.
D-2-hydroxyglutarate
IDH mutations result in the overproduction of D-2-hydroxyglutarate (2HG) (Figure 1) and have been suggested to cause changes in global cellular metabolism, either in consequence of increased 2HG or through inhibition of isocitrate metabolism [7]. In vivo MRS enables the noninvasive detection of 2HG, potentially providing a great impact on patient management.
Figure 1: Schematic diagram of the 2HG metabolic pathway.
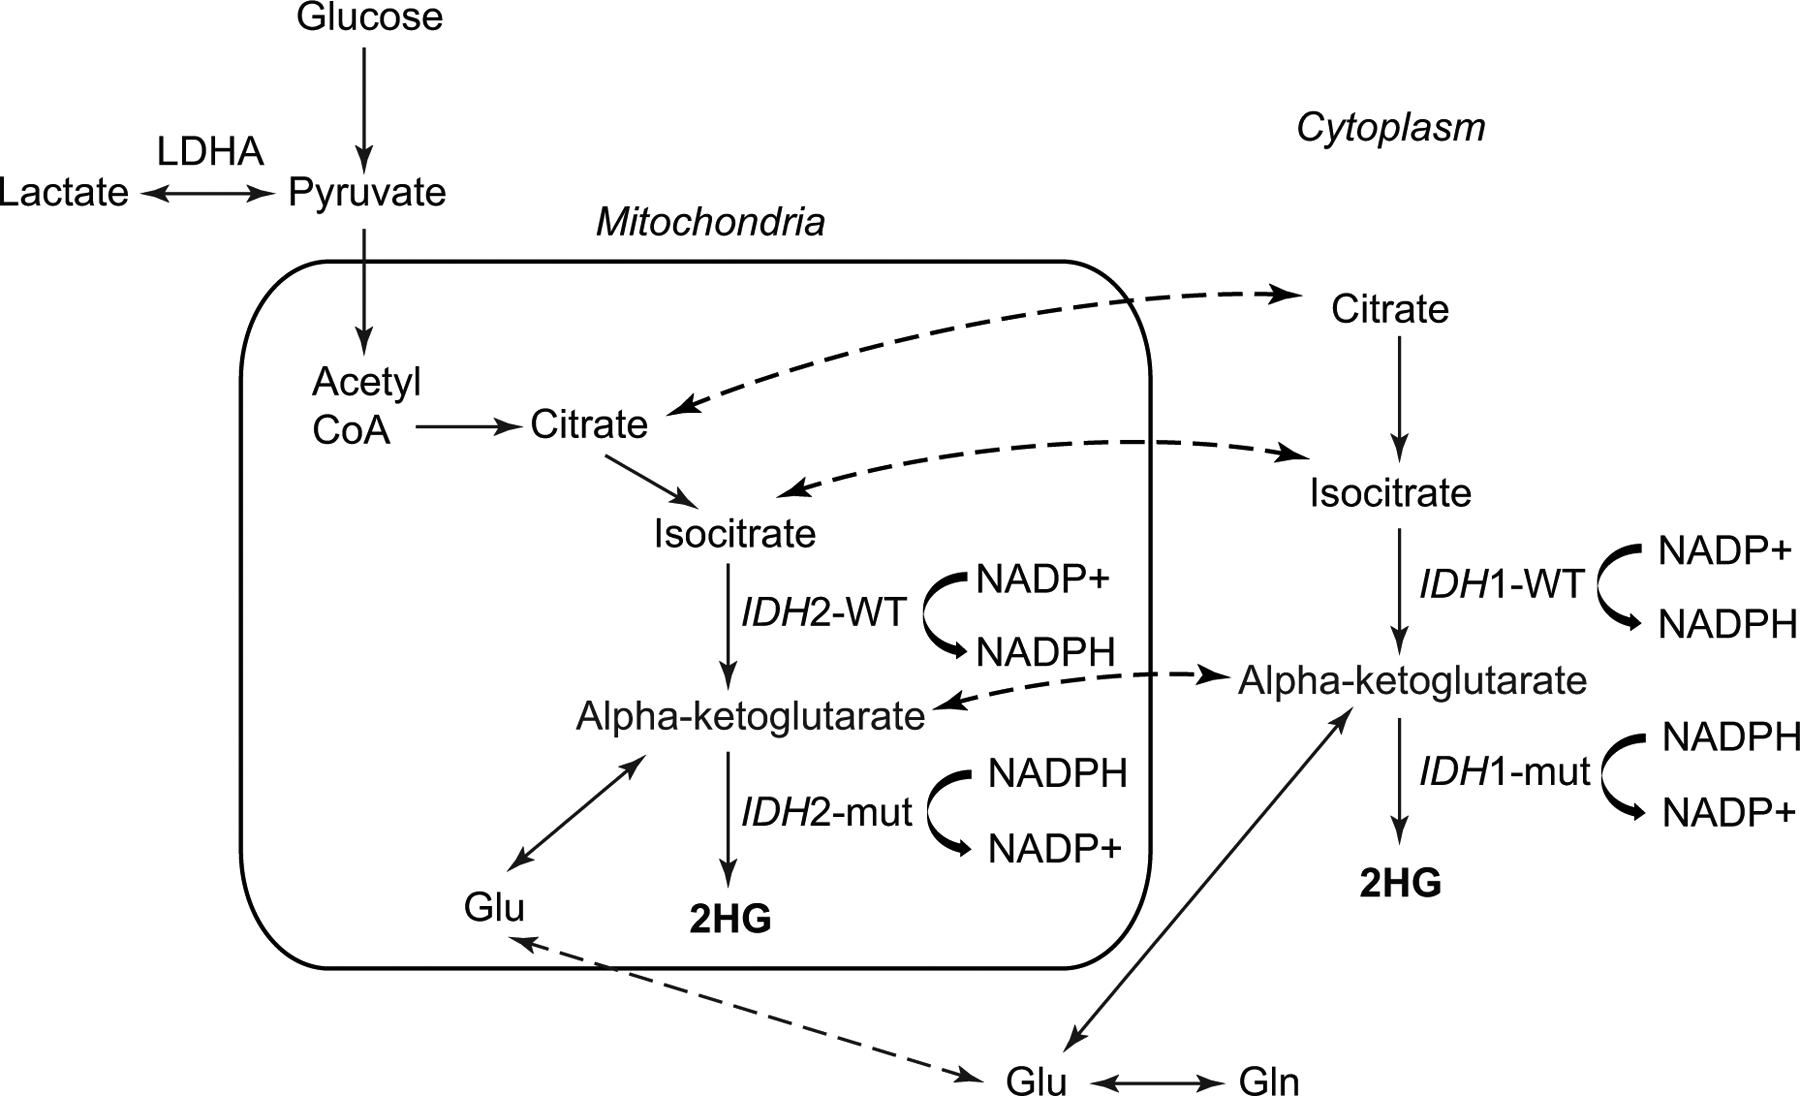
Illustration of IDH function change with cytosolic IDH1 and mitochondrial IDH2 mutations. IDH1 and IDH2 mutations do not occur at the same time. Dashed arrows indicate exchange of a metabolite between the mitochondria and the cytosol. Schematic based on previous publication [7].
2HG: 2-hydroxyglutarate; Glu: glutamate; Gln: glutamine; LDHA: lactate dehydrogenase A; NADP+: nicotinamide adenine dinucleotide phosphate; NADPH: nicotinamide adenine dinucleotide phosphate (reduced form); mut: mutated; WT: wild-type.
Clinical relevance
Noninvasive 2HG detection by MRS is a powerful tool for immediate, pre-surgical diagnosis of IDH-mutated gliomas. Indeed, 2HG MRS allows in first place to differentiate noninvasively gliomas from metastases, primary brain lymphomas or other non-neoplastic lesions. In vivo assessment of IDH status is highly beneficial for neurosurgical planning as maximal surgical resection has been shown to confer a better prognosis in IDH-mutated gliomas compared to WT [8]. Thus, although in vivo MRS is not meant to replace surgery or biopsy, which are needed for histological confirmation of the IDH status and assessment of the tumor genetic profile, pre-operative MRS would be extremely useful as part of the clinical routine practice as noninvasive identification of IDH mutation may influence surgical decision-making regarding the extent of the resection. Moreover, 2HG quantification may be useful for the identification of minor IDH mutations undetectable by immunohistochemistry, given that DNA sequencing is not available in all clinical centers. 2HG may also serve as a biomarker of IDH mutation if surgery is not feasible or associated with high risk, and as a marker of treatment efficacy, treatment response, and tumor progression, especially when evaluation based on other imaging methods is inconclusive, assisting clinicians in the choice of the best therapeutic strategy.
In vivo MRS methods
Since 2012, several in vivo 1H MRS methods have been proposed for 2HG detection [9,10,11**]. These can be grouped into three types: short echo-time (TE) MRS [12]; long-TE MRS optimized for 2HG detection [13,14]; edited MRS [15,16*]. Examples of spectra acquired with these three methods have been shown previously [9].
Short-TE (TE = 30 ms) MRS is typically performed using the point resolved spectroscopy (PRESS) sequence, available on clinical scanners. This method has been shown to produce the highest rate of false-positives, which is the worst outcome for clinical evaluation [11**]. This is because the quantification of the 2HG signal at 2.25 ppm is complicated by the presence of other signals, including metabolites, macromolecules and baseline.
Long-TE MRS optimized for 2HG detection partially removes the overlap of 2HG at 2.25 ppm with other resonances, by employing the TE that provides minimal contribution of other signals. These methods require modified sequences and are rarely available in the clinic. Optimized PRESS uses TE = 97 ms and has been shown to better quantify 2HG and reduce false-positive results compared to short-TE MRS [17]. Nevertheless, a recent study suggested that necrosis and treatment status were associated with false-positive 2HG measurements using optimized PRESS in GBM [18]. A semi-localization by adiabatic selective refocusing pulse sequence with TE = 110 ms was also proposed as alternative approach for 2HG detection at 7 T [14].
Finally, edited MRS measures the 2HG signal at 4.02 ppm by completely removing the signals from other metabolites (Figure 2) and provided no false positives in a recent prospective 3 T study [16*]. These results point towards the need of implementation of advanced MRS methods for clinical examinations.
Figure 2: In vivo detection of 2HG and cystathionine.
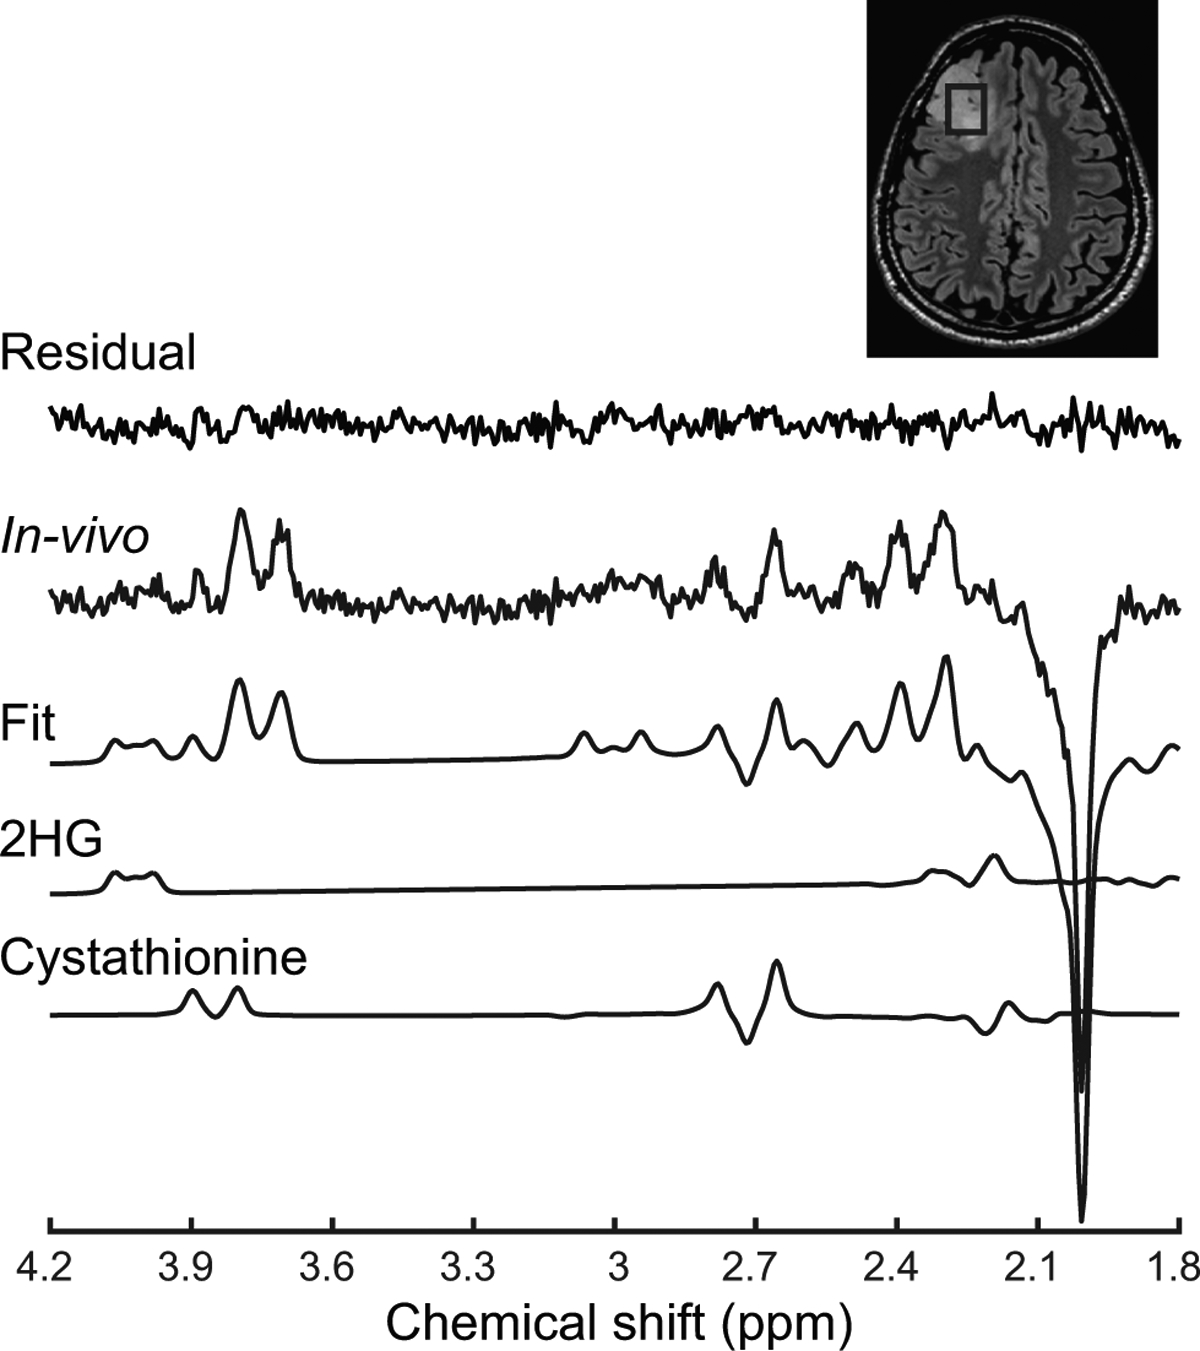
An in vivo spectrum acquired in an IDH1-mutated, 1p/19q codeleted glioma is shown together with the LCModel fit, the 2HG and cystathionine contributions, and residuals. The 2HG signal is visible at 4.02 ppm, while the cystathionine pattern is visible at 2.72 ppm. No line broadening was applied. The location and size of the VOI is shown on a FLAIR image.
2HG: D-2-hydroxyglutarate
Both single-voxel (SV) MRS and MRS imaging (MRSI) have been employed for the detection of 2HG, yet the majority of the studies employed SV MRS, own to the shorter acquisition times and the higher reproducibility of the results with respect to MRSI.
Regardless the method employed, a few studies have reported lower sensitivity and specificity in post-operative compared to pre-operative cohorts [19,20]. This could be due to technical challenges related to the presence of post-surgical cavities, size of the residual tumor or effect of previous treatments. The evaluation of the full metabolic profile may thus become crucial for follow-up examinations and evaluation of tumor progression.
Correlation with cellularity and grade
Previous reports showed that 2HG concentrations detected by MRS were positively correlated with tumor cellularity [19,21]. 2HG concentrations were also found to be significantly different between low- and high-grade, consistent with differences in tumor cellularity in different grades [21] and confirming ex vivo findings obtained using 1H high-resolution magic angle spinning (HR-MAS) spectroscopy [22]: mean ex vivo 2HG levels were shown to be significantly higher in grade IV compared to grade II gliomas. When normalized by average cellularity, 2HG levels did not differ significantly between grades II and IV, suggesting that 2HG differences between glioma grades reflect differences in cellularity [22]. Conversely, another short-TE MRS 3 T study suggested that tumor grade had a significant influence on glutamate (Glu), but not on 2HG concentration [23]. This negative result could be due to the technical challenges associated with 2HG quantification using short-TE MRS, as discussed above.
In line with these findings, a recent study reported increased ex vivo 2HG levels in gliomas undergoing malignant progression from grade III to grade IV [24]. Additionally, 2HG levels were correlated with increased mitotic activity, axonal disruption, vascular neoplasia, and with several metabolites (see section “Correlation with other metabolites”) [24]. While in vivo studies did not report significant differences in 2HG levels between different histological subtypes [21,25], elevated ex vivo 2HG levels were reported in oligodendrogliomas undergoing progression to grade III and IV compared to astrocytomas [24].
Longitudinal changes
A 2HG concentration decrease during treatment has been shown previously [21,26,27**]. A prospective longitudinal study employing SV optimized PRESS at 3 T reported stable absolute 2HG levels in untreated patients with indolent disease, while 2HG showed a marked increase at progression. In contrast, 2HG levels decreased during radio- and chemo-therapies in most patients under investigation, and the decrease during treatment was accompanied by a measurable decrease in tumor volume in almost all gliomas. 2HG concentration decreased more rapidly in oligodendrogliomas compared to astrocytomas or mixed gliomas, consistent with a better response to treatment of the first sub-type. In patients included up to 24 months after treatment, 2HG levels were very close to the detectability threshold set to 1 mM [21].
An edited 3D MRSI sequence was employed at 3 T to evaluate the effect of both standard treatments and a novel IDH1 inhibitor on 2HG levels [26,27**]. 2HG levels measured relative to total creatine (creatine + phosphocreatine, tCr) were found to decrease significantly in patients receiving adjuvant radiation and chemotherapy and correlated with clinical status. Results from a phase 1 clinical trial indicated a rapid 2HG/tCr decrease by 70% after only 1 week of treatment with a novel IDH1 inhibitor [27**].
Correlation with other metabolites
The median value of 2HG/tCr was found positively correlated with that of lactate(Lac)/tCr in pre-treatment scans, possibly resulting from the Warburg effect due to silencing of lactate dehydrogenase A (LDHA) in IDH-mutated gliomas, while it was negatively correlated with that of Glu + glutamine (Glx)/tCr in post-treatment scans, as a possible direct consequence of 2HG depletion during treatment [26]. These findings require further corroboration from larger patient cohorts. Similarly, the inhibition of IDH1 activity through a novel anti-IDH1 treatment was suggested to induce a reprogramming of tumor metabolism, showing decreased 2HG levels, reported relative to tCr quantified in healthy tissue (tCrhealthy), associated with increased Glx/tCrhealthy, glutathione (GSH)/tCrhealthy and Lac/tCrhealthy levels. The trend to an inverse correlation between 2HG/tCrhealthy and Glx/tCrhealthy in IDH-mutated gliomas after treatment suggested the 2HG/Glx ratio as a more sensitive biomarker of IDH mutation, given that Glu levels were found to be lower in IDH1-mutated compared to WT gliomas, as measured by the mass spectrometry in tumor biopsies [23]. However, the inverse correlation between 2HG and Glx in mutated gliomas has not yet been shown in vivo at baseline. Increased GSH levels after anti-IDH1 treatment may lead to a reduced sensitivity of IDH-mutated gliomas to radiotherapy, providing evidence against a benefit of simultaneous administration of IDH1 inhibitors and radiotherapy [27**]. The increase in Lac levels post-treatment were suggested to be linked with reversible downregulation of LDHA activity associated with inhibition of mutant IDH1.
A previous 1H HR-MAS experiments also reported a positive correlation between 2HG and Lac levels in IDH-mutated recurrent glioma biopsies, as well as correlations of 2HG with several other metabolites commonly associated with tumor, such as free choline (Cho), phosphocholine (PCho), glycerophosphocholine (GPC), tCho, aspartate (Asp), gamma-aminobutyric acid (GABA), threonine (Thr), hypotaurine (hTau), creatine and phosphocreatine (Cr, PCr), betaine (Bet), glycine (Gly), GSH, phosphoethanolamine (PE), Glu, and Gln. Conversely, 2HG was negatively correlated with the myo-inositol (mIns)/tCho ratio, an index associated with the relative contribution of tumor cells and treatment-induced gliosis [22]. However, these correlations have not been yet corroborated by other ex vivo or in vivo studies. Correlations between 2HG and other metabolites observed both in vivo and ex vivo are summarized in Table 1.
Table 1:
Correlations of 2HG with other metabolites
| In vivo 1H MRS | Ex vivo 1H MAS | |||
|---|---|---|---|---|
| Pre-treatment | Treatment | Recurrent tumors | ||
| RT + CT | Anti-IDH1 | |||
| Positive correlations | Lac/tCr [26] | Asp, Bet, Cho, PCho, GPC, tCho, Cr, PCr, GABA, Gln, Glu, GSH, Gly, Lac, PE, Thr, hTau [22] | ||
| Negative correlations | Glx/tCr [26] | Glx/tCrhealthy, Lac/tCrhealthy, GSH/tCrhealthy [27] | mIns/tCho [22] | |
RT: radiotheraphy; CT: chemotheraphy; Lac: lactate; tCr: total creatine; tCrhealthy : tCr measured in the contralateral healthy tissue; Glx: glutamate + glutamine; GSH: glutathione; Asp: aspartate; Bet: betaine; Cho: free choline; PCho: phosphocholine; GPC: glicerophosphocholine; tCho: total choline; PCr: phosphocreatine; GABA: gamma-aminobutyric acid; Gln: glutamine; Glu: glutamate; Gly: glycine; PE: phosphoethanolamine; Thr: threonine; hTau: hypotaurine.
Other metabolites
Differences in several other metabolites have been reported in IDH-mutated vs. WT gliomas, as well as across different glioma genetic sub-types and tumor grades, using in vivo and ex vivo MRS. Main findings are summarized in Table 2.
Table 2:
Currently known effects of IDH mutations and 1p/19q codeletion on the neurochemical profile
| In vivo 1H MRS | Ex vivo tissue | |
|---|---|---|
| IDH vs. WT | 2HG ↑ [11] | 2HG ↑ |
| tCho/tCr ↑ [28, 33] | GPC ↑, PCho ↑, Cho ↑ [24] | |
| Glu/tCr ↓, GSH/tCr ↓ [28] | PE ↓ [34] | |
| Glu ↓, Gln ↓, GSH ↓ [23] | Glu ↓ [23, 24, 32] | |
| Glx ↓ [30] | Gln ↓ [32] | |
| GABA ↓ [24] | ||
| NAA ↓, NAAG ↓ [7] | ||
| DH2 vs. IDH1 | 2HG/tCho ↑ [14] | |
| mIns/tCho ↑ [36] | ||
| 1p/19q codeleted vs. non-codeleted | Cystathionine ↑ [31] | Cystathionine ↑ [31] |
| Ser ↓, Gly ↓, Thr ↓, Orn ↓ [31] |
2HG: 2-hydroxyglutarate; Cho: free choline; PCho: phosphocholine; GPC: glicerophosphocholine; tCho: total choline; tCr: total creatine; Gln: glutamine; Glu: glutamate; Glx: Glu + Gln; GSH: glutathione; GABA: gamma-aminobutyric acid; Gly: glycine; mIns: myo-inositol; NAA: N-acetylaspartate; NAAG: N-acetyl-aspartyl-glutamate; Orn: Ornitine; PE: phosphoethanolamine; Ser: serine; Thr: threonine.
IDH vs. WT
IDH-mutated tumors exhibited a significantly lower Glu/tCr compared to WT gliomas from ultra-high-field short-TE MRS experiments [28]. The same study also reported a significantly lower GSH/tCr and significantly elevated tCho/tCr in mutated gliomas with respect to WT. However, a small cohort of patients was investigated and the basis set for metabolic quantification did not include the experimentally measured macromolecular spectrum, which may bias the results. Decreased Glu, Gln and GSH levels in IDH-mutated vs. WT gliomas were also reported from short-TE 3-T experiments [23]. However, the experimentally measured macromolecular spectrum was not used for the quantification, and Glu, Gln and GSH levels associated with a CRLB > 30% were excluded, possibly introducing a bias [29]. Significantly lower Glx levels and a trend to lower GSH levels were observed in a small cohort of IDH-mutated vs. WT GBM at 3 T [30]. Despite technical limitations, these results are in line with the reported lower Glu, Gln and GSH levels measured in mutant vs. WT IDH cell cultures [7]. Lower GSH levels in mutant IDH vs. WT may be explained by the selective depletion in these gliomas of nicotinamide adenine dinucleotide phosphate (NADPH), which is used by IDH for 2HG production and is thus less available for GSH recycling. However, lower total GSH levels in mutated gliomas were not observed by liquid chromatography-mass spectrometry (LC-MS) in a recent study [31**].
Other more recent studies reported decreased Glu, but not Gln, levels in IDH-mutated glioma cells compared to WT, as well as in IDH-mutated vs. WT glioma tissue samples using gas-chromatography-mass spectrometry [23] and 1H HR-MAS [24]. Lower GABA concentration was also observed in the IDH-mutated group in one of these studies [24].
Depletion of Glu levels were suggested to compensate for the altered flux of alpha-ketoglutarate to 2HG in IDH-mutated gliomas [23]. Significant differences in both Glu and Gln levels between IDH-mutated and WT glioma biopsies were observed in another study and were both linked to replenishment of alpha-ketoglutarate by glutaminolysis [32].
NAA and N-acetyl-aspartyl-glutamate (NAAG) levels were also found to be significantly lower in IDH-mutated vs. WT human glioma tissues, yet, the biological mechanism for NAA and NAAG depletion and whether it contributes to tumor pathogenesis remains unclear [7].
Very recently, maximum tCho/N-acetylaspartate (NAA) and tCho/tCr values measured using short-TE MRSI in lesions were shown to be significantly higher in IDH-mutated tumors compared to WT, whereas mean tCho/NAA and tCho/tCr were not significantly different between two groups. In addition, maximum tCho/NAA was significantly higher in grade IV gliomas compared to lower grade gliomas. In contrast, in the peritumoral area, the mean tCho/tCr was found to be significantly elevated in IDH-mutated vs. WT gliomas [33]. These results are in line with the elevated tCho/tCr measured in vivo in human mutated gliomas at 9.4 T [28], and with the observed higher levels of free Cho, GPC, and PCho in IDH-mutated vs. WT gliomas measured ex vivo using 1H HR-MAS [24]. Given the very low concentration of free Cho in the brain, elevated tCho levels are very likely dominated by increased GPC and PCho. Lower PE and higher GPC levels in IDH-mutated vs. WT gliomas were reported in a study combining in vivo 31P MRSI in mouse xenograft models, ex vivo 31P HR-MAS measurements in human biopsies of IDH-mutated tumors, and cell line 31P MRS experiments, suggesting altered phospholipid metabolism caused by IDH mutation [34].
IDH1 vs. IDH2
Higher 2HG levels in gliomas harbouring mitochondrial IDH2 R172K mutations with respect to cytosolic IDH1 R132H mutations were measured at 7 T [14], confirming previous cell culture findings [35]. The same group also reported higher 2HG/tCho and mIns/tCho, and a trend to increase in citrate/tCho and tCr/tCho, in IDH2 vs. IDH1-mutated gliomas [36*]. However, given the variable tCho levels associated with IDH mutation, normalization of metabolic concentrations over tCho may represent a possible source of bias.
1p/19q codeletion
Higher cystathionine levels in brain tumors compared to normal tissue were previously reported from ex vivo tissue analysis [37,38]. A recent in vivo study reported significantly elevated cystathionine in patients with IDH-mutated 1p/19q codeleted gliomas compared with their non-codeleted counterparts [31**]. In vivo results obtained using SV edited MRS (Figure 2) were corroborated by ex vivo LC-MS analysis in tumor samples. Ex vivo experiments showed significantly decreased levels of serine (Ser), Gly, Thr, and ornithine (Orn), and a trend for lower GSH in 1p/19q codeleted vs. non-codeleted tumors. Interestingly, cystathionine, Gly and serine are involved in the glutathione biosynthesis pathways and their altered levels were specifically attributed to the deletion of two serine- and cystathionine-pathway genes located on chromosome 1p - phosphoglycerate dehydrogenase (PHGDH) and cystathionine gamma-lyase (CTH) - possibly leading to a compensatory anti-oxidant mechanism in gliomas with 1p/19q codeletion (Figure 3) [31**]. Although cystathionine can be reliably detected using the same edited MRS protocol used for 2HG, possible further acquisition improvements have been reported [39*].
Figure 3: Schematic diagram of the cystathionine metabolic pathway.
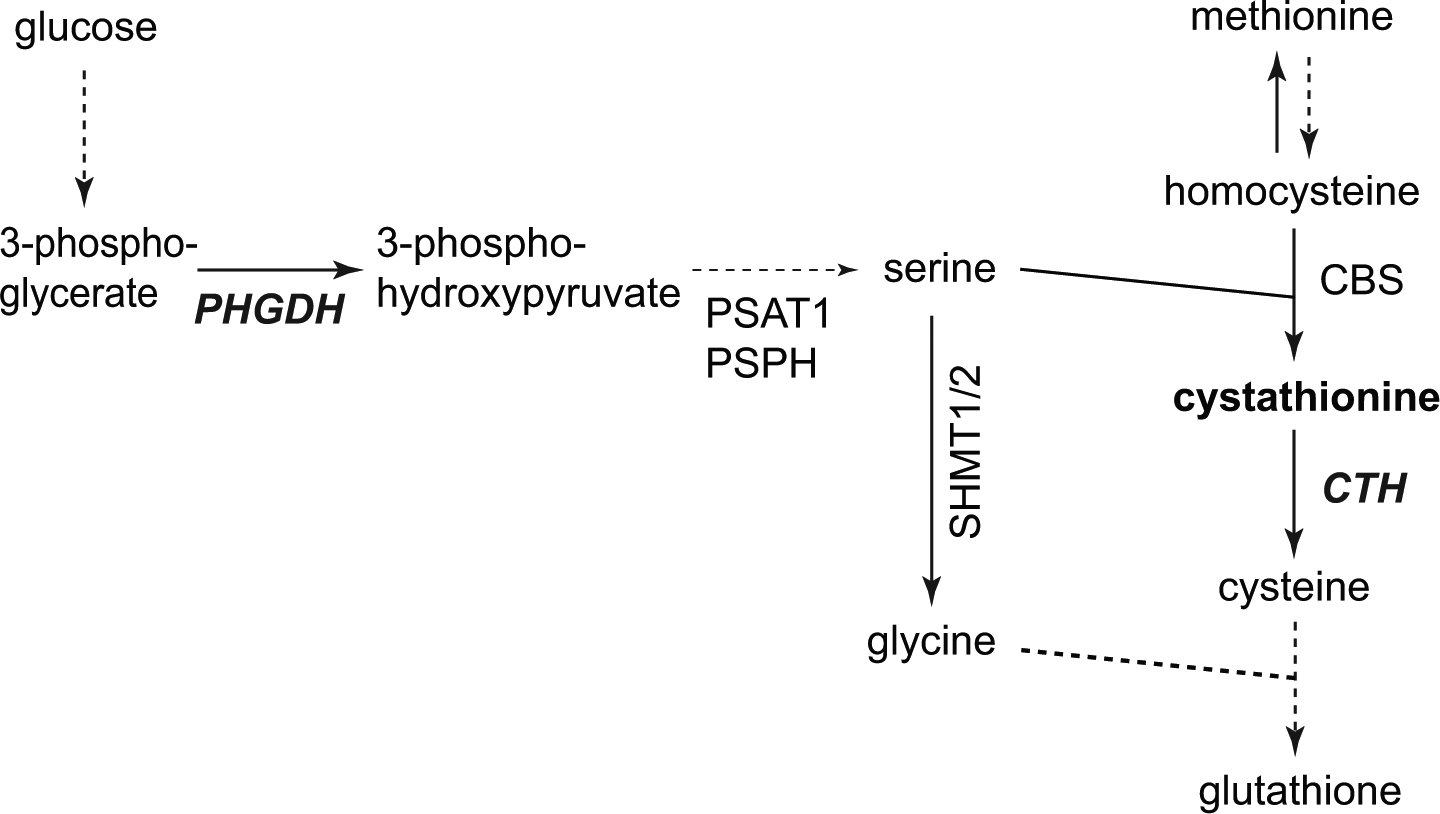
Solid arrows = single metabolic step, dash arrows = multiple (not drawn) metabolic steps. CBS: cystathionine-β-synthase; CTH: cystathionine gamma-lyase; PHGDH: phosphoglycerate dehydrogenase; PSAT: phosphoserine amino transferase; PSPH: phosphoserine phosphatase; SHMT1/2: Serine hydroxy methyl transferase 1/2.
Grade and progression
Elevated in vivo tCho concentration was reported in high-grade compared to lower-grade gliomas [40,41], suggesting that tCho could be used as a marker of cellularity. However, since tCho is not a specific tumor cell marker, and its levels may change due to other pathological processes such as inflammation or gliosis, these results need to be taken with caution.
Choline containing compounds as measured using 1H HR-MAS were found to be significantly higher in tumors that had undergone malignant progression [24]. Interestingly, oligodendrogliomas showed higher levels of GPC and tCho, while astrocytomas had higher levels of PCho and Cho. The associations of oligodendrogliomas with elevated GPC and astrocytomas with elevated PCho and Cho were suggested to reflect differences in the phospholipid metabolism found in the choline kinase pathway between these tumor subtypes. In the same study, positive correlations of 2HG levels with all choline-containing compounds were reported, corroborating previous findings suggesting that both 2HG and choline compounds levels are linked to cellularity. Given the reported differences of choline compounds between different tumor grades and histological subtypes (see below), care must be taken when reporting metabolic levels as ratios over tCho.
Several other metabolites measured using 1H HR-MAS were found to be significantly elevated in gliomas undergoing malignant progression [24]. These included taurine (Tau), hTau, Gly, Glu, GSH, alanine (Ala), Asp, and Bet, Gln and glucose. 2HG was positively correlated with PE, GSH, Tau, Glu, Gln, Asp, myo-I, SI, GABA, PCr/Cr, Gly, Bet, and Thr. Among these metabolites, increases in PE, Glu and Gln were specifically associated with anaplastic astrocytomas, while Tau, Gly, Gln, and Bet were increased in anaplastic oligodendrogliomas.
Gln and Gly, which can be quantified using in vivo MRS, may be useful markers of tumor malignant progression. A very recent study reported a strong association between Gly levels measured by 3 T MRS and the presence of gadolinium enhancement. In addition, Gly levels, but not 2HG levels, were positively correlated with tumor cell proliferation as quantified by MIB-1 labelling index and high Gly/2HG was strongly associated with shorter survival [42**]. The correlation between Gly/2HG and patient outcome observed in this study may reflect the better outcome of IDH vs. WT gliomas (higher 2HG) combined with the better outcome of 1p/19q codeleted vs. non-codeleted gliomas (lower Gly [31**]). However, no information on the codeletion status was reported.
Conclusions
Noninvasive 2HG detection has a strong clinical utility due to its high diagnostic and prognostic power. While conventional in vivo MRS methods available in clinical settings have shown low specificity to IDH mutation, the implementation of advanced in vivo MRS methods enabling reliable 2HG quantification is highly desirable for routine clinical examinations and follow-up of treatment response. Lower Glu, Gln and GSH levels seem to be associated with IDH mutation and abnormal production of 2HG, while elevated tCho suggests altered phospholipid metabolism, which may depend on tumor sub-type, grade and cellularity. Anti-cancer treatments have been suggested to affect tumor metabolism beyond 2HG production, yet the role of different metabolites in predicting patient outcome requires further elucidation. The recent discovery of cystathionine detectability in glioma using in vivo MRS opens up the possibility to exploit a potential novel biomarker of tumor response to treatment and progression. Although at the moment the quantification of the full metabolic profile does not have a direct implication for clinical evaluation, we believe that it provides a better understanding of the tumor pathophysiology and, in the future, it may be crucial for achieving higher specificity in glioma sub-type identification and for evaluation of tumor response to treatment and patient outcome.
Key points.
Reliable 2HG quantification for clinical examinations requires implementation of advanced MRS methods.
IDH mutation leads to tumor metabolic reprogramming beyond 2HG overproduction.
Cystathionine and glycine may play a crucial role for glioma sub-type identification and follow-up of glioma progression.
The evaluation of the full neurochemical profile may help achieving higher specificity in glioma sub-type identification and prediction of patient outcome.
Acknowledgements
Financial support and sponsorship: Francesca Branzoli acknowledges the support from the programs ‘Institut des neurosciences translationnelles’ ANR-10-IAIHU-06 and ‘Infrastructure d’avenir en Biologie Santé’ ANR-11-INBS-0006.
Funding: Francesca Branzoli acknowledges the support from the programs ‘Institut des neurosciences translationnelles’ ANR-10-IAIHU-06 and ‘Infrastructure d’avenir en Biologie Santé’ ANR-11-INBS-0006.
Małgorzata Marjańska acknowledges the support of the following NIH grants: BTRC P41 EB027061, and P30 NS076408.
Footnotes
Conflicts of interest: none.
References
- 1.Yan H, Parsons DW, Jin G, et al. IDH1 and IDH2 mutations in gliomas. N Engl J Med 2009, 360:765–773. [DOI] [PMC free article] [PubMed] [Google Scholar]
- 2.Picca A, Berzero G, Sanson M. Current therapeutic approaches to diffuse grade II and III gliomas. Ther Adv Neurol Disord 2018, 11:175628561775203. [DOI] [PMC free article] [PubMed] [Google Scholar]
- 3.Houillier C, Wang X, Kaloshi G, et al. IDH1 or IDH2 mutations predict longer survival and response to temozolomide in low-grade gliomas. Neurology 2010, 75:1560–1566. [DOI] [PubMed] [Google Scholar]
- 4.Louis DN, Perry A, Reifenberger G, et al. The 2016 World Health Organization classification of tumors of the central nervous system: a summary. Acta Neuropathol 2016, 131:803–820. [DOI] [PubMed] [Google Scholar]
- 5.Reifenberger J, Reifenberger G, Liu L, et al. Molecular genetic analysis of oligodendroglial tumors shows preferential allelic deletions on 19q and 1p. Am J Pathol 1994, 145:1175–90. [PMC free article] [PubMed] [Google Scholar]
- 6.**.Ly KI, Wen PY, Huang RY. Imaging of central nervous system tumors based on the 2016 world health organization classification. Neurol Clin 2020, 38:95–113. [DOI] [PubMed] [Google Scholar]; Recent review of MRI features associated with various genetic subgroups of gliomas and medulloblastomas as defined by the 2016 World Health Organization classification. The reported MRI modalities include anatomical MRI, diffusion-weighted imaging, perfusion-weighted imaging, MRS, and machine learning.
- 7.Reitman ZJ, Jin G, Karoly ED, et al. Profiling the effects of isocitrate dehydrogenase 1 and 2 mutations on the cellular metabolome. Proc Natl Acad Sci U S A 2011, 108:3270–3275. [DOI] [PMC free article] [PubMed] [Google Scholar]
- 8.Beiko J, Suki D, Hess KR, et al. IDH1 mutant malignant astrocytomas are more amenable to surgical resection and have a survival benefit associated with maximal surgical resection. Neuro Oncol 2014, 16:81–91. [DOI] [PMC free article] [PubMed] [Google Scholar]
- 9.Andronesi OC, Rapalino O, Gerstner E, et al. Detection of oncogenic IDH1 mutations using magnetic resonance spectroscopy of 2-hydroxyglutarate. J Clin Invest 2013, 123:3659–3663. [DOI] [PMC free article] [PubMed] [Google Scholar]
- 10.Kim H, Kim S, Lee HH, Heo H. In-Vivo proton magnetic resonance spectroscopy of 2-hydroxyglutarate in isocitrate dehydrogenase-mutated gliomas: a technical review for neuroradiologists. Korean J Radiol 2016, 17:620. [DOI] [PMC free article] [PubMed] [Google Scholar]
- 11.**.Suh CH, Kim HS, Jung SC, Choi CG, Kim SJ: 2-Hydroxyglutarate MR spectroscopy for prediction of isocitrate dehydrogenase mutant glioma: a systemic review and meta-analysis using individual patient data. Neuro-Oncology 2018, 20:1573–1583. [DOI] [PMC free article] [PubMed] [Google Scholar]; Recent systematic review focusing on the diagnostic performance of 2HG MRS for prediction of IDH mutant glioma using fourteen original articles with 460 patients. The pooled sensitivity and specificity for the diagnostic performance of 2HG MRS for prediction of IDH mutant glioma were 95% (95% CI, 85–98%) and 91% (95% CI, 83–96%), respectively. Among the studies using PRESS, those using a long TE (97 ms) showed higher diagnostic performance than those using a short TE.
- 12.Pope WB, Prins RM, Albert Thomas M, et al. Non-invasive detection of 2-hydroxyglutarate and other metabolites in IDH1 mutant glioma patients using magnetic resonance spectroscopy. J Neuro Oncol 2012, 107:197–205. [DOI] [PMC free article] [PubMed] [Google Scholar]
- 13.Choi C, Ganji SK, DeBerardinis RJ, et al. 2-hydroxyglutarate detection by magnetic resonance spectroscopy in IDH-mutated patients with gliomas. Nat Med 2012, 18:624–629. [DOI] [PMC free article] [PubMed] [Google Scholar]
- 14.Emir UE, Larkin SJ, de Pennington N, et al. Noninvasive quantification of 2-hydroxyglutarate in human gliomas with IDH1 and IDH2 mutations. Cancer Res 2016, 76:43–49. [DOI] [PMC free article] [PubMed] [Google Scholar]
- 15.Andronesi OC, Kim GS, Gerstner E, et al. Detection of 2-hydroxyglutarate in IDH-mutated glioma patients by in vivo spectral-editing and 2D correlation magnetic resonance spectroscopy. Sci Transl Med 2012, 4:116ra4–116ra4. [DOI] [PMC free article] [PubMed] [Google Scholar]
- 16.*.Branzoli F, Di Stefano AL, Capelle L, et al. Highly specific determination of IDH status using edited in vivo magnetic resonance spectroscopy. Neuro Oncol 2018, 20:907–916. [DOI] [PMC free article] [PubMed] [Google Scholar]; The article reports the advantages of the use of edited MRS with respect to long-TE optimized PRESS for robust quantification of 2HG. First, edited MRS makes it possible to eliminate the spectral overlap of 2HG with the other metabolites, thereby allowing for a simplification of the spectral analysis; second, edited MRS provided 100 % specificity and 100% sensitivity, while optimized PRESS showed lower performance.
- 17.Choi C, Ganji S, Hulsey K, et al. A comparative study of short- and long-TE 1H MRS at 3 T for in vivo detection of 2-hydroxyglutarate in brain tumors: MRS detectability of 2-hydroxyglutarate. NMR Biomed 2013, 26:1242–1250. [DOI] [PMC free article] [PubMed] [Google Scholar]
- 18.Suh CH, Kim HS, Paik W, et al. False-positive measurement at 2-hydroxyglutarate MR spectroscopy in isocitrate dehydrogenase wild-type glioblastoma: a multifactorial analysis. Radiology 2019, 291:752–762. [DOI] [PubMed] [Google Scholar]
- 19.de la Fuente MI, Young RJ, Rubel J, et al. Integration of 2-hydroxyglutarate-proton magnetic resonance spectroscopy into clinical practice for disease monitoring in isocitrate dehydrogenase-mutant glioma. Neuro Oncol 2016, 18:283–290. [DOI] [PMC free article] [PubMed] [Google Scholar]
- 20.Zhou M, Zhou Y, Liao H, et al. Diagnostic accuracy of 2-hydroxyglutarate magnetic resonance spectroscopy in newly diagnosed brain mass and suspected recurrent gliomas. Neuro Oncol 2018, 20:1262–1271. [DOI] [PMC free article] [PubMed] [Google Scholar]
- 21.Choi C, Raisanen JM, Ganji SK, et al. Prospective longitudinal analysis of 2-hydroxyglutarate magnetic resonance spectroscopy identifies broad clinical utility for the management of patients with IDH -mutant glioma. J Clin Oncol 2016, 34:4030–4039. [DOI] [PMC free article] [PubMed] [Google Scholar]
- 22.Elkhaled A, Jalbert LE, Phillips JJ, et al. Magnetic resonance of 2-hydroxyglutarate in IDH1-mutated low-grade gliomas. Sci Transl Med 2012, 4:116ra5–116ra5. [DOI] [PMC free article] [PubMed] [Google Scholar]
- 23.Nagashima H, Tanaka K, Sasayama T, et al. Diagnostic value of glutamate with 2-hydroxyglutarate in magnetic resonance spectroscopy for IDH1 mutant glioma. Neuro Oncol 2016, 18(11):1559–1568. [DOI] [PMC free article] [PubMed] [Google Scholar]
- 24.Jalbert LE, Elkhaled A, Phillips JJ, et al. Metabolic profiling of IDH mutation and malignant progression in infiltrating glioma. Sci Rep 2017, 7:44792. [DOI] [PMC free article] [PubMed] [Google Scholar]
- 25.Fellah S, Caudal D, De Paula AM, et al. Multimodal MR imaging (diffusion, perfusion, and spectroscopy): is it possible to distinguish oligodendroglial tumor grade and 1p/19q codeletion in the pretherapeutic diagnosis? AJNR Am J Neuroradiol 2013, 34:1326–1333. [DOI] [PMC free article] [PubMed] [Google Scholar]
- 26.Andronesi OC, Loebel F, Bogner W, et al. Treatment response assessment in IDH-mutant glioma patients by noninvasive 3D functional spectroscopic mapping of 2-hydroxyglutarate. Clin Cancer Res 2016, 22:1632–1641. [DOI] [PMC free article] [PubMed] [Google Scholar]
- 27.**.Andronesi OC, Arrillaga-Romany IC, Ly KI, et al. Pharmacodynamics of mutant-IDH1 inhibitors in glioma patients probed by in vivo 3D MRS imaging of 2-hydroxyglutarate. Nat Commun 2018, 9:1474. [DOI] [PMC free article] [PubMed] [Google Scholar]; 2HG levels were shown to decrease by 70% after 1 week of treatment with an IDH inhibitor in a phase I clinical trial using non-invasive 3D MRSI of 2HG. The relation between the change in 2HG levels and other metabolites, and the correlation with other imaging parameters such as tumor volumetrics and apparent diffusion coefficients were also investigated.
- 28.Bisdas S, Chadzynski GL, Braun C, et al. MR spectroscopy for in vivo assessment of the oncometabolite 2-hydroxyglutarate and its effects on cellular metabolism in human brain gliomas at 9.4T: MRS of IDH Mutant Gliomas at 9.4T. J Magn Reson Imaging 2016, 44:823–833. [DOI] [PubMed] [Google Scholar]
- 29.Kreis R: The trouble with quality filtering based on relative Cramér-Rao lower bounds: the trouble with quality filtering based on relative CRLB. Magn Reson Med 2016, 75:15–18. [DOI] [PubMed] [Google Scholar]
- 30.Natsumeda M, Motohashi K, Igarashi H, et al. Reliable diagnosis of IDH-mutant glioblastoma by 2-hydroxyglutarate detection: a study by 3-T magnetic resonance spectroscopy. Neurosurg Rev 2018, 41:641–647. [DOI] [PubMed] [Google Scholar]
- 31.**.Branzoli F, Pontoizeau C, Tchara L, et al. Cystathionine as a marker for 1p/19q codeleted gliomas by in vivo magnetic resonance spectroscopy. Neuro Oncol 2019, 21:765–774. [DOI] [PMC free article] [PubMed] [Google Scholar]; The first in vivo detection of cystathionine by MRS in 1p/19q codeleted gliomas. Selective accumulation of cystathionine was observed in codeleted gliomas in vivo, in brain tissue samples, as well as in cells harboring heterozygous deletions for serine- and cystathionine-pathway genes located on chromosome 1p.
- 32.Ohka F, Ito M, Ranjit M, et al. Quantitative metabolome analysis profiles activation of glutaminolysis in glioma with IDH1 mutation. Tumor Biol 2014, 35:5911–5920. [DOI] [PubMed] [Google Scholar]
- 33.Goryawala M, Saraf‐Lavi E, Nagornaya N, et al. The association between whole‐brain MR spectroscopy and IDH mutation status in gliomas. J Neuroimaging 2020, 30:58–64. [DOI] [PMC free article] [PubMed] [Google Scholar]
- 34.Esmaeili M, Hamans BC, Navis AC, et al. IDH1 R132H mutation generates a distinct phospholipid metabolite profile in glioma. Cancer Res 2014, 74:4898–4907. [DOI] [PubMed] [Google Scholar]
- 35.Ward PS, Lu C, Cross JR, et al. The potential for isocitrate dehydrogenase mutations to produce 2-hydroxyglutarate depends on allele specificity and subcellular compartmentalization. J Biol Chem 2013, 288:3804–3815. [DOI] [PMC free article] [PubMed] [Google Scholar]
- 36.*.Shen X, Voets N, Larkin S, et al. A noninvasive comparison study between human gliomas with IDH1 and IDH2 mutations by MR spectroscopy. Metabolites 2019, 9:35. [DOI] [PMC free article] [PubMed] [Google Scholar]; This article reports higher levels of 2HG/tCho and mIns/tCho in IDH2 compared to IDH1-mutated gliomas at 7 T. Additionally, mIns and glucose+taurine were shown to be correlated with 2HG levels.
- 37.Lefauconnier J-M, Portemer C, Chatagner F. Free amino acids and related substances in human glial tumours and in fetal brain: comparison with normal adult brain. Brain Res 1976, 117:105–113. [DOI] [PubMed] [Google Scholar]
- 38.Wróbel M, Czubak J, Bronowicka-Adamska P, et al. Is development of high-grade gliomas sulfur-dependent? Molecules 2014, 19:21350–21362. [DOI] [PMC free article] [PubMed] [Google Scholar]
- 39.*.Branzoli F, Deelchand DK, Sanson M, et al. In vivo 1 H MRS detection of cystathionine in human brain tumors. Magn Reson Med 2019, 82:1259–1265. [DOI] [PMC free article] [PubMed] [Google Scholar]; This article reports the technical aspects of noninvasive detection of cystathionine in human brain gliomas using edited MRS, and suggests possible further acquisition improvements for robust quantification of this metabolite.
- 40.Wenger KJ, Hattingen E, Franz K, et al. In vivo metabolic profiles as determined by 31P and short TE 1H MR-Spectroscopy: no difference between patients with IDH wildtype and IDH mutant gliomas. Clin Neuroradiol 2019, 29:27–36. [DOI] [PubMed] [Google Scholar]
- 41.Grech-Sollars M, Ordidge KL, Vaqas B, et al. Imaging and tissue biomarkers of choline metabolism in diffuse adult glioma: 18F-fluoromethylcholine PET/CT, Magnetic Resonance Spectroscopy, and choline kinase α. Cancers 2019, 11:1969. [DOI] [PMC free article] [PubMed] [Google Scholar]
- 42.**.Tiwari V, Daoud EV, Hatanpaa KJ, et al. Glycine by MR spectroscopy is an imaging biomarker of glioma aggressiveness. Neuro Oncol 2020, Epub ahead of print. [DOI] [PMC free article] [PubMed] [Google Scholar]; Elevated glycine was strongly associated with presence of gadolinium enhancement, indicating more rapidly proliferative disease. Glycine concentration was positively correlated with MIB-1, and levels higher than 2.5 mM showed significant association with shorter patient survival, irrespective of IDH status. Concentration of 2HG did not correlate with MIB-1 index. A high glycine/2HG concentration ratio, >2.5, was strongly associated with shorter survival.