Abstract
Endogenous RNA transcription characterizes double-stranded RNA (dsRNA) viruses in the Reoviridae, a family that is exemplified by its simple, single-shelled member cytoplasmic polyhedrosis virus (CPV). Because of the lack of in situ structures of the intermediate stages of RNA-dependent RNA polymerase (RdRp) during transcription, it is poorly understood how RdRp detects environmental cues and internal transcriptional states to initiate and coordinate repeated cycles of transcript production inside the capsid. Here, we captured five high-resolution (2.8–3.5Å) RdRp-RNA in situ structures—representing quiescent, initiation, early elongation, elongation and abortive states—under seven experimental conditions of CPV. We observed the ‘Y’-form initial RNA fork in the initiation state and the complete transcription bubble in the elongation state. These structures reveal that de novo RNA transcription involves three major conformational changes during state transitions. Our results support an ouroboros model for endogenous conservative transcription in dsRNA viruses.
RNA transcription is an ancient process in the emergence of life, and likely predates DNA transcription, a process common among all modern life forms. Lacking DNA in their replication cycle, all known segmented dsRNA viruses possess the protein machinery required for endogenous RNA transcription1. These viruses are excellent model systems for understanding various aspects of RNA transcription in a cell-free environment, including how external signals trigger conformational changes inside the virus to initiate RNA transcription and elongation, and how genomic RNA acts as a template to repeatedly produce and release capped transcripts from a transcribing viral particle. These processes have been shown biochemically to be highly regulated in viruses of the Reoviridae2–6. These viruses possess a segmented dsRNA genome enclosed within an inner core, and a simple RNA-dependent RNA polymerase (RdRp) complex consisting of only one to two protein components7–13 that is fully capable of RNA transcription within the intact capsid shell14,15. Each of the 9–12 dsRNA segments is associated with an RdRp, located underneath an icosahedral vertex, which can undergo simultaneous RNA transcription within an intact core16. Cytoplasmic polyhedrosis virus (CPV)14—a single-shelled member, and thus the simplest of the Reoviridae—has been used as a model system for viral RNA transcription and cryo-electron microscopy (cryoEM) studies, exemplified by the discovery of transcript capping3,17 and the demonstration of near atomic resolution cryoEM18.
Transcription in these viruses is activated by external events, such as the removal of the outer shells in multishelled reoviruses2,4,5,10 and the binding of S-adenosyl-l-methionine (SAM) in CPV3,6,19. Recent asymmetric reconstructions have documented the two distinct RdRp structures of CPV, and have revealed that each CPV virion consists of a single-layer icosahedral capsid, containing ten transcriptional enzyme complexes (TECs) that each presumably anchor one of the ten segmented dsRNAs8,9. The 10 dsRNA segments range from 944 to 4,189 nucleotides in length but share conserved 5′-AGUAA/GUUAGCC-3′ sequences at 5′ and 3′ ends20. In CPV, binding of SAM to the external turret protein (TP), located far (140 Å) from the RdRps within the virus, initiates endogenous RNA transcription19. By contrast, in multiple-shelled members of the Reoviridae (for example, aquareovirus), transcription is initiated by the removal of the outermost shell from the virion, which triggers conformation changes in the TEC and viral genomic RNA10. However, without atomic structures of CPV to visualize RdRp and RNA in functional intermediate states, how SAM’s binding to the external protein triggers RdRp conformational changes inside CPV and how the repetitive cycle of RNA transcription in dsRNA viruses occurs remain poorly understood.
Here, we obtained cryoEM reconstructions of CPV bound by different ligands under seven distinct conditions of viral RNA transcription at resolutions ranging from 2.8 to 3.5 Å. These structures represent four sequential states of productive transcription: quiescent, initiation, early-elongation and elongation, as well as the long-sought-after abortive state21. Our results show that de novo transcription of CPV involves three major conformational changes: the quiescent to the initiation state, in which the capped-terminal RNA (capped 5′ end of the non-template strand in viral genomic dsRNA) unwinds; the initiation to the early-elon-gation state, in which elongation begins; and the early-elongation to the elongation state, in which template RNA and non-template RNA anneal, and the nascent transcript is released. The observed RdRp-RNA structures explain the energetics of state transitions and support an ouroboros model of RNA transcription inside dsRNA viruses.
Results
Five functional states of CPV, captured under different conditions.
To gain insight into the mechanism of the entire process of RNA transcription, we first determined the asymmetric reconstructions of CPV virions (Fig. 1a, Extended Data Fig. 1 and Supplementary Video 1) under seven different conditions, including quiescent CPV (q-CPV) and CPV treated with the following different substrates: S-CPV (SAM), SG-CPV (SAM + GTP), SA-CPV (SAM + ATP), SGA-CPV (SAM + GTP + ATP), SGAU-CPV (SAM + GTP + ATP + UTP) and t-CPV (SAM + GTP + ATP + UTP + CTP; transcribing state) (Table 1 and Supplementary Table 1; see Methods). The resolutions of these asymmetric reconstructions range from 3.1 to 4.1 Å.
Fig. 1 |. CryoEM imaging and atomic modeling of de novo transcript transcription in CPV.
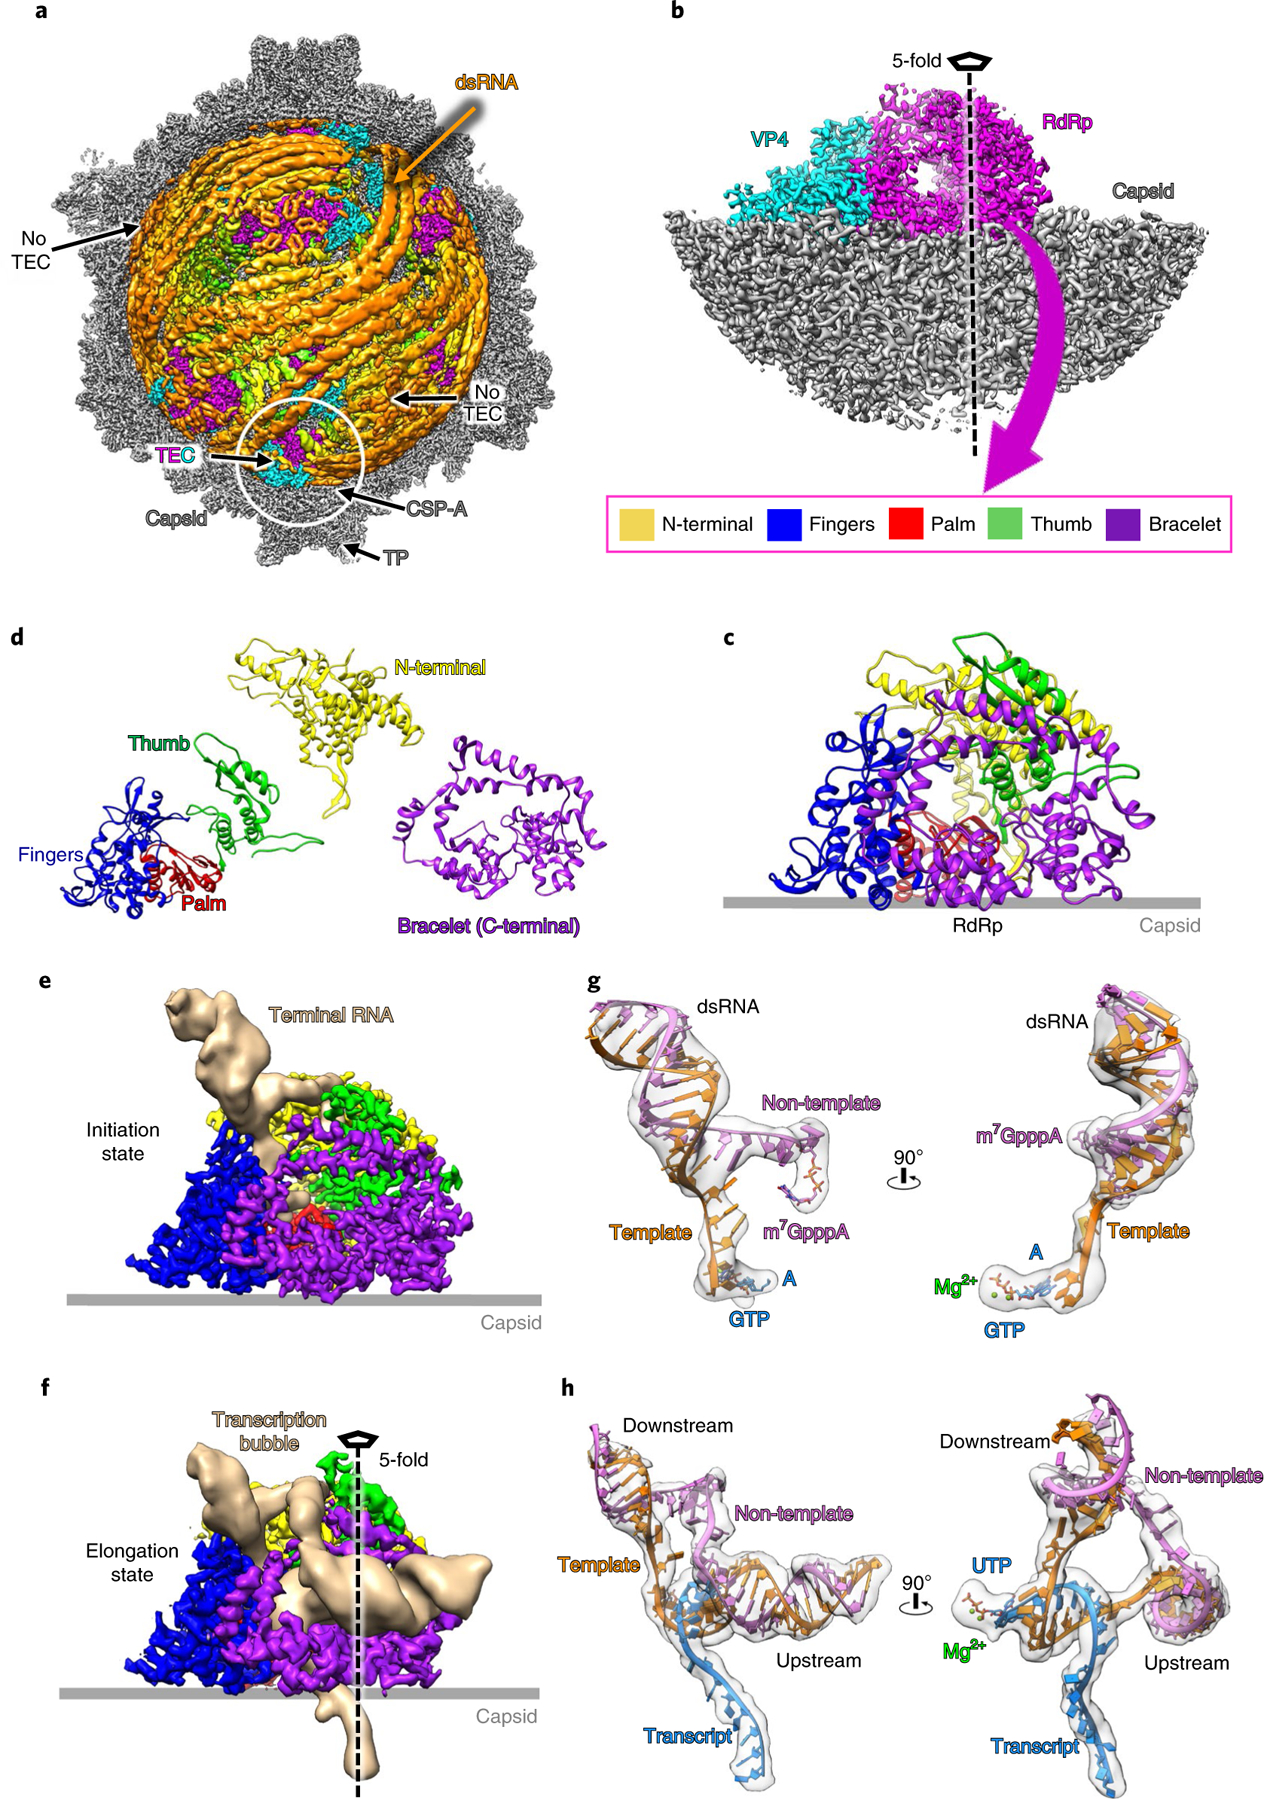
a, Asymmetric reconstruction of SGA-CPV at 3.1 Å resolution. The front half is removed to show dsRNA (filtered to 6Å for clarity, here and in all subsequent figures) and TEC densities. b, Subparticle reconstruction of five-fold vertices in the initiation state at 2.9Å resolution. c,d, Ribbon models of the whole RdRp (c) and its separate domains (d). e,f, Density maps of RdRp with unwound terminal RNA in the initiation state (e) and with a complete transcription bubble in the elongation state (f). g,h, Superpositions of densities and ribbon models showing the unwound terminal RNA with initial nucleotides in initiation state (g) and the transcription bubble in elongation state (h).
Table 1 |.
CryoEM data collection, refinement and validation statistics (asymmetric reconstruction)
| q-CPV (EMD-20595) | S-CPV (EMD-20596) | SG-CPV (EMD-20597) | SA-CPV (EMD-20598) | SGA-CPV (EMD-20599) | SGAU-CPV (EMD-20600) | t-CPV (EMD-20601) |
|
|---|---|---|---|---|---|---|---|
| Data collection and processing | |||||||
| Magnification | 130,000 | 130,000 | 130,000 | 130,000 | 130,000 | 130,000 | 105,000 |
| Voltage (kV) | 300 | 300 | 300 | 300 | 300 | 300 | 300 |
| Electron exposure (e− per Å2) | ~44 | ~40 | ~48 | ~50 | ~44 | ~48 | ~40 |
| Defocus range (μm) | 0.8–3 | 0.8–3 | 0.8–3 | 0.8–3 | 0.8–3 | 0.8–3 | 0.8–3 |
| Pixel size (Å) | 1.062 | 1.062 | 1.062 | 1.062 | 1.062 | 1.062 | 1.360 |
| Symmetry imposed | C1 | C1 | C1 | C1 | C1 | C1 | C1 |
| Initial particle images (no.) | 95,428 | 22,795 | 42,429 | 33,093 | 191,055 | 56,227 | 89,587 |
| Final particle images (no.) | 82,420 | 22,465 | 41,969 | 28,854 | 182,525 | 55,129 | 89,587 |
| Map resolution (Å) | 3.7 | 3.9 | 3.7 | 4.0 | 3.1 | 3.6 | 4.1 |
| FSC threshold | 0.143 | 0.143 | 0.143 | 0.143 | 0.143 | 0.143 | 0.143 |
| Map resolution range (Å) | 3–30 | 3.1–30 | 3–30 | 3.5–30 | 2.5–30 | 2.9–30 | 3.5–30 |
The structures show ten TECs positioned under ten of the 12 five-fold vertices of each icosahedral capsid, with the two vertices without a TEC occupied by dsRNA (Fig. 1a and Supplementary Video 1), similar to the arrangement previously seen in the asymmetric reconstruction of q-CPV8. Each TEC consists of two proteins, VP4 and RdRp (Fig. 1b)8,9: VP4 is an ‘L’-shaped protein containing an NTP-binding motif8; RdRp consists of an amino-terminal domain (amino acids (aa) 1–348), bracelet domain (aa 864–1225) and a hand-like core domain that is conserved among all DNA polymerases, viral RNA polymerases and cellular telomerases. The conserved core domain is further divided into fingers (aa 349–515, 549–641), palm (aa 516–548, 642–729) and thumb (aa 730–863) subdomains (Fig. 1c,d).
In order to clarify the features of these structures, we used subparticle reconstruction and three-dimensional (3D) focused classification22 to capture different conformations of the RdRp and associated RNA structures (Fig. 2, Extended Data Figs. 2 and 3, Supplementary Fig. 1 and 2, Table 2 and Supplementary Table 1). Then, on the basis of the conformations of the RdRp and the capped-terminal RNA (the conformation of NTPase VP4 remains the same among all these structures), we identified three major states of RdRp: quiescent, initiation and elongation (Figs. 1e,f and 2b–d). The quiescent state was predominantly captured in the q-CPV, S-CPV, SG-CPV and SA-CPV samples (but still seen in the 3D classification results of the SGAU-CPV and t-CPV samples) (Fig. 2a and Supplementary Table 1); the initiation state in the SA-CPV, SGA-CPV, SGAU-CPV and t-CPV samples (Fig. 2b, Supplementary Table 1 and Supplementary Video 2); and the elongation state in the t-CPV sample only (Fig. 2c, Supplementary Table 1 and Supplementary Video 3). An intermediate state between the initiation and elongation states, which we termed the early-elongation state, was also captured in the carefully designed experimental condition of the SGAU-CPV sample (Fig. 2e and Supplementary Table 1). In addition to capturing these states of the productive transcriptional pathway, we also captured the biochemically demonstrated—but hitherto never directly visualized—abortive state in the SA-CPV, SGA-CPV, SGAU-CPV and t-CPV samples (Fig. 2d and Supplementary Table 1; see Discussion). Since q-CPV, S-CPV and SG-CPV samples contain RdRp in only the quiescent state, while the RdRp structure in the initiation state was captured in the SA-CPV, SGA-CPV, SGAU-CPV and t-CPV samples, we conclude that SAM and ATP together trigger CPV transition into the initiation state conformation (Supplementary Table 1, see the ‘Supplementary results‘ section in Supplementary Information).
Fig. 2 |. Five functional states of CPV captured from the seven CPV samples under different conditions.
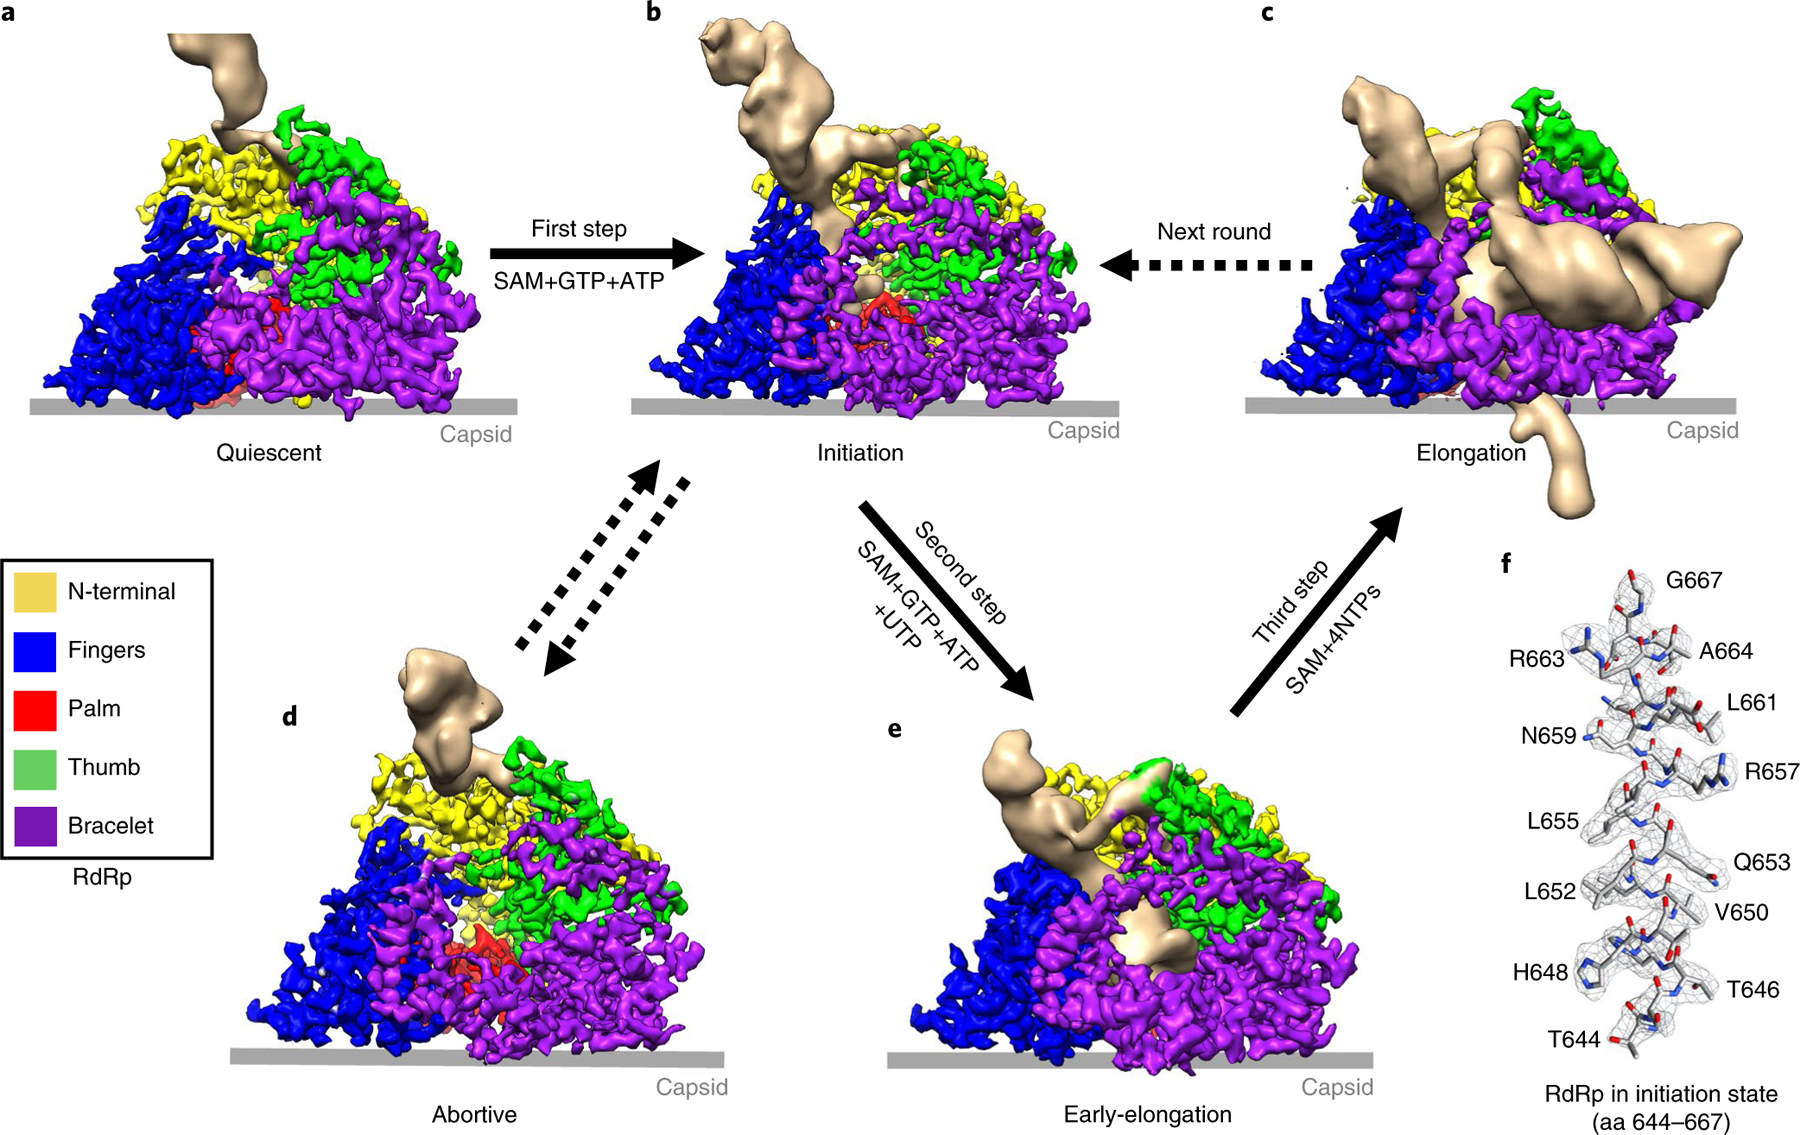
a–e, Structures of the RdRp-RNA in five different states showing the process of de novo transcription in CPV. Solid arrows denote sequential state transitions and dotted arrows represent hypothesized transitions. f, Density map (mesh) and atomic model (sticks) of a helix in RdRp with residues indicated.
Table 2 |.
CryoEM data collection, refinement and validation statistics (subparticle reconstruction)
| Quiescent state (EMD-20581, PDB 6TY8) | Initiation state (EMD-20582 PDB 6TY9) | Abortive state (EMD-20585 PDB 6TZ0) | Early-elongation state (EMD-20586 PDB 6TZ1) | Elongation state (EMD-20587 PDB 6TZ2) | |
|---|---|---|---|---|---|
| Data collection and processing | |||||
| Magnification | 130,000 | 130,000 | 130,000 | 130,000 | 105,000 |
| Voltage (kV) | 300 | 300 | 300 | 300 | 300 |
| Electron exposure (e− per Å2) | ~48 | ~44 | ~50 | ~48 | ~40 |
| Defocus range (μm) | 0.8–3 | 0.8–3 | 0.8–3 | 0.8–3 | 0.8–3 |
| Pixel size (Å) | 1.062 | 1.062 | 1.062 | 1.062 | 1.360 |
| Symmetry imposed | C1 | C1 | C1 | C1 | C1 |
| Initial particle images (no.) | 481,822 | 1,084,284 | 2,168,544 | 445,115 | 1,025,054 |
| Final particle images (no.) | 323,500 | 302,003 | 620,545 | 43,807 | 145,954 |
| Map resolution (Å) | 3.0 | 2.9 | 2.8 | 3.4 | 3.5 |
| FSC threshold | 0.143 | 0.143 | 0.143 | 0.143 | 0.143 |
| Map resolution range (Å) | 2.5–4.0 | 2.5–4.5 | 2.5–4.5 | 3.0–6.0 | 3.0–6.0 |
| Refinement | |||||
| Initial model used | 3JB6 | 3JB7 | 6TZ2 | 6TZ2 | 3JB7 |
| Model resolution (Å) | 3.1 | 2.9 | 2.9 | 3.4 | 3.7 |
| FSC threshold | 0.5 | 0.5 | 0.5 | 0.5 | 0.5 |
| Map sharpening B factor (Å2) | −80 | −80 | −80 | −80 | −80 |
| Model composition | |||||
| Nonhydrogen atoms | 13,607 | 14,559 | 13,674 | 14,212 | 15,608 |
| Protein residues | 1,694 | 1,709 | 1,709 | 1,709 | 1,709 |
| Ligands | 1 | 5 | 0 | 1 | 4 |
| B factors (Å2) | |||||
| Protein | 25.41 | 25.91 | 44.62 | 37.43 | 82.43 |
| Ligand | 70.02 | 54.99 | - | 72.46 | 109.21 |
| Root mean square deviations | |||||
| Bond lengths (Å) | 0.006 | 0.007 | 0.006 | 0.006 | 0.008 |
| Bond angles (°) | 0.938 | 0.644 | 0.932 | 0.867 | 0.942 |
| Validation | |||||
| MolProbity score | 1.44 | 1.56 | 1.43 | 1.57 | 1.64 |
| Clash score | 4.88 | 5.85 | 3.74 | 4.35 | 5.14 |
| Poor rotamers | 0.75% | 0.20% | 0.54% | 0.47% | 0.47% |
| Ramachandran plot | |||||
| Favored | 96.91% | 96.41% | 96.12% | 94.65% | 94.59% |
| Allowed | 3.03% | 3.59% | 3.88% | 5.35% | 5.35% |
| Disallowed | 0.06% | 0.00% | 0.00% | 0.00% | 0.06% |
Of our structures, those of the initiation, early-elongation, elongation and abortive states have not been observed before, while that of the quiescent state is the same as the previous q-CPV structure8,9; however, our new structure is at a better resolution (3.0 Å) and was captured in three different experimental conditions (q-CPV, S-CPV and SG-CPV) (Supplementary Table 1), allowing functional interpretation. In the initiation and elongation states, the capped-terminal RNA fork and transcription bubble can be modeled with a perfect dsRNA duplex (Fig. 1e,h and Supplementary Videos 2 and 3). In the initiation state, we modeled the non-template RNA as m7GpppApGpUpApA, based on the 5′ conserved sequence of CPV14,23, and the other bases of non-template RNA are modeled after poly-U; template RNA and the initial transcript are modeled on the basis of base-pairing rules (Fig. 1g). In the elongation state, a complete transcription bubble is modeled with poly-A and poly-U (Fig. 1h).
SAM and ATP synergistically trigger de novo initiation in CPV.
In the quiescent state, a rod-like capped-terminal RNA density interacts with the N-terminal domain of RdRp via the RNA cap, at an angle about 65° tangent to the five-fold axis of the icosahedral capsid (Fig. 3a,b): the m7G base of the RNA cap interacts with an A/G base binding site formed by Y184 and R37 of the N-terminal domain (Fig. 3c). In the initiation state (Supplementary Video 2), with the capped-terminal RNA unwound and separated (Fig. 3d,e), the non-template RNA inserts into the non-template RNA binding cleft formed by the N-terminal and the thumb (Fig. 3f). The first base (A) of the non-template RNA interacts with the A/G base binding site, and the fourth base (also A) interacts with S823 of the thumb (Fig. 3f). The RNA cap binds to the cap-binding site underneath the A/G base binding site (Fig. 3g). The template RNA reaches the active site of the polymerase core through a newly formed, positively charged template-RNA entry tunnel during the initiation state; by contrast, during the quiescent state, this template-RNA entry tunnel is blocked by negatively charged residues (Fig. 3h). Inside the polymerase core, 5′-A (1st base) of the transcript is stabilized by K521 of the conformation-changed priming loop (aa 516–529) (Fig. 3j), and this A and a GTP are base-paired with the first two bases of the 3′ end of the template RNA. Two essential Mg2+ ions coordinate with the first two nucleotides of the transcript and three conserved aspartic acids (D547, D680 and D681) (Fig. 3i)24–30. In addition, we observed a third metal atom density located at the active site (‘putative metal ion’ in Fig. 3i and Extended Data Fig. 4). These components together form an initial template-transcript complex of de novo initiation (Fig. 3i). These observations indicate that, during the transition of the quiescent state and the initiation state, RdRp needs to change conformation in order for the template RNA to enter, thereby initiating transcript synthesis.
Fig. 3 |. Structures of RdRp and capped-terminal RNA in the quiescent and initiation states.
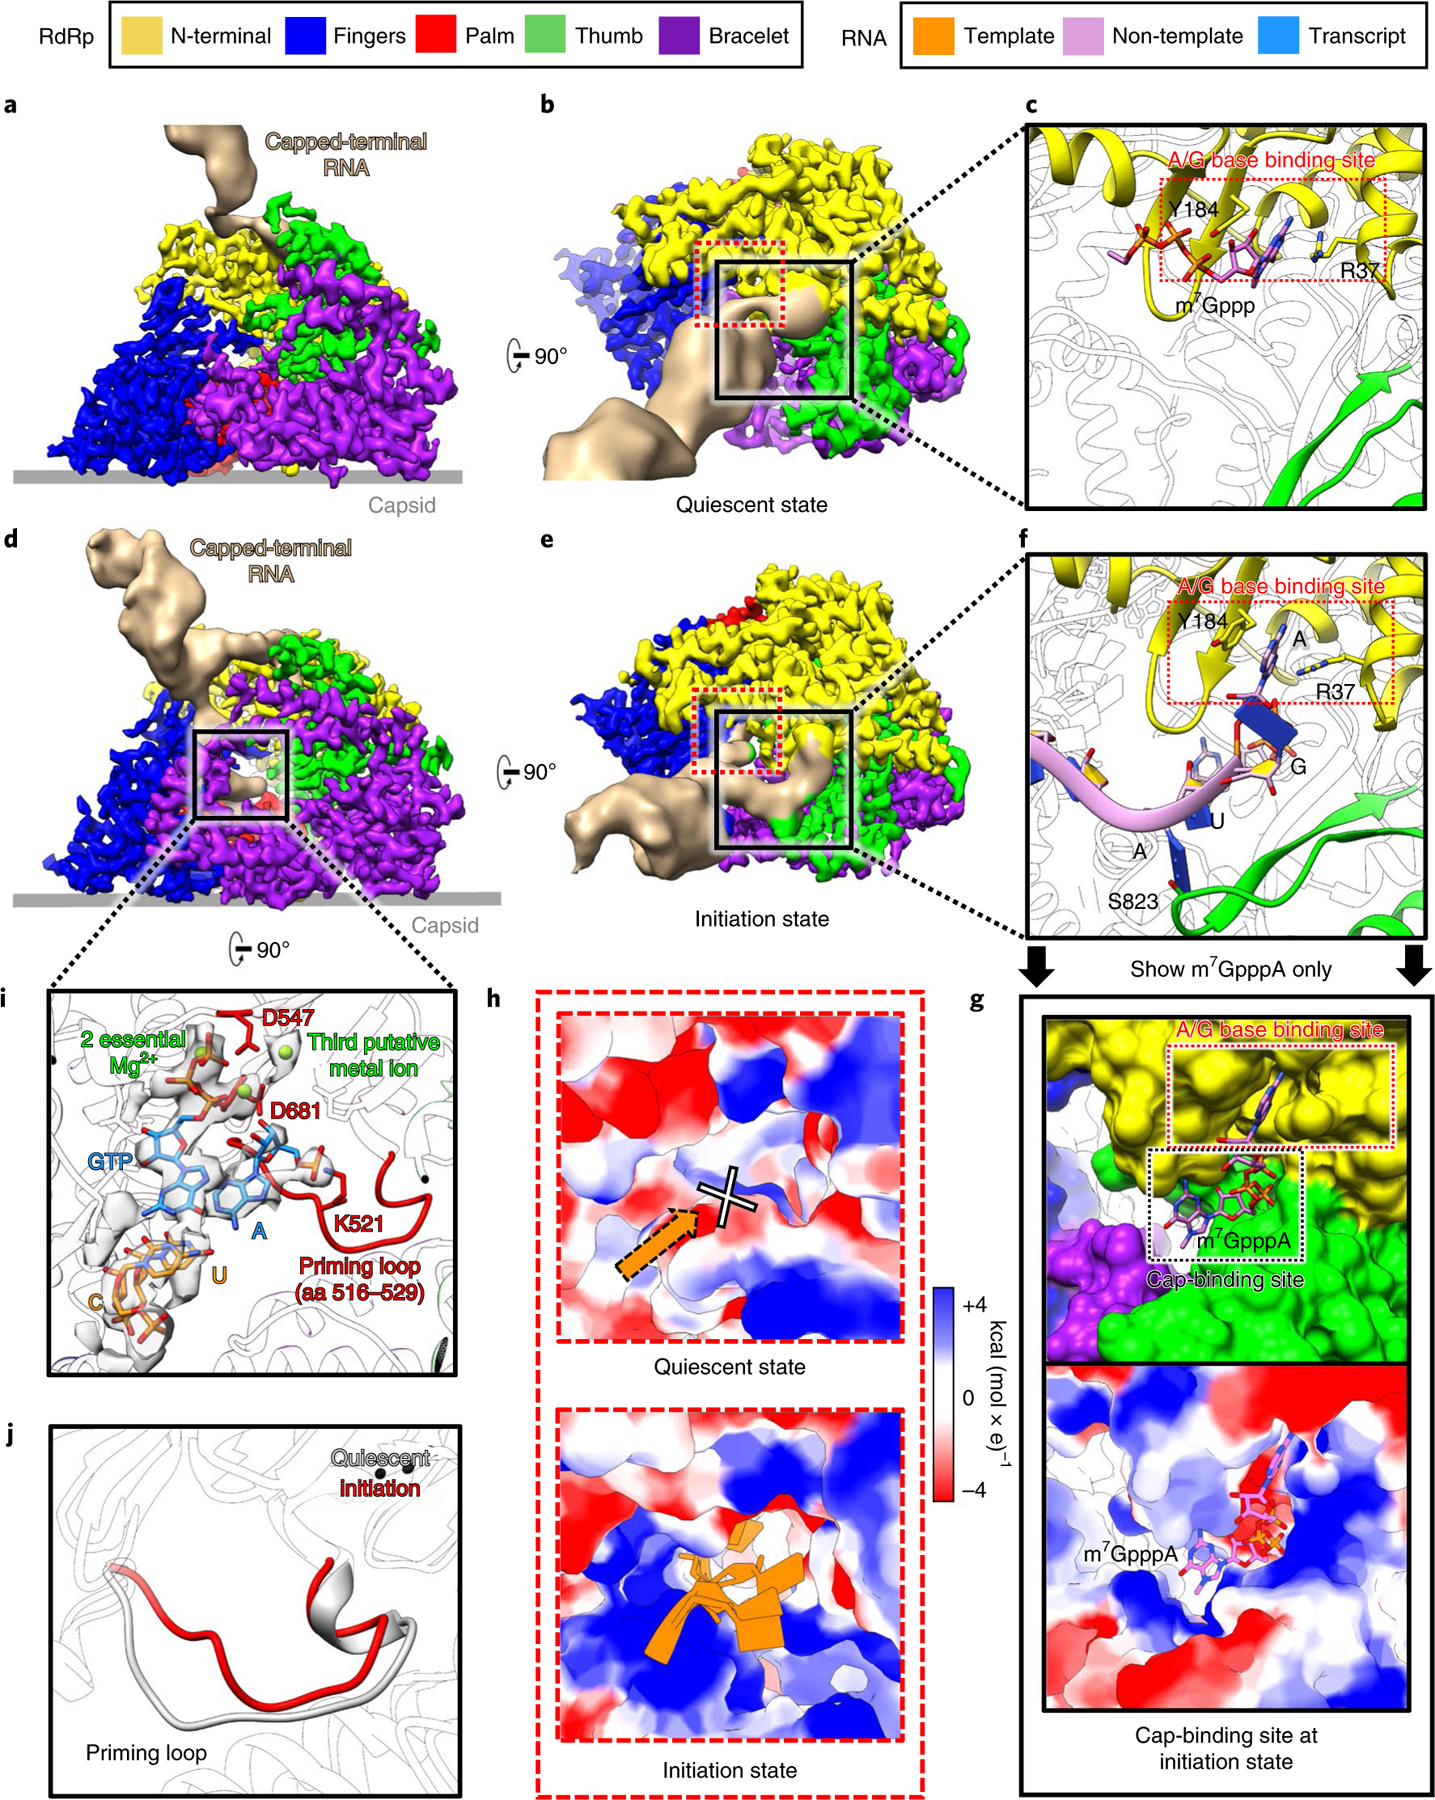
a–g, Structures of RdRp with capped-terminal RNA, in quiescent (a–c) and initiation (d–g) states. The non-template RNA binding cleft is boxed in black solid squares in b and e, and is magnified in c and f. In g, only the model of m7GpppA is shown, with the RNA chain hidden to better reveal the cap binding site underneath the non-template RNA binding cleft. h, Magnified views of the area in the dotted red square in b and e. Electrostatic surface renderings show the template RNA entry channel in the quiescent (upper) and initiation (lower) states. i, Magnified and rotated view of the area in the solid black square in d, with the density (semi-transparent grey) and atomic model (colored sticks) of the initial template-transcript complex inside the polymerase core shown alongside the ribbon model of the RdRp. The priming loop (red) of the RdRp and Mg2+ (green balls) are highlighted. j, Comparison of the priming loop in both the quiescent and initiation states.
A complete transcription bubble reveals RNA trajectories during elongation.
We captured a complete transcription bubble in a brand-new 3.5 Å RdRp structure (Figs. 1f,h, 2c and 4 and Supplementary Video 3), different from RdRp structures in the quiescent state and the initiation state described above (Fig. 3). This structure reveals detailed trajectories of the different RNA strands during transcript elongation (Fig. 4).
Fig. 4 |. Structures of RdRp and complete transcription bubble in the elongation state.
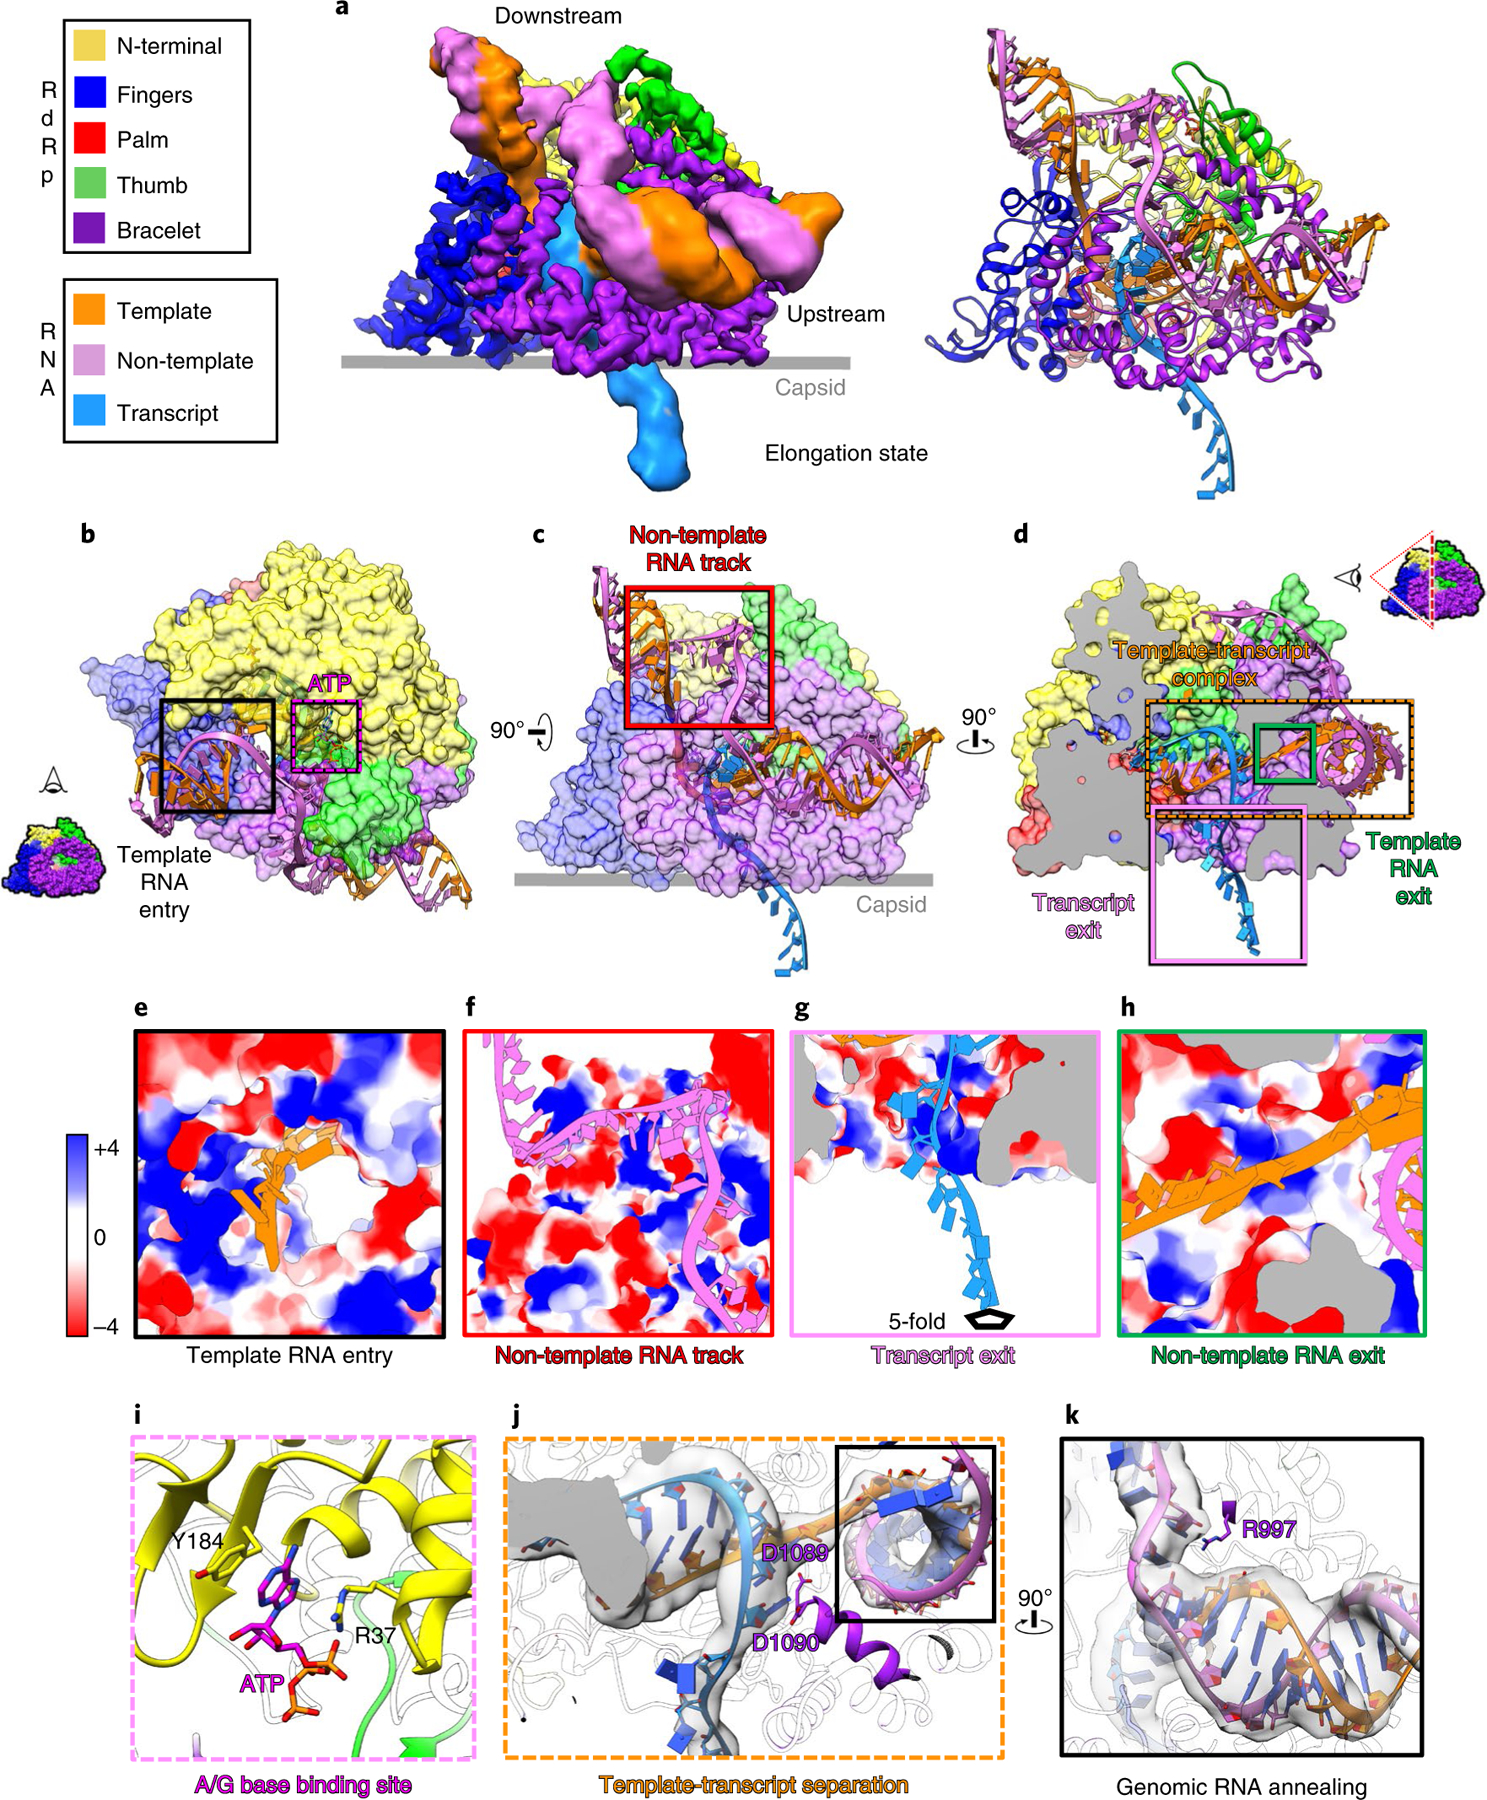
a, Density map (left) and ribbon model (right) show the RdRp and transcription bubble in the elongation state. b–d, Models of RdRp (surface representation) and RNA (ribbon), in different perspectives, showing RNA trajectories. e–h, Magnified views of boxed areas in b–d, rendered as electrostatic surfaces showing the positively charged RNA movement tunnels and track. Edge colors match the boxes in b–d. i, Magnified views of the area in the purple box of b, rendered as ribbons and sticks, showing where an ATP or GTP (modeled here in sticks as an ATP) binds to the A or G base-binding site. j, The template-transcript complex inside the polymerase core, separated and guided by residues D1089 and D1090. k, Magnified and rotated view of boxed area in j, showing that the template RNA re-anneals with the non-template RNA, guided by R997. Insets in b and d illustrate the viewing direction of the displayed RdRp-RNA complex.
The downstream RNA in the transcription bubble observed in the elongation state and the capped-terminal RNA observed in the initiation state are located at a similar position on the RdRp (Fig. 4a,d). The template RNA navigates through the positively charged template RNA entry tunnel in order to synthesize the nascent transcript inside the polymerase core (Fig. 4e,j and Extended Data Fig. 4f). Unlike in the initiation state, non-template RNA no longer binds inside the non-template RNA binding cleft (Fig. 3f), but slides through the positively charged non-template RNA track located outside the RdRp (Fig. 4f); instead of the first A of non-template RNA (Fig. 3f), an ATP/GTP binds to the A/G base binding site (Fig. 4i). Inside the polymerase core, the new synthesized transcript and template RNA form an 8-base-pair A-form dsRNA, which then is separated at the 9th base pair by the negatively charged residues of the bracelet domain, D1089 and D1090 (Fig. 4j). D1089 guides the template RNA through the positively charged template RNA exit tunnel (Fig. 4h), and D1090 guides the nascent transcript released from the positively charged transcript exit tunnel (Fig. 4j). A similar template RNA-transcript separation mechanism in rotavirus has been reported11. Outside the polymerase core, the non-template RNA re-anneals with the template RNA. During reannealing, both strands are guided by R997. The reannealed A-form dsRNA becomes the upstream dsRNA (Fig. 4k). In addition, the upstream RNA of the transcription bubble observed here and the previously defined ‘bound dsRNA’ observed in the quiescent state are located at the same position and bind to RdRp, both through residue R997 (Extended Data Fig. 5)8. Because the last bit of the reannealed RNA would become the tail-terminal dsRNA after a round of transcription finished, we suggest that the ‘bound dsRNA’ is the tail-terminal dsRNA, namely the other end of the genomic RNA relative to the capped-terminal RNA (Extended Data Fig. 1b).
After capturing the three general functional states of RdRp, we attempted to identify intermediate states to reveal further details between initiation and elongation of RNA synthesis. On the basis of the sequences of the CPV genomic RNAs, we treated CPV samples with a buffer containing SAM, GTP, ATP and UTP (SGAU-CPV) in order to halt transcription at the position where the first C appears (positions 8 and 20 in segments S9 and S1, respectively, producing transcripts of 7–19 nt). In one of the subparticle reconstructions of the SGAU-CPV sample (Supplementary Table 1), we captured an RdRp structure with an 8-base-pair template-transcript complex inside the polymerase core (Extended Data Fig. 4e), and the non-template RNA strand that is immobilized by the non-template RNA binding cleft (Fig. 2e). The double-stranded region of this RNA is not modeled owing to low resolution.
Previous biochemical assays have shown that abortive initiation, which only synthesizes two-base oligonucleotides, is the only discernable step between the initiation and elongation stages31. However, owing to the absence of CTP in the SGAU-CPV sample, we assert that the structure we captured has already passed the abortive initiation stage and paused at the early stage of RNA elongation; thus, we interpret this structure as being in the early-elon-gation state.
The dynamic bracelet domain and thumb subdomain act as RNA ‘traffic indicators’.
Comparison of the structures of RdRp shows that the largest conformational changes occur in the bracelet domain and thumb subdomain (Extended Data Fig. 6 and 7, Supplementary Video 4). Within the bracelet domain, dynamic regions can be divided into two sections: module A (aa 912–1010) and module B (aa 1067–1140), the definitions of which are refinements of previous designations8. Conformations of module A can be simplified to ‘stiffened’ and ‘relaxed, statuses identified by the helical turn number of the α-helix in module A (Extended Data Fig. 7). Conformations of module B can similarly be simplified to ‘covering’ and ‘uncovering’, indicated by whether module B is exposing the transcript exit tunnel (Extended Data Fig. 6a–d). Likewise, the conformation of the thumb subdomain can be simplified to two statuses: ‘open’ and ‘closed’ (Extended Data Fig. 6a–d). In the quiescent state, the thumb is open (Extended Data Fig. 6a). In the initiation state, the thumb rotates 3.5° from its position in the quiescent state towards the direction of the palm and the N-terminal, becoming closed (Extended Data Fig. 6b,e). The thumb remains closed in the early-elongation state (Extended Data Fig. 6c,f). In the elongation state, the thumb rotates 4° away from the palm and N-terminal, opening the thumb (Extended Data Fig. 6d,g). With these simplified descriptions, we can divide the conformational changes of RdRp into three steps: from quiescent to initiation state, the thumb closes, module A stiffens and module B changes conformation but still covers the transcript exit tunnel; from initiation to early-elongation state, module B uncovers from the transcript exit tunnel; and from early-elongation to elongation state, the thumb opens, and module A relaxes (Figs. 5 and 6a and Supplementary Table 1).
Fig. 5 |. Conformational changes of the bracelet domain and the thumb control movement of different RNA strands.
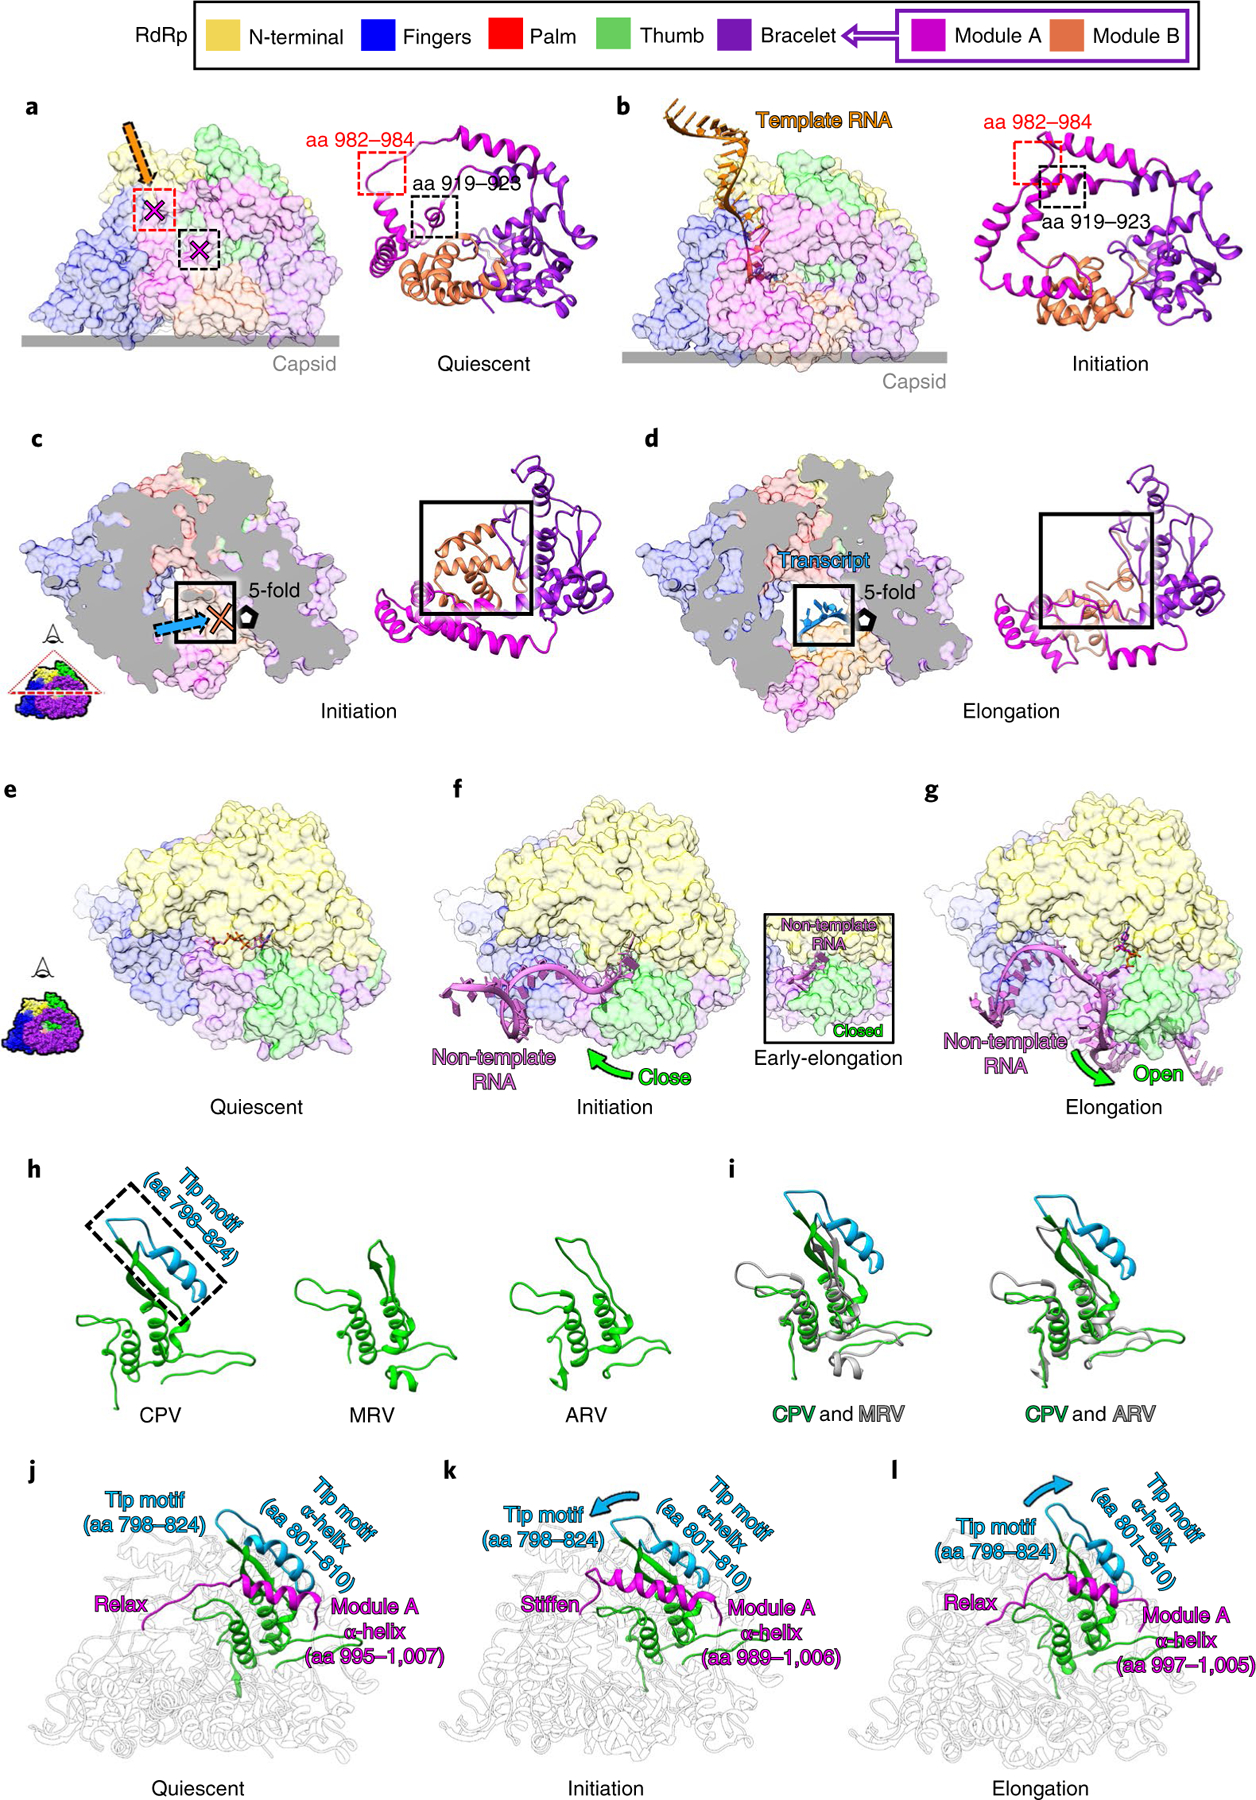
a,b, Conformational changes of module A regulate the template RNA entry tunnel and the polymerase active site. The template RNA entry tunnel and active site are blocked by module A of the bracelet domain in the quiescent state (a) and open in the initiation state when module A refolds (b). c,d, Conformational changes of module B regulate the transcript exit tunnel. The transcript exit tunnel is blocked by module B in the initiation state (c) and opens in the elongation state (d). e–g, Non-template RNA (ribbon) interacts with RdRp (surface representation) in the quiescent (e), initiation (f), early-elongation (inset) and elongation (g) states. h,i, Ribbon models of the thumb subdomains of CPV, mammalian reovirus (MRV), and aquareovirus (ARV) (h) and their superpositions (i), showing that only CPV has a tip motif. j–l, Ribbon models of RdRp in the quiescent (j), initiation (k) and elongation (l) states, highlighting in color the co-varying conformations of the tip motif of the thumb as it interacts with module A of the bracelet domain.
Fig. 6 |. Schematic illustrating state transitions and ouroboros model of de novo transcription.
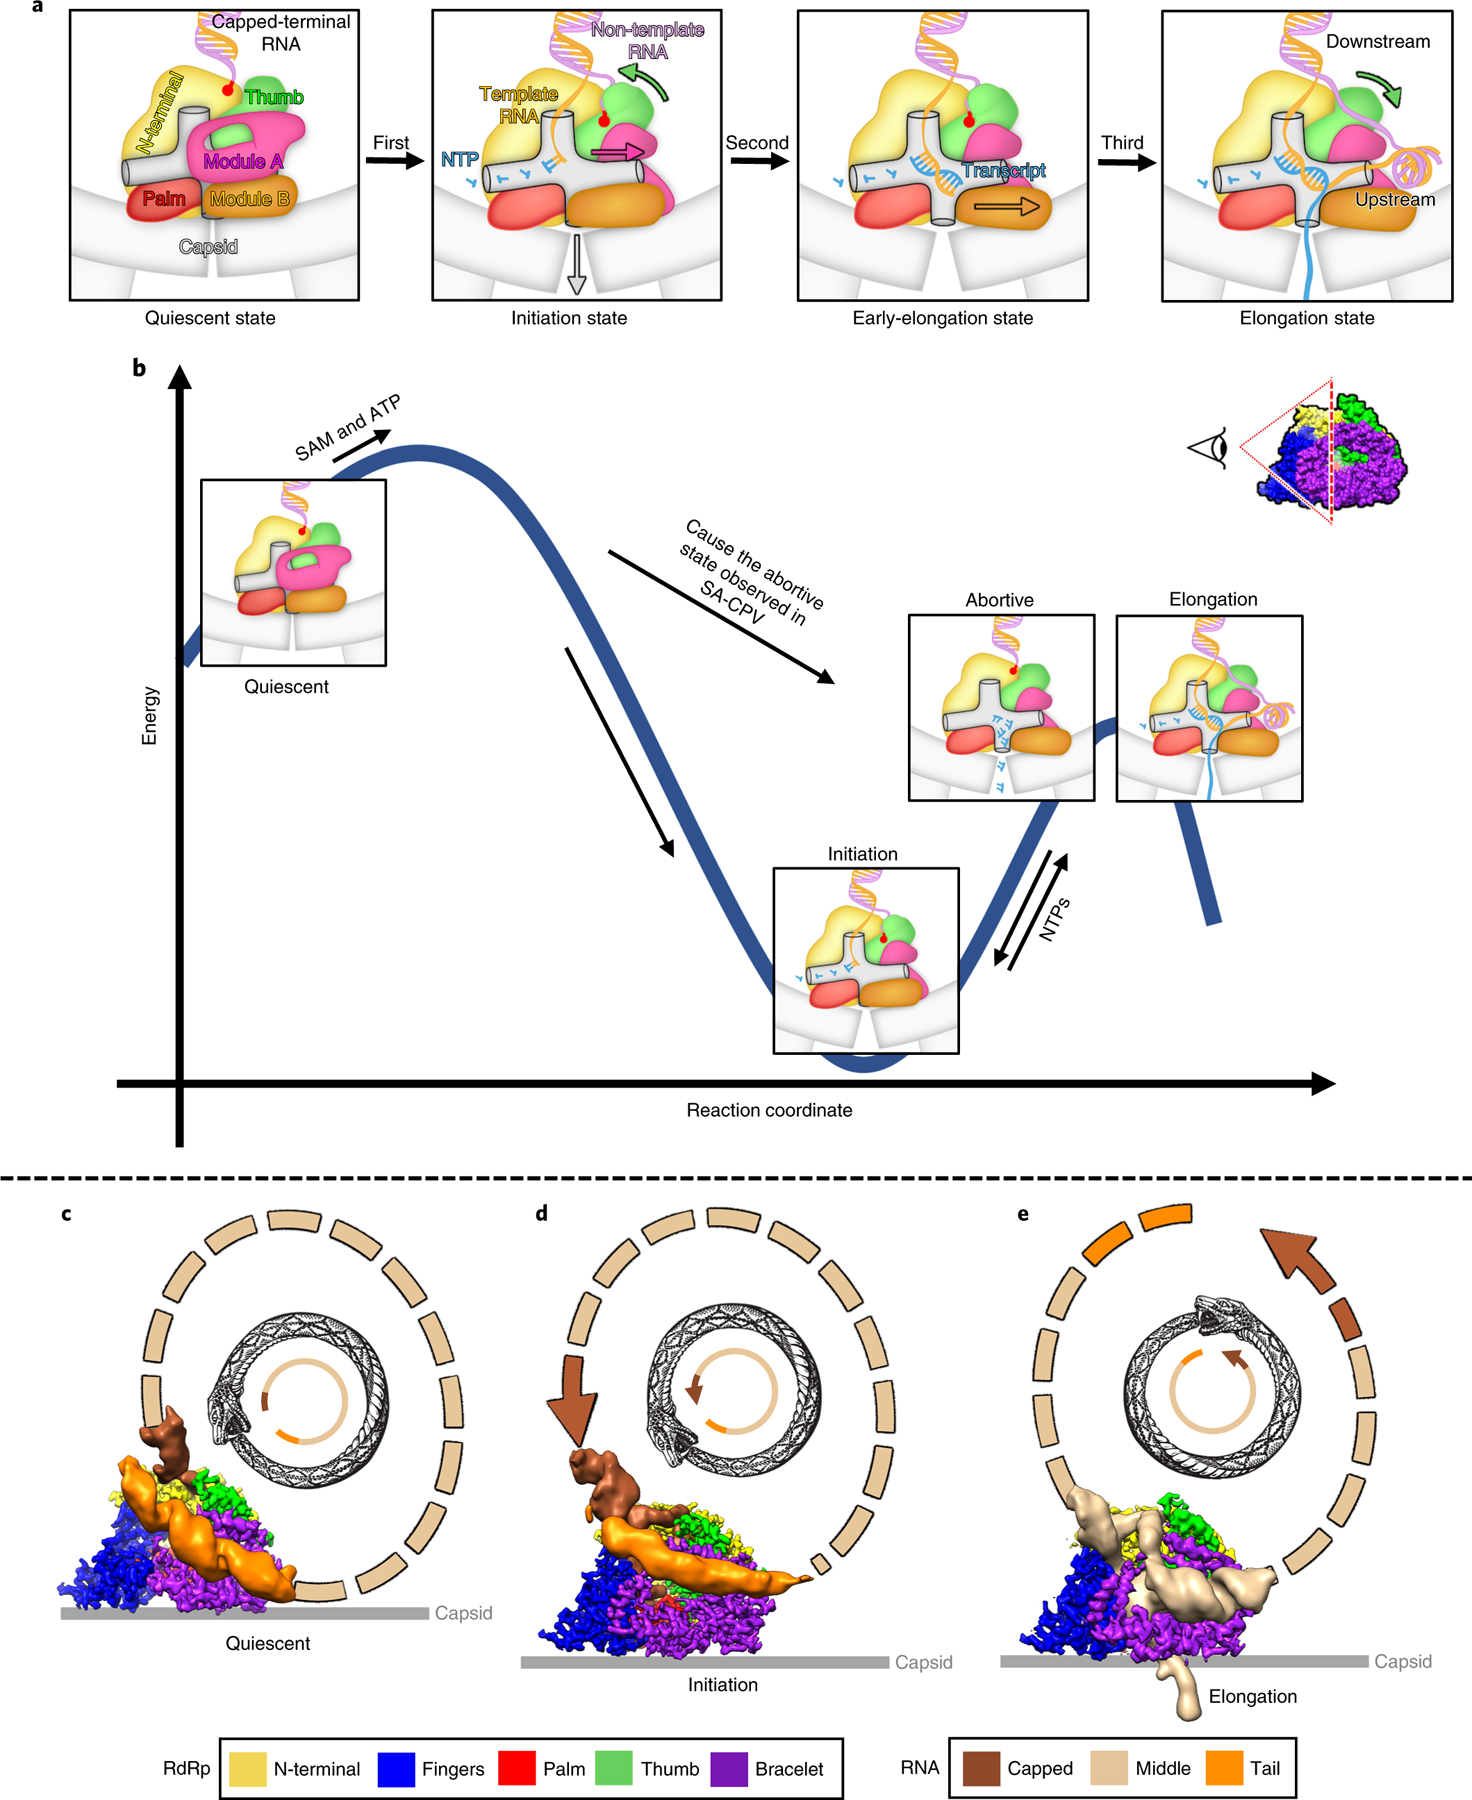
a, Overview of the three-step conformational changes of RdRp with RNA during transcription. Colored arrows in the illustrations denote the direction of the conformational changes of the arrows’ color matched domains. b, Free-energy profile and state transition for the four states of RdRp during transcription. c–e, Ouroboros model of CPV transcription depicting the trajectory of genomic RNA in the quiescent (c), initiation (d) and elongation (e) states. Inset between a and b illustrates the viewing direction of the RdRp depicted in various steps in both a and b.
Conformational changes occur on the bracelet domain of RdRp throughout the entire transcription process of CPV (Extended Data Figs. 6 and 7 and Supplementary Table 1). In the quiescent state, the template RNA entry tunnel and the active site are blocked by module A: several loop residues (aa 982–984) block the template RNA entry tunnel, and an α-helix (919–923) occupies the active site (Fig. 5a). In the initiation state, module A refolds, unblocking and exposing both the template RNA entry tunnel and the active site (Fig. 5b). These conformational changes allow the template RNA to enter the active site through the template RNA entry tunnel, meet with NTPs and start de novo initiation (Figs. 2b, 3i and 5b and Supplementary Table 1). Module B also moves during the conformational changes of the bracelet domain: it covers the transcript exit tunnel during both the quiescent and initiation states (Fig. 5c and Extended Data Fig. 6a,b) and uncovers the transcript exit tunnel in the early-elongation and elongation states (Fig. 5d and Extended Data Fig. 6c,d). Thus, in the elongation state, the nascent transcript is synthesized, separated from the template RNA and released from the newly opened transcript exit tunnel (Fig. 5d). These observations indicate that module A of the bracelet domain is the kinetic barrier of the template RNA trajectory in the quiescent state, and module B is the kinetic barrier of the transcript trajectory in the initiation state. Both of them act as RNA ‘traffic indicators’, allowing their respective RNAs to pass only when appropriate conditions are met. In addition, comparisons of the RdRp structures at the initiation, early-elongation and elongation states show that the conformational changes of module A and module B do not occur simultaneously (Extended Data Figs. 6f,g and 7b–d and Supplementary Table 1), suggesting that module A and module B are regulated independently.
Module B also acts as a kinetic barrier to the movement of the template and transcript within the polymerase core, utilizing a switch loop of module B (aa 1080–1090) with the priming loop of the palm subdomain (aa 516–529) (Extended Data Fig. 4d–f). In the initiation state, the priming loop stabilizes the initial nucleotides at the active site; the switch loop sits close by, located at the pathway of the template and transcript (Extended Data Fig. 4d). In the early-elongation and elongation states, as module B undergoes conformational changes, the switch loop moves away from the priming loop, curls up and forms part of the transcript exit tunnel. The priming loop also changes conformation, making room for the movements of the template and transcript (Extended Data Fig. 4e–g). These observations indicate that the conformational changes of the switch loop and the priming loop allow the template and transcript to proceed, suggesting that the switch loop and priming loop might control the transition from the initiation state to the elongation state.
RdRp that undergo conservative transcription, such as those in Reoviridae, include a unique template-RNA and non-template-RNA annealing step not seen in other RNA polymerases. This step indicates that non-template RNA requires precise regulation in order to facilitate the transcription process. In our data, we observed a high correlation between the conformational changes of the thumb and the motion of the non-template RNA. In the quiescent state, the thumb remains open, the capped-terminal RNA remains double-stranded and the RNA cap attaches to the N-terminal domain (Figs. 3a–c and 5e). In the initiation state and early-elongation state, the 5′ end of non-template RNA inserts into the non-template RNA binding cleft (Figs. 3d–f and 5f), the RNA cap binds to the cap-binding site (Fig. 3g) and the thumb closes to immobilize the first four bases of the non-template RNA (Figs. 3f and 5e,f). In the elongation state, the thumb opens again, and the 5′ end of the non-template RNA releases from the non-template-RNA binding cleft and anneals with the template RNA (Figs. 4 and 5g and Extended Data Fig. 6g). These observations indicate that the thumb subdomain functions as a clamp of the non-template RNA. This clamp immobilizes non-template RNA inside the non-template RNA binding cleft when the thumb closes and releases the non-template RNA when the thumb opens.
The RdRp of CPV has a larger thumb subdomain than other reoviruses (Fig. 5h,i)10,32,33. Compared with mammalian reovirus (MRV) and aquareovirus (ARV), most parts of the thumb are conserved, but an additional ‘tip’ motif (aa 798–824) is located at the top of the thumb subdomain of RdRp (Fig. 5h,i). As noted earlier, the statuses of the thumb and module A change simultaneously: in the quiescent and elongation states, when module A relaxes, the thumb opens (Fig. 5j,l, Extended Data Figs. 6 and 7 and Supplementary Table 1); in the initiation and early elongation states, when module A is stiffened, the thumb is closed (Fig. 5k, Extended Data Figs. 6 and 7 and Supplementary Table 1). The most significant conformational changes of the thumb occur on the thumb’s tip motif, which interacts with module A through a helix-helix interaction between aa 801–810 of the tip motif and the aa 996–1006 of module A (Fig. 5j–l). Of the entire thumb domain, the tip, being furthest from the pivot point where the thumb meets the palm, moves the most during conformational changes (Extended Data Fig. 6e–g). In addition, the position of the thumb is directly related to the variable lengths of the tip-domain-interacting α-helix of module A (Fig. 5j–l). Because the conformations of module A and the thumb co-vary, they are likely regulated simultaneously by a force from the same source (see Supplementary Discussion).
Discussion
The five conformations of CPV in situ structures (Fig. 2 and Supplementary Table 1) reveal conformational changes of the thumb subdomain and bracelet domain of RdRp (Fig. 5 and Extended Data Fig. 6 and 7) and answer several long-standing questions pertaining to viral endogenous transcription.
Our in situ structures of four sequential states illustrate how RdRp undergoes three-step conformational changes during transcription (Fig. 6a, Supplementary Video 4). In the quiescent state, two major kinetic barriers block the RNA passing tunnels inside the RdRp: module A of the bracelet domain blocks the template RNA entry tunnels and the active site, and module B of the bracelet domain covers the transcript exit tunnel. When the SAM and ATP bind with the TP of the CPV capsid, the TP and the CSP-A change conformation and the capsid expands at the five-fold vertices (Supplementary Fig. 3)8,19. Accompanying the capsid expansion, the first step of the conformational changes of RdRp occurs: CPV transforms from the quiescent state into the initiation state, in which capped-terminal RNA unwinds. Module A refolds and exposes the template RNA entry tunnel and polymerase core; template RNA enters the active site and starts de novo initiation; the non-template RNA inserts into the non-template RNA binding cleft and the RNA cap binds to the cap-binding site, and the thumb domain closes to immobilize the 5′ end of the non-template RNA. In the second step, CPV transforms into the early-elongation state. Module B moves its switch loop away from the transcript exit tunnel, allowing the template and transcript to move on. In the third step, CPV transforms into the elongation state. The thumb opens, and the non-template RNA pulls out from the non-template RNA-binding cleft and the cap-binding site, annealing with the template RNA outside of the template RNA exit tunnel.
Once the dsRNA virion enters the host cell, viral transcription is executed continuously. The numerous states captured in our in situ sub-particle reconstructions (Fig. 6a) allow us to explain how these conformational changes regulate de novo transcription and to establish a new model of state transition during endogenous transcription of dsRNA viruses (Fig. 6b). Among the five conformations resolved in our sub-particle reconstructions, the most provocative assignment is probably the one we have termed as the abortive state, whose RdRp structure is similar to that of the elongation state (Fig. 2d and Extended Data Fig. 8). Previous biochemical studies have demonstrated the existence of abortive initiation during transcription in dsRNA viruses, in which RNA synthesis begins but is cut off before it can proceed into elongation31,34,35. During the initiation state, accumulated short aborted transcripts need to be ejected through the transcript exit tunnel to prevent blockage of the active site during RNA synthesis. Thus, module B moves away from and uncovers the transcript exit tunnel and allows the abortive transcripts to be released, as illustrated in Fig. 6b.
The primary question this movement of module B raises, however, is how it occurs at all. This question can be answered from the viewpoint of state transitions of RdRp during endogenous transcription (Fig. 6b), akin to multiple-conformation transitions in cellular RNA polymerase36,37. After SAM and ATP together trigger capsid expansion at the five-fold vertices, module B has space to change conformation (see the ‘An environmental signal transmission path from the external to the internal capsid‘ section in Supplementary Information), and module B will thus spontaneously change conformation to a lower energy form, that is, the initiation state (Fig. 6b). When transcription begins, the RdRp transforms into either the abortive or elongation state, indicated by whether or not the RdRp elongates the transcript. If the RdRp fails to elongate the transcripts, it likely would cycle between initiation state and abortive state until the RdRp succeeds in elongating the transcript, that is, early-elongation to elongation state (Fig. 6b). After transcript elongation finishes, module B of RdRp will revert to its low-energy form, the initiation state, and start the next cycle of transcription (Fig. 6b).
In order for this recurring transcription to occur, RNA must repeatedly cycle through the RdRp as the protein changes conformations. We propose that the simplest way for RNA to undergo continuous transcription is to have the capped-terminal follow the tail-terminal. The question remains, however, of whether or not the capped-terminal RNA and tail-terminal dsRNA that interact with the same RdRp also belong to the same segment of genomic RNA (Extended Data Fig. 9a,b). One possibility is that the capped-terminal RNA and tail-terminal dsRNA that interact with the same RdRp belong to different segments (Extended Data Fig. 9a). In this model, the ten segments of genomic RNA are organized in a particular way, with one capped-terminal RNA following the tail-terminal of another RNA; after each round of transcription, each segment of genomic RNA exchanges positions with the next one. But this hypothesis causes a problem: during transcription, because the lengths of the various segments of RNA are not the same, the duration of transcription is also not the same. Therefore, unless transcription of the ten segments of genomic RNA are somehow regulated to end at the same time, the differences in duration will cause an RNA ‘traffic jam, decreasing the efficiency of transcription (Extended Data Fig. 9a). Thus, the more efficient mechanism is to let transcription run independently, with each RdRp responsible for one particular genomic RNA. Therefore, the capped-terminal RNA and tail-terminal dsRNA must belong to the same genomic RNA (Extended Data Fig. 9b): each individual cap chases its tail, like an ouroboros. This ouroboros model is supported by our subparticle reconstruction results, which show that the subparticles used to reconstruct the RdRp in different states can exist in the same particle, suggesting that different RdRps in the same virion are regulated independently (Extended Data Fig. 9c). Previous biochemical studies also suggest that the ten segments of the CPV genomic RNA are transcribed independently31, further supporting our cyclic model of independent endogenous conservative transcription in dsRNA viruses (Fig. 6c–e).
In conclusion, integration of numerous structural conformations captured in seven experimental conditions support a model of de novo transcription in CPV triggered by SAM and ATP. When the CPV virion enters the cell, the externally located TP ‘detects’ SAM and ATP, triggering the capsid expansions at the five-fold vertices. Inside the capsid, the carboxy-terminal loop of the RdRp moves away, making room for module B of the bracelet domain to open the transcript exit tunnel (see the ‘An environmental signal transmission path from the external to the internal capsid‘ section in Supplementary Information). The capped-terminal RNA unwinds and the tail-terminal dsRNA moves away from the RdRp, which makes space for module A to refold and close the thumb (Extended Data Fig. 5); the tip motif of the closed thumb then immobilizes the non-template RNA of the capped-terminal RNA inside a binding cleft (Figs. 3e–g and 5f). The template RNA enters the polymerase core through the template RNA entry tunnel and starts RNA synthesis (Fig. 3e,h,i). Upon tail-terminal dsRNA departing and thumb opening, the non-template RNA leaves its binding cleft and anneals with the template RNA (Fig. 4k). RNA elongation continues until the next round of transcription, which starts from the initiation state (Fig. 6b). This endless transcription cycle, following an ouroboros ‘circle of life’ described above (Fig. 6c), leads to a multiplicity of new viruses in a precisely regulated chain reaction.
Methods
CPV sample purification.
To capture different states of the CPV transcription reaction, we prepared a quiescent buffer (70 mM Tris-Cl (pH 8.0), 10 mM MgCl2, 100 mM NaCl) and 6 reaction buffers, the latter by adding to the quiescent buffer various substrates, including 1 mM SAM (S-buffer), 1 mM SAM + 2 mM GTP (SG-buffer), 1 mM SAM + 4 mM ATP (SA-buffer), 1 mM SAM + 2 mM GTP + 4 mM ATP (SGA-buffer), 1 mM SAM + 2 mM GTP + 4 mM ATP + 2 mM UTP (SGAU-buffer), or 1 mM SAM + 2 mM GTP + 4 mM ATP + 2 mM UTP + 2 mM CTP (transcribing/t-buffer).
CPV particles were purified as described previously18. Briefly, BmCPV (Bombyx mori CPV-1, isolated from South China Agricultural University in Guangzhou, China) containing polyhedra were treated with 0.2 M Na2CO3-NaHCO3 buffer (pH 10.8) for 60 min, then centrifuged at 10,000g for 40 min to remove large substances. The supernatant was centrifuged at 80,000g for 60 min to pellet the CPV virions. The resulting pellets were re-suspended in the seven above-described buffers, and incubated at 31 °C for 15 min. The reactions were stopped by quenching the samples on ice at 0 °C, and the resulting samples were used for cryoEM sample preparation.
CryoEM sample preparation and image acquisition.
An aliquot of 2.5 μl of each of the above-described samples was applied onto a Quantifoil holey carbon grid (R2/1, 300 mesh), which was glow-discharged for 30 s with a PELCO Easy Glow system. The grid was blotted with filter paper to remove excess sample, then plunge-frozen in a mixture of ethane and propane (mix ratio around 1:2 by volume) liquid with a manual plunger. The frozen grids were stored in liquid nitrogen before use.
Frozen-hydrated cryoEM grids were loaded into an FEI Titan Krios electron microscope equipped with a Gatan imaging filter (GIF) Quantum system and a post-GIF K2 Summit direct electron detector. The microscope was operated at 300 kV, and the GIF slit was set to 20 eV. Movies were recorded as dose-fractionated frames with Legion3.1 (ref.38) (for G-CPV, S-CPV, SG-CPV, SGA-CPV, SGAU-CPV) or SerialEM39 (for q-CPV, SA-CPV), at either ×130,000 nominal magnification in super-resolution mode (for all CPV samples except t-CPV, corresponding to a calibrated pixel size 0.531 Å on the specimen level) or ×105,000 nominal magnification in counting mode (for t-CPV, corresponding to a calibrated pixel size 1.36 Å on the specimen level), and the defocus was set to −1.0 to −2.3 μm. During data collection, each movie was recorded with an exposure time of 8 s and an accumulated dosage of about 40–50 electrons per Å2, which was fractionated into 40 frames each with 0.2 s of exposure time.
Capturing high-resolution in situ structures of multiple conformations in seven experimental conditions has necessitated an unprecedented image acquisition effort. In total, we spent 43 d on the Titan Krios to record the 47,147 movies used for the structures reported here, including 10,587 movies of the q-CPV sample, 3,042 movies of the S-CPV sample, 3,238 movies of the SG-CPV sample, 6,234 movies of the SA-CPV sample, 14,186 movies of the SGA-CPV sample, 4,953 movies of the SGAU-CPV sample and 4,907 movies of the t-CPV sample. Details of the experimental conditions and image data are summarized in Supplementary Table 1.
Motion correction and pre-processing.
Except for the t-CPV dataset, movies were processed with MotionCor2 (ref.40) with a subframe 5 × 5 and 2X binned (final pixel size, 1.062 Å) to generate both dose-weighted (used for final reconstruction) and dose-unweighted (used for manual screening, CTF determination and particle picking) averaged micrographs. For the movies of the t-CPV sample, we used MotionCor41 for alignment and motion correction and generated two micrographs for each movie, one (used for manual screening, CTF determination and particle picking) by averaging all aligned frames and the other (used for final reconstruction) by averaging only the first 20 frames (corresponding to a total dosage of ~20 electrons per Å2 on sample level). Defocus determination was done with ctffind4.1.10 (ref.42) and particle picking with Ethan43. Micrographs with ice contamination or defocus value outside the range −0.8 to −3 μm were discarded. A total of 9,422 micrographs of the q-CPV sample, 2,766 micrographs of the S-CPV sample, 2,939 micrographs of the SG-CPV sample, 4,521 micrographs of the SA-CPV sample, 12,027 micrographs of the SGA-CPV sample, 3,908 micrographs of the SGAU-CPV sample and 4,725 micrographs of the t-CPV sample were selected and phase-flipped using Bsoft44 for subsequent in-depth data processing.
Sub-particle 3D classification and reconstruction of TEC-containing vertices.
After examining the asymmetric reconstructions (Extended Data Fig. 1, see Supplementary Note) of the whole CPV particles, we noticed that the densities in some regions of the RdRp were of weaker or poorer quality than others. We realized that this could be because the RdRp structures resolved inside are likely a mixture of different conformations. To evaluate this possibility and to sort out multiple conformations of RdRp across particles under the same experimental condition or even within the same particle, we carried out subparticle reconstructions of TEC-containing vertices using a workflow outlined in Extended Data Fig. 2. The subparticle reconstruction workflows used to process CPV images obtained from different experimental conditions are the same with very minor differences detailed below; therefore, we will only describe the workflow for SGA-CPV here, though the workflows for all samples are detailed, one after another, in Extended Data Fig. 2. The workflow consists of six steps, as described below.
The first step of our subparticle workflow is to extract subparticles from the original micrographs (Extended Data Fig. 2 step 1). To define the positions of vertex subparticles on all CPV particle images, we took advantage of the D3 reconstructions obtained in the Extended Data Fig. 1, step 3, to locate the 12 vertices. We separated the 12 vertex subparticles into two groups: polar (the six nearer to the three-fold axis) and tropical (the six farther away from the three-fold axis). Since the ten good classes contain the aforementioned nearly equivalent CPV particles, we used the ‘Subset Selection’ tool to choose one class whose reconstruction orients in such a way that one of its polar vertices is in close proximity to the positive z-axis so we could easily estimate its coordinates (for example, x = 0, y = 0 and z = 56 pixel in the bin4 map) in the map. The coordinates for this polar vertex and the refined STAR file of the selected class were then used as the input to run Relion ‘Particle extraction’ tool and extract six polar sub-particles from every virion particle (using the micrograph STAR file). Likewise, we chose one class whose reconstruction orients in such a way that one of its tropical vertices is in close proximity to the positive z-axis to extract the six tropical subparticles for all particles. For SGA-CPV, we extracted 1,084,284 polar subparticles and 1,084,260 tropical subparticles that were listed in the subparticle data STAR files.
The second step of our subparticle workflow is to obtain one subparticle reconstruction from the combined polar and tropical subparticles by using Relion 3D refinement (Extended Data Fig. 2, step 2). Although the overall resolution of this subparticle reconstruction reached 2.6 Å, the densities for the TEC-RNA region were not as good as those of the capsid proteins, suggesting that, while the capsid proteins were well refined, the TEC-RNA region still contained mixed conformations.
The third step of our subparticle workflow is to obtain capsid-subtracted subparticles so that our subsequent 3D classification would focus on signals from the TEC-RNA region (Extended Data Fig. 2 step 3). This is particularly important because TEC occupies a relatively small volume compared with capsid proteins, and this step would minimize the symmetrically arranged capsid proteins’ influence during classification steps. We used Relion’s ‘Particle subtraction’ tool to obtain subtracted subparticles by subtracting from original subparticles, obtained in the first step, by the projection of the internally masked (that is, densities inside of the mask set to zero) subparticle reconstruction that was obtained in the second step.
The last three steps of our subparticle reconstruction workflow involve performing 3D classification of capsid protein-subtracted subparticles, and sorting out and reconstructing different structural conformations of the RdRp (Extended Data Fig. 2, steps 4–6). We ran Relion ‘3D classification’ using the option ‘-skip_align’ with the data STAR files of either the polar or the tropical subtracted subparticles, requesting for six classes (steps 4 and 5). Two different conformations of RdRp were obtained from the polar subtracted sub-particles, corresponding to the initiation state (classes 1, 2, 3) and abortive state (classes 4, 5, 6) (Extended Data Fig. 2, step 4a). From the tropical subtracted subparticles, we obtained the same conformations, the initiation state (classes 3, 4, 5) and abortive state (classes 1, 2). The map of class 6 (33.8% particles) from the tropical subtracted subparticles did not contain a TEC (corresponding to the two empty vertices of Extended Data Fig. 1b left panel) and was discarded (Extended Data Fig. 2, step 4b). The subparticles belonging to the good classes 2 and 3 in the polar subparticles were subjected to another round of 3D classification using the option ‘-skip_align’ by requesting four classes (Extended Data Fig. 2, step 5a). The two good classes with clear double-stranded capped-terminal RNA densities were combined and the corresponding raw subparticles subjected to 3D refinement and post processing, yielding a final map of the initiation state at a resolution of 2.9 Å (Extended Data Fig. 2, step 6a). The polar and tropical subtracted subparticles belonging to the abortive state were combined and subjected to another round of ‘3D classification’ using the option ‘-skip_align’ by requesting six classes (Extended Data Fig. 2, step 5b). The five good classes (classes 1–5 in the red boxes) were selected and the corresponding raw subparticles subjected to 3D refinement and post processing, yielding a final map of the abortive state at a resolution of 2.8 Å (Extended Data Fig. 2, step 6b). This map was used for atomic model building. To obtain the best-quality density map for the capped-terminal RNA, the entire process from steps 1 to 6 was applied to particles located only underneath position 9 (as defined in Extended Data Fig. 1b) to obtain a subparticle reconstruction. The density of the capped-terminal RNA in this map is shown in Fig. 2b.
The same sub-particle workflow applied to SG-CPV, S-CPV and q-CPV yielded a single (quiescent) state structure at resolutions of 3.0 Å, 3.1 Å and 3.1 Å, respectively (Extended Data Fig. 1a). The densities of the capped-terminal RNA shown in Figs. 2a and 3a,b and Extended Data Fig. 1b are all from position 9 in the asymmetric reconstruction of SG-CPV. Three conformations were obtained from SA-CPV, corresponding to the quiescent state (3.2 Å resolution), abortive state (3.5 Å resolution) and initiation state (3.4 Å resolution) (Supplementary Fig. 1b). From SGAU-CPV, we captured the initiate state (3.3 Å resolution) and a new intermediate state, named the pre-elongation state (3.4 Å resolution), and we also observed the quiescent and abortive states in the subtracted subparticle 3D classification results (Supplementary Fig. 2a). From t-CPV, we captured the elongation state (3.5 Å resolution) and observed the quiescent, initiation and abortive states in the subtracted subparticle 3D classification results (Supplementary Fig. 2b).
All resolutions reported above are based on the ‘gold standard’ refinement procedures and the 0.143 Fourier shell correlation criterion. Local resolution was estimated using Resmap45.
Atomic model building, model refinement and 3D visualization.
We manually modeled the RNA structures with COOT46. For modeling the capped-terminal RNA and RNA transcription bubble, an ideal A-form dsRNA model was created with the ‘Ideal DNA/RNA’ utility in COOT and fitted into the double stranded regions of the capped-terminal RNA and transcription bubble. The single-stranded RNA regions were modeled manually with the ‘add Terminal Residue’ utility in COOT.
Protein model building and model refinement were carried out by following a previously detailed procedure47. The procedure involves manual modeling with COOT46 and real-space refinement with Phenix48.
To model the RdRp structures in the quiescent and initiation states obtained here, we fitted our previous RdRp, in q-CPV (protein data bank (PDB) accession number 3JB6) and t-CPV (PDB accession number 3JB7), into the new cryoEM density maps of quiescent and initiation states, respectively. These two structures were then rebuilt with various utilities of COOT. In general, each residue was inspected and modified with ‘Real Space Refine Zone’ and ‘Regularize Zone’ manually. In several regions that fit less well, the structures of these regions were first interpreted manually; if these regions were formed as secondary structures, ‘Place Helix Here’ and ‘Place Strand Here’ were used to create a poly-alanine α-helix or β-strand in that location. Each of these polyalanine α-helixes or β-strands was mutated to the correct sequence with ‘Simple Mutate’ to create a crude atomic model, which was then fit into the cryoEM map with ‘Real Space Refine Zone’ and ‘Regularize Zone’. If these regions were interpreted as loops, we used ‘add Terminal Residue’ to model the loops manually, and ‘Real Space Refine Zone’ and ‘Regularize Zone’ to fit the model into the cryoEM map and refine the model.
To model the RdRp in the elongation state, we fitted our RdRp model of the initiation state obtained above into the cryoEM density map of the elongation state and then identified regions that did not fit. These regions were then modeled using various utilities in COOT as follows. First, these regions were processed with ‘map skeleton’ to generate a skeleton, then were manually modeled as a Cα trace, one residue at a time, with ‘C-alpha Baton Mode’ based on the skeleton. We then transformed the ‘Baton Atoms’ from the Cα trace into polyalanine chains with ‘Cα Zone → Mainchain’. Each of these polyalanine mainchain chains was mutated to the correct sequence with ‘Simple Mutate’ to create a crude atomic model, which was then fit into the cryoEM map with ‘Real Space Refine Zone’ and ‘Regularize Zone’. The RdRp model of the elongation state was used as the template to rebuild the RdRp of the early-elongation and abortive states, then was rebuilt as described in the previous paragraph to construct the RdRp of the quiescent and initiation states.
To refine all five atomic models, we used the ‘Ramachandran plot’ utility in COOT to identify ‘outliers’; these residues and their surrounding residues were refined with the ‘Regularize Zone’ utility in COOT until the Ramachandran outlier value was below 0.1%. These models were further refined in Phenix with ‘Real space refinement’. After the model refinement with Phenix, models were uploaded to the ‘wwPDB Validation Service’ of the wwPDB website, and the atomic models were refined further on the basis of the validation reports produced by the wwPDB. Model statistics are provided in Supplementary Table 1.
Visualization, segmentation of density maps, and generation of videos were done with UCSF Chimera49.
Reporting Summary.
Further information on research design is available in the Nature Research Reporting Summary linked to this article.
Extended Data
Extended Data Fig. 1 |. Asymmetry reconstruction workflow for all CPV samples and the comparison of 10 RdRp with capped-terminal RNA in the quiescent state.
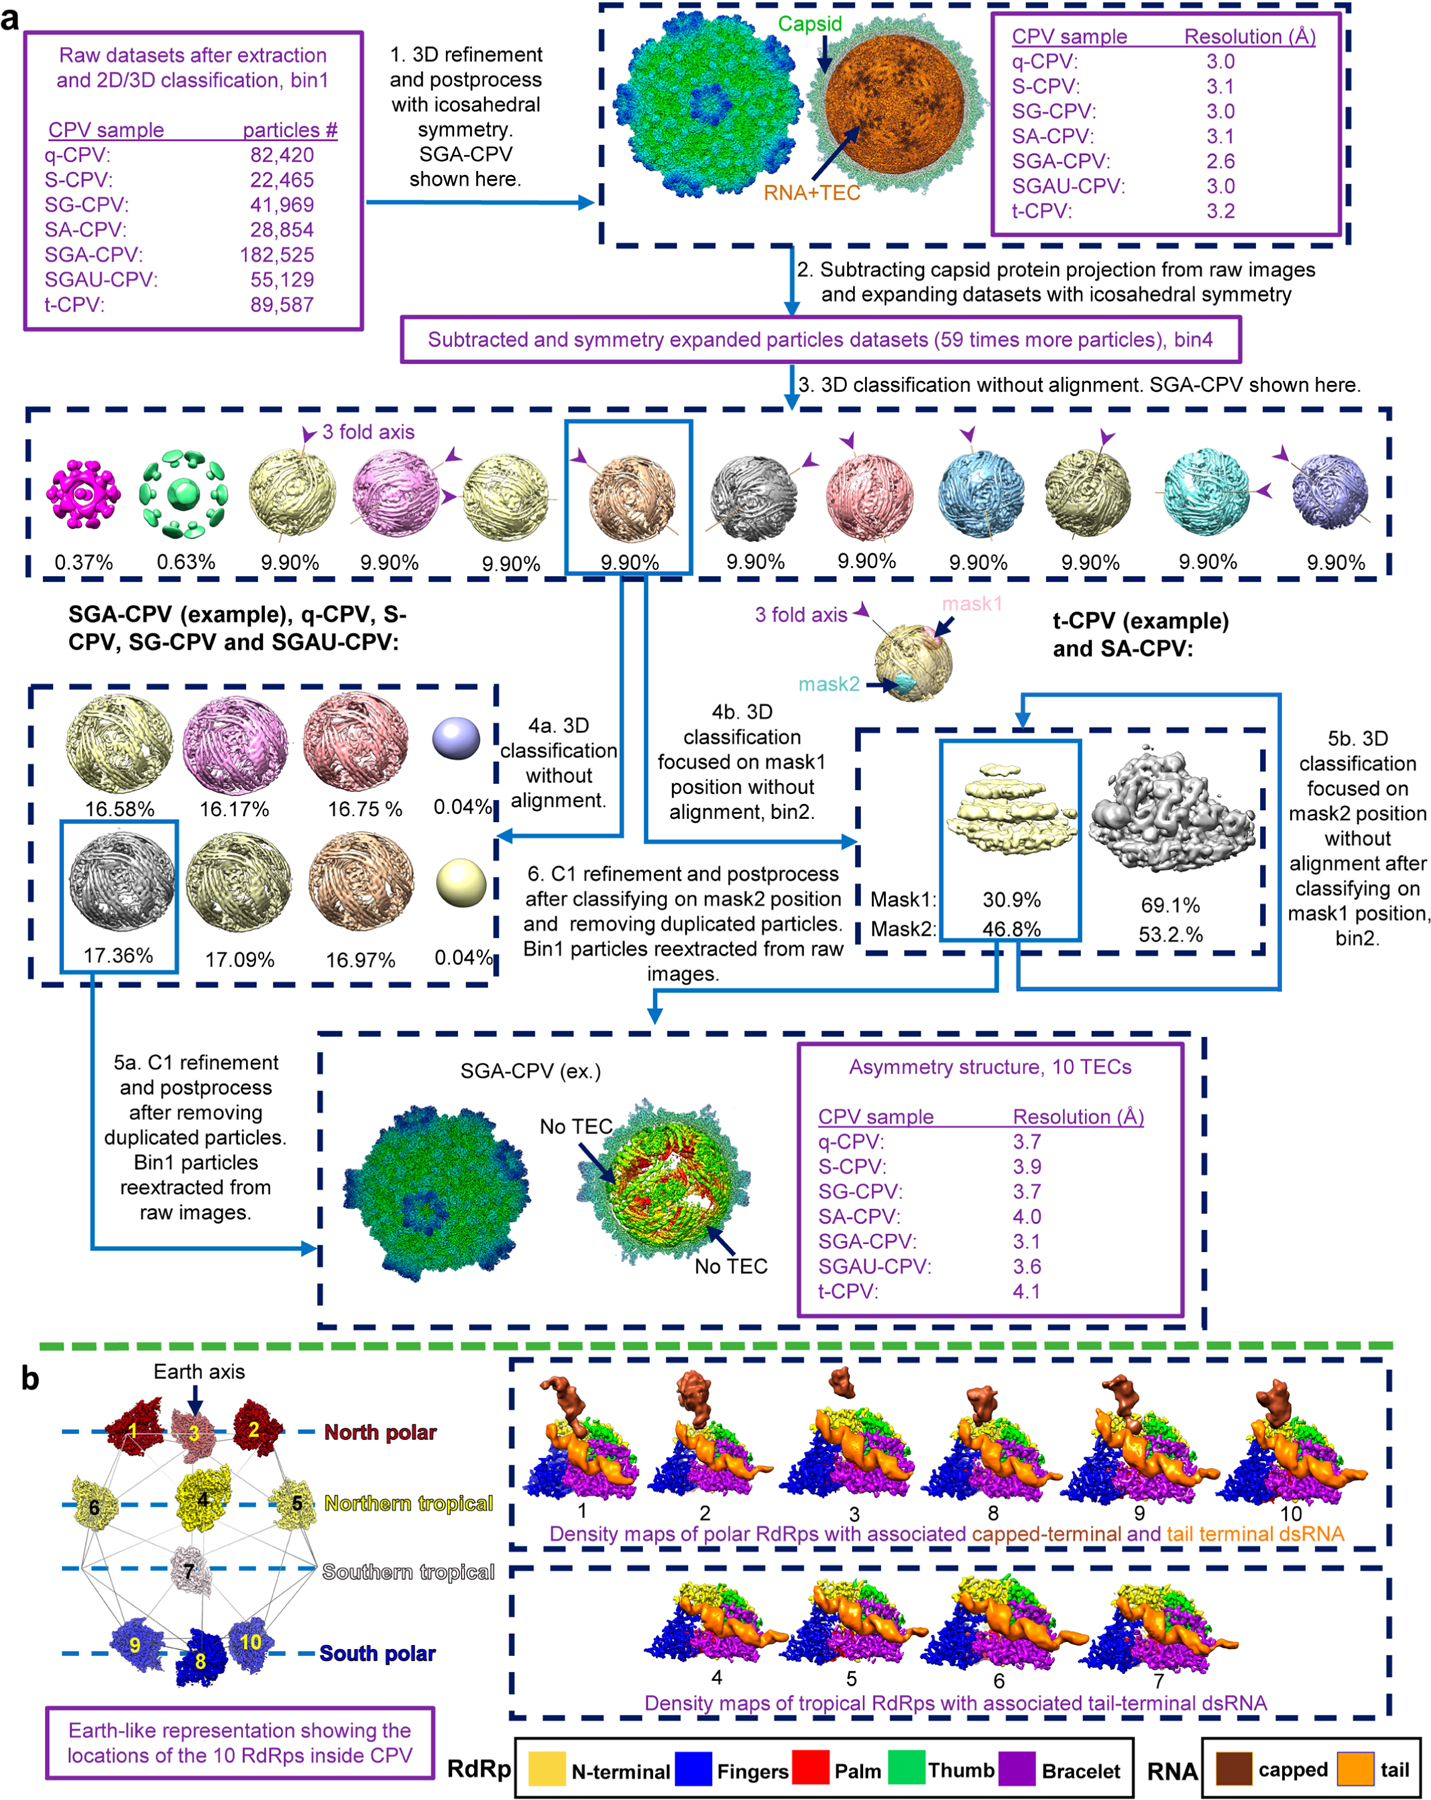
a,b, Blue arrows with explanatory text denote data-processing steps; purple text describes data properties.
Extended Data Fig. 2 |. Subparticle reconstruction workflows for SGA-CPV.
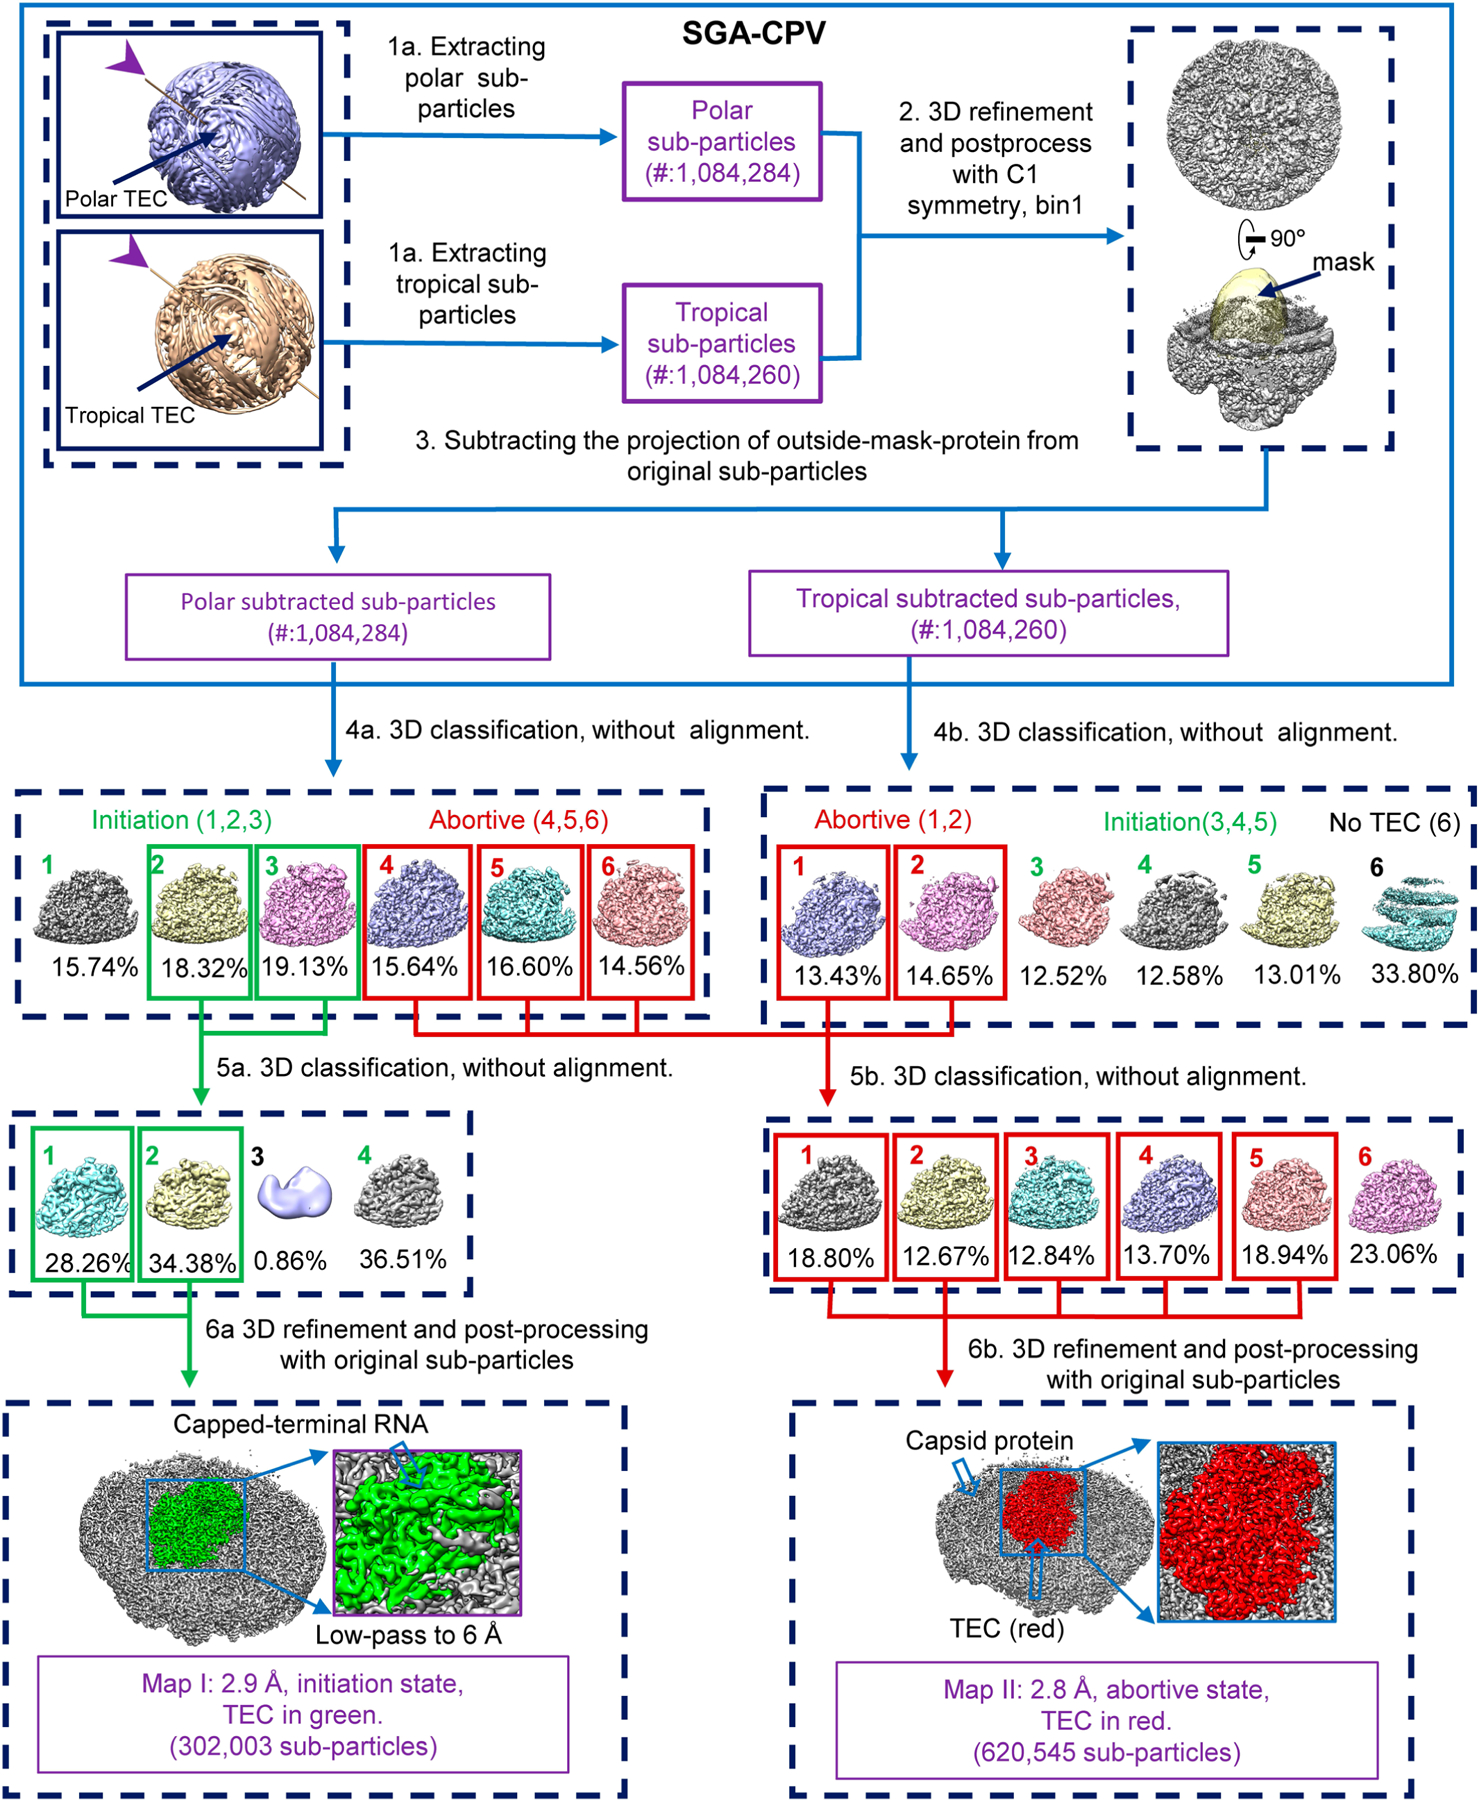
Subparticle reconstruction workflows for SGA-CPV. Arrows with associated text denote data-processing steps. Purple text describes the properties of the data.
Extended Data Fig. 3 |. Resolution verification.
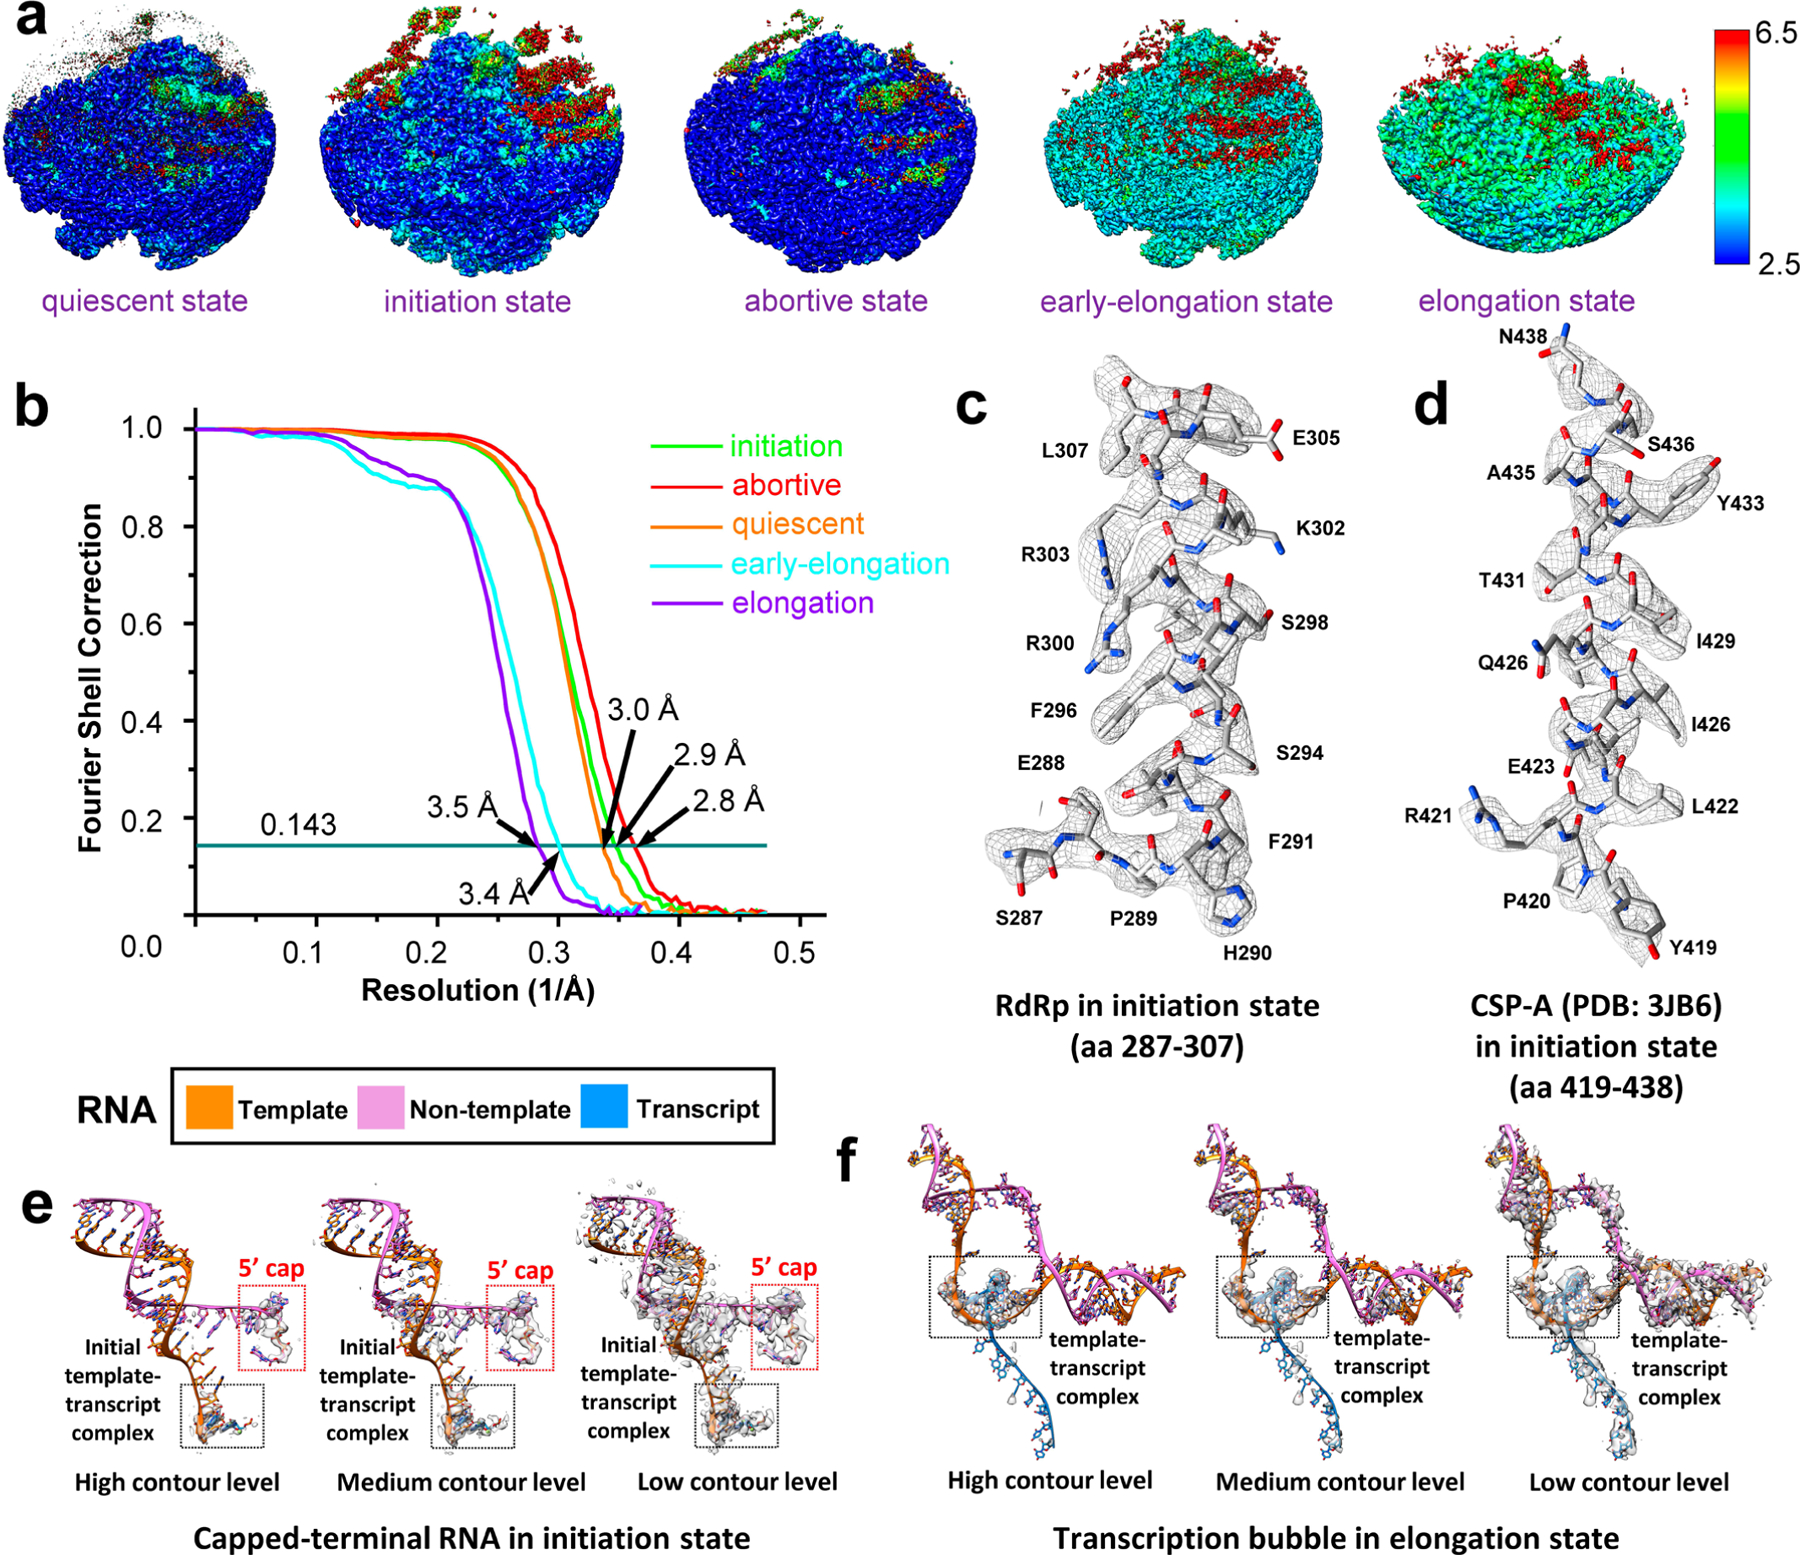
a,b, Local (a) and Fourier shell correction (FSC) (b) resolution evaluation for the structures representing the five states. c,d, Density map (mesh) and atomic model (sticks) of a helix in RdRp (c) and in CSP-A (d), showing side chain densities of similar quality. e,f, RNA density map (semi-transparent grey) and atomic model (mainchains in ribbons and bases in sticks) of the capped-terminal RNA in the initiation state (e) and of the transcription bubble in the elongation state (f).
Extended Data Fig. 4 |. De novo transcription inside the polymerase core.
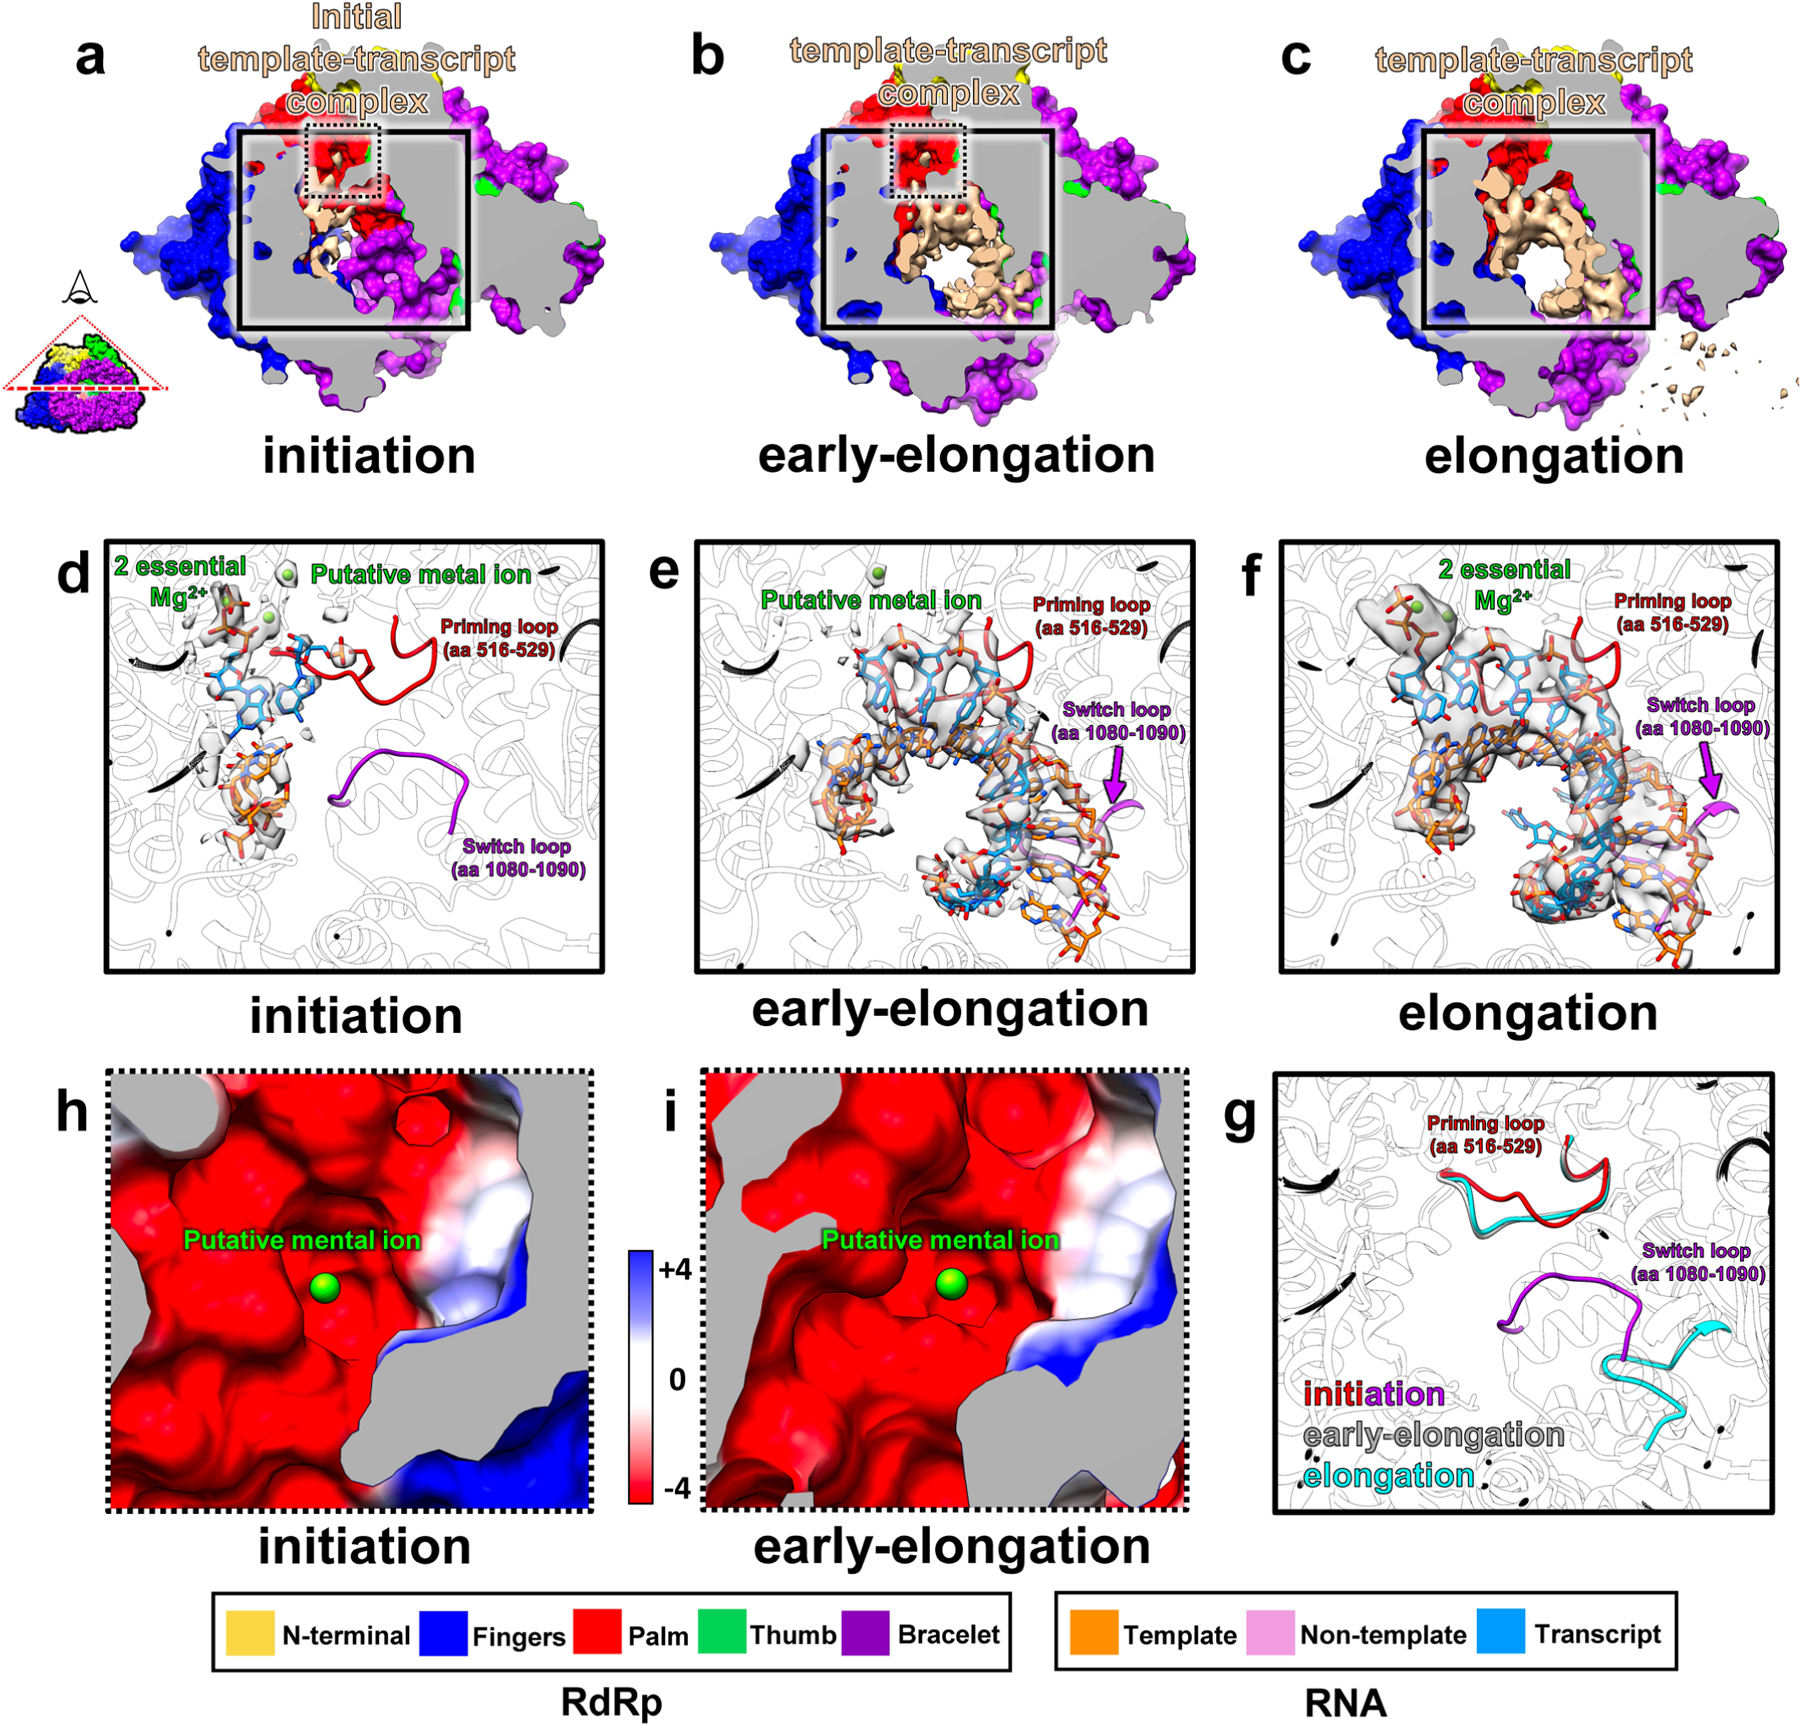
a–c, Structures of RdRP (surface representation) and transcribing complex (density, tan) in initiation state (a), early-elongation state (a) and elongation state (c). d–f, Magnified views of the solid squared area in a–c. Densities (gray) and ribbon models (color) show the details of the de novo transcription in initiation state (d), early-elongation state (e) and elongation state (f). g, Comparison of the priming loop and the switch loop in initiation state, early-elongation state and elongation state. h,i, Magnified views of the dotted square in a and b. A newly discovered Mg2+ ion binds inside a negatively charged pocket of the active site in both initiation (h) and early-elongation (i) states.
Extended Data Fig. 5 |. Comparisons of the tail-terminal dsRNA and the module A in all the 5 states.
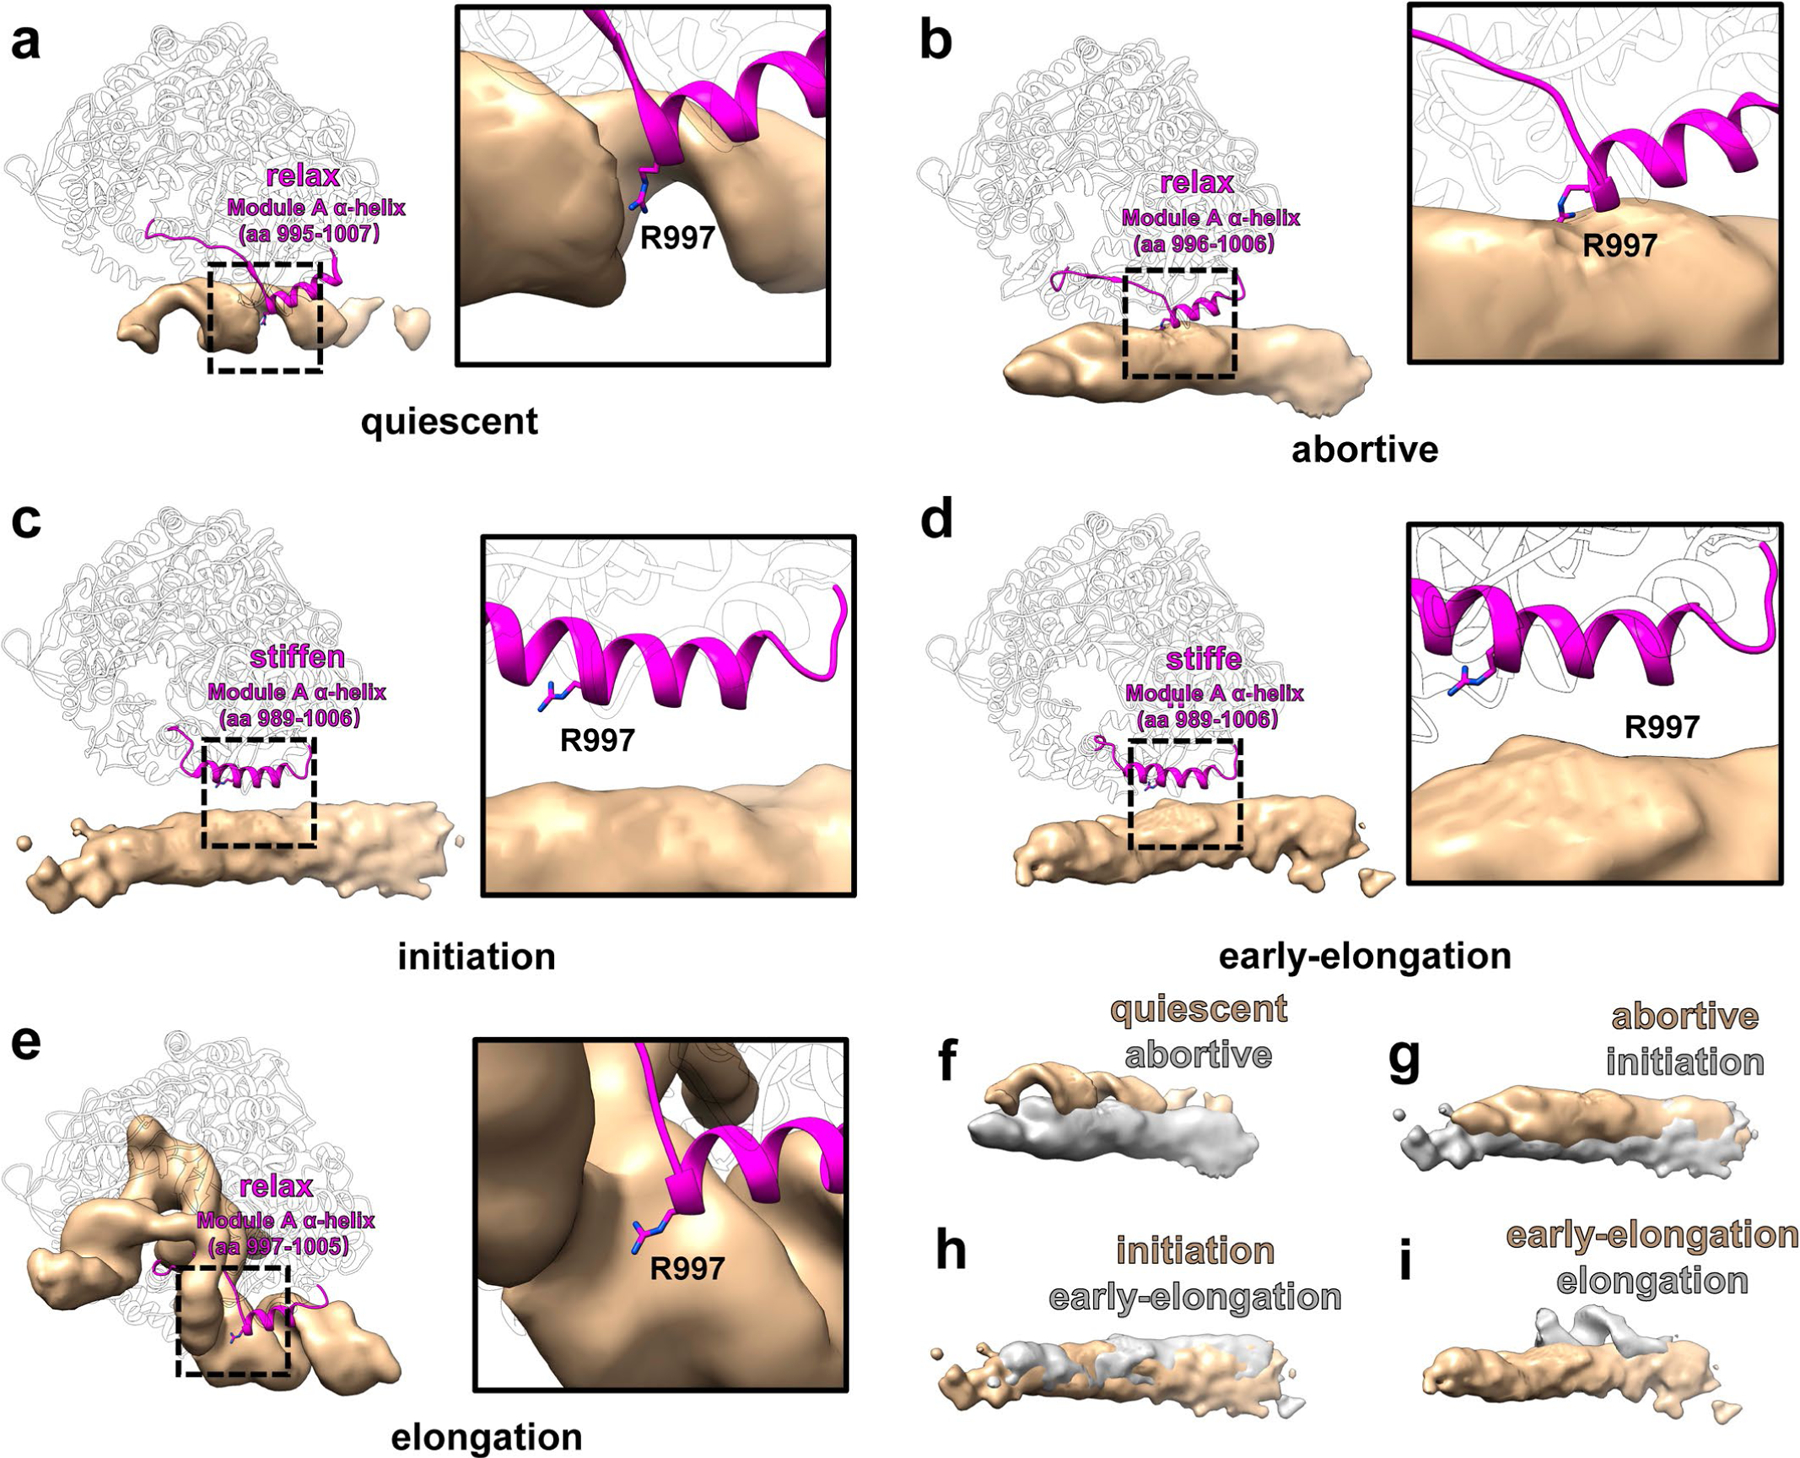
a–e, Models show module A (ribbon models) (aa 982–1010) and the tail-terminal dsRNA/transcription bubble (densities) in quiescent state (a), abortive state (b), initiation state (c), early-elongation state (d) and elongation state (e). f–i, Comparisons of the tail-terminal dsRNA positions at the quiescent state and abortive state (f), the abortive state and initiation state (g), the initiation and early-elongation states (h) and the early-elongation and elongation states (i).
Extended Data Fig. 6 |. RdRp structures in the four sequential states.
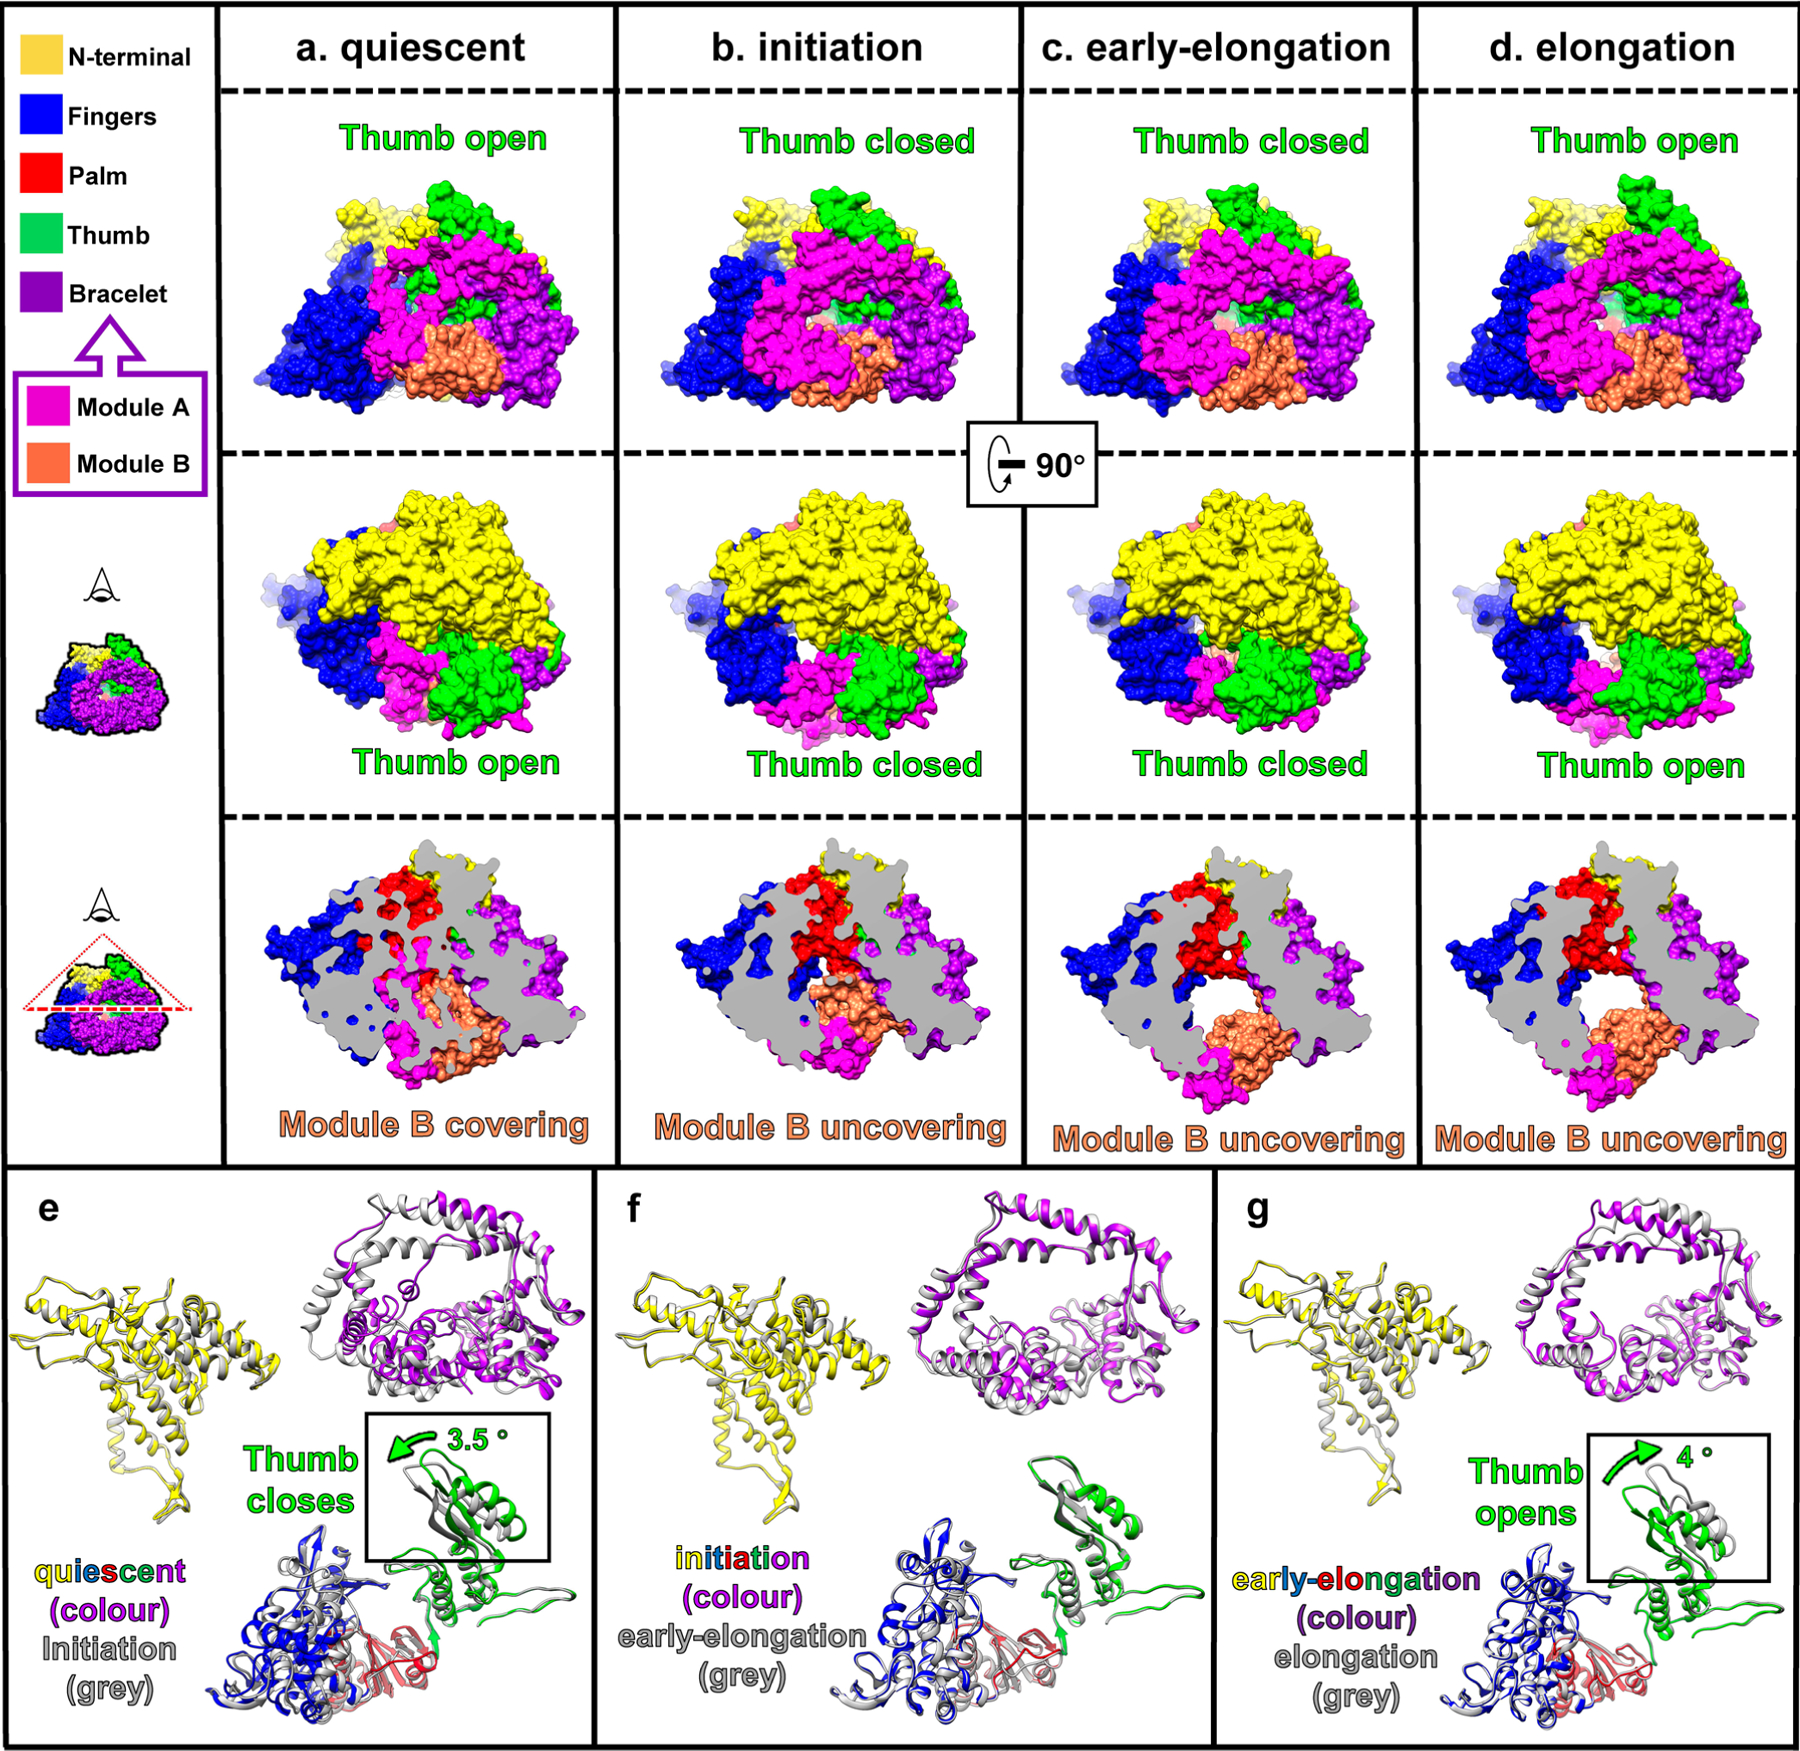
a–d, Surface representation models of the four determined states of RdRp: quiescent (a), initiation (b), early-elongation (c) and elongation (d). e–g, Superpositions of RdRp domains in the four sequential states, comparing conformational changes between states.
Extended Data Fig. 7 |. Comparisons of the bracelet domain in the four sequential states.
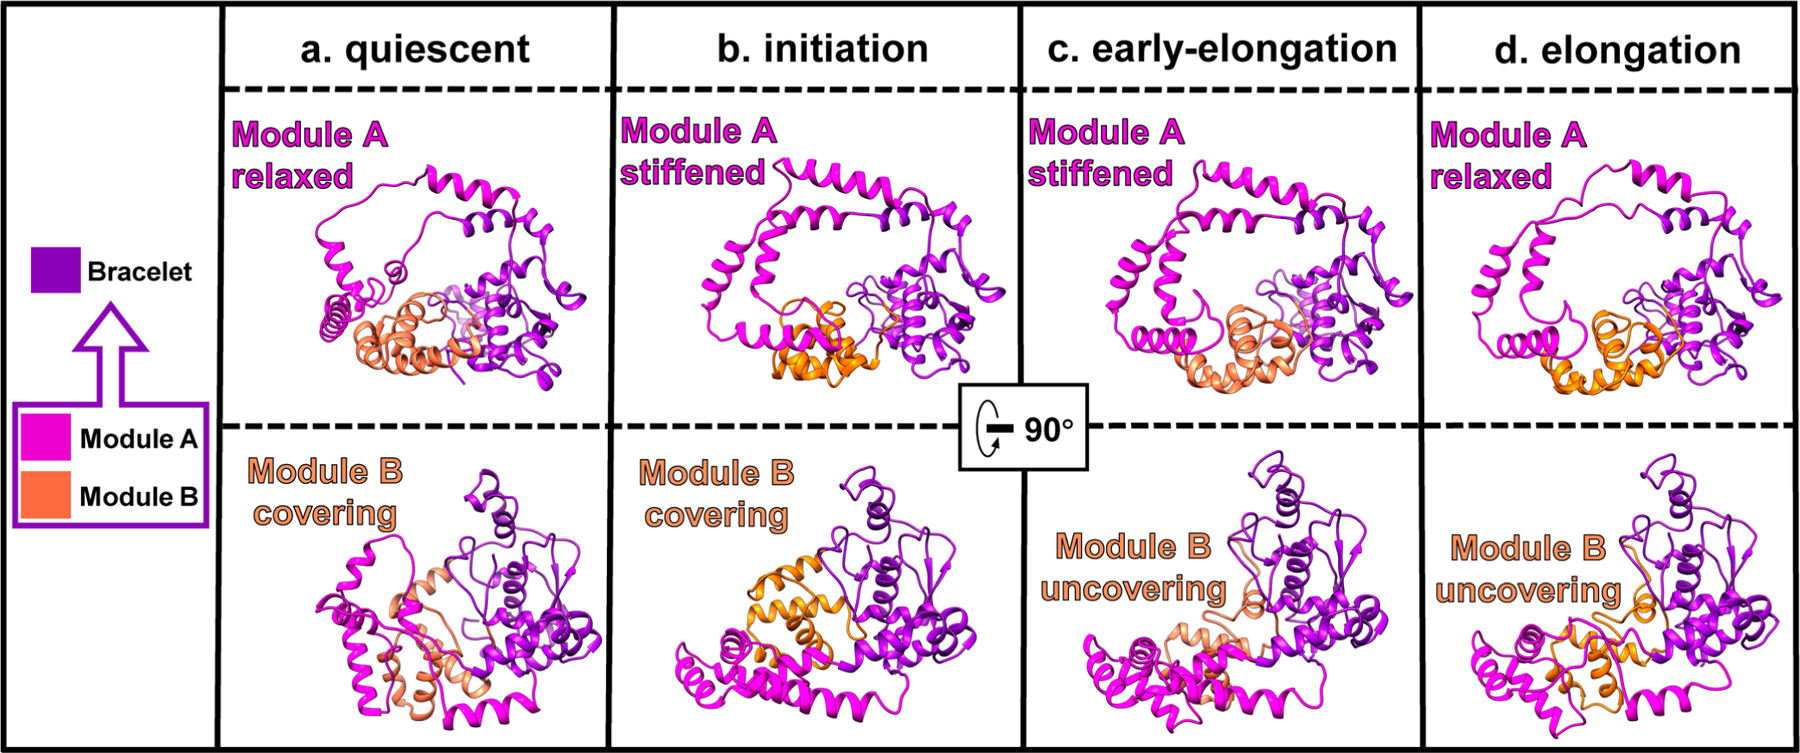
a–d, Ribbon models of the bracelet domain in the quiescent (a), initiation (b), early-elongation (c) and elongation (d) states.
Extended Data Fig. 8 |. Comparisons of the RdRp in the abortive state and the four sequential states.
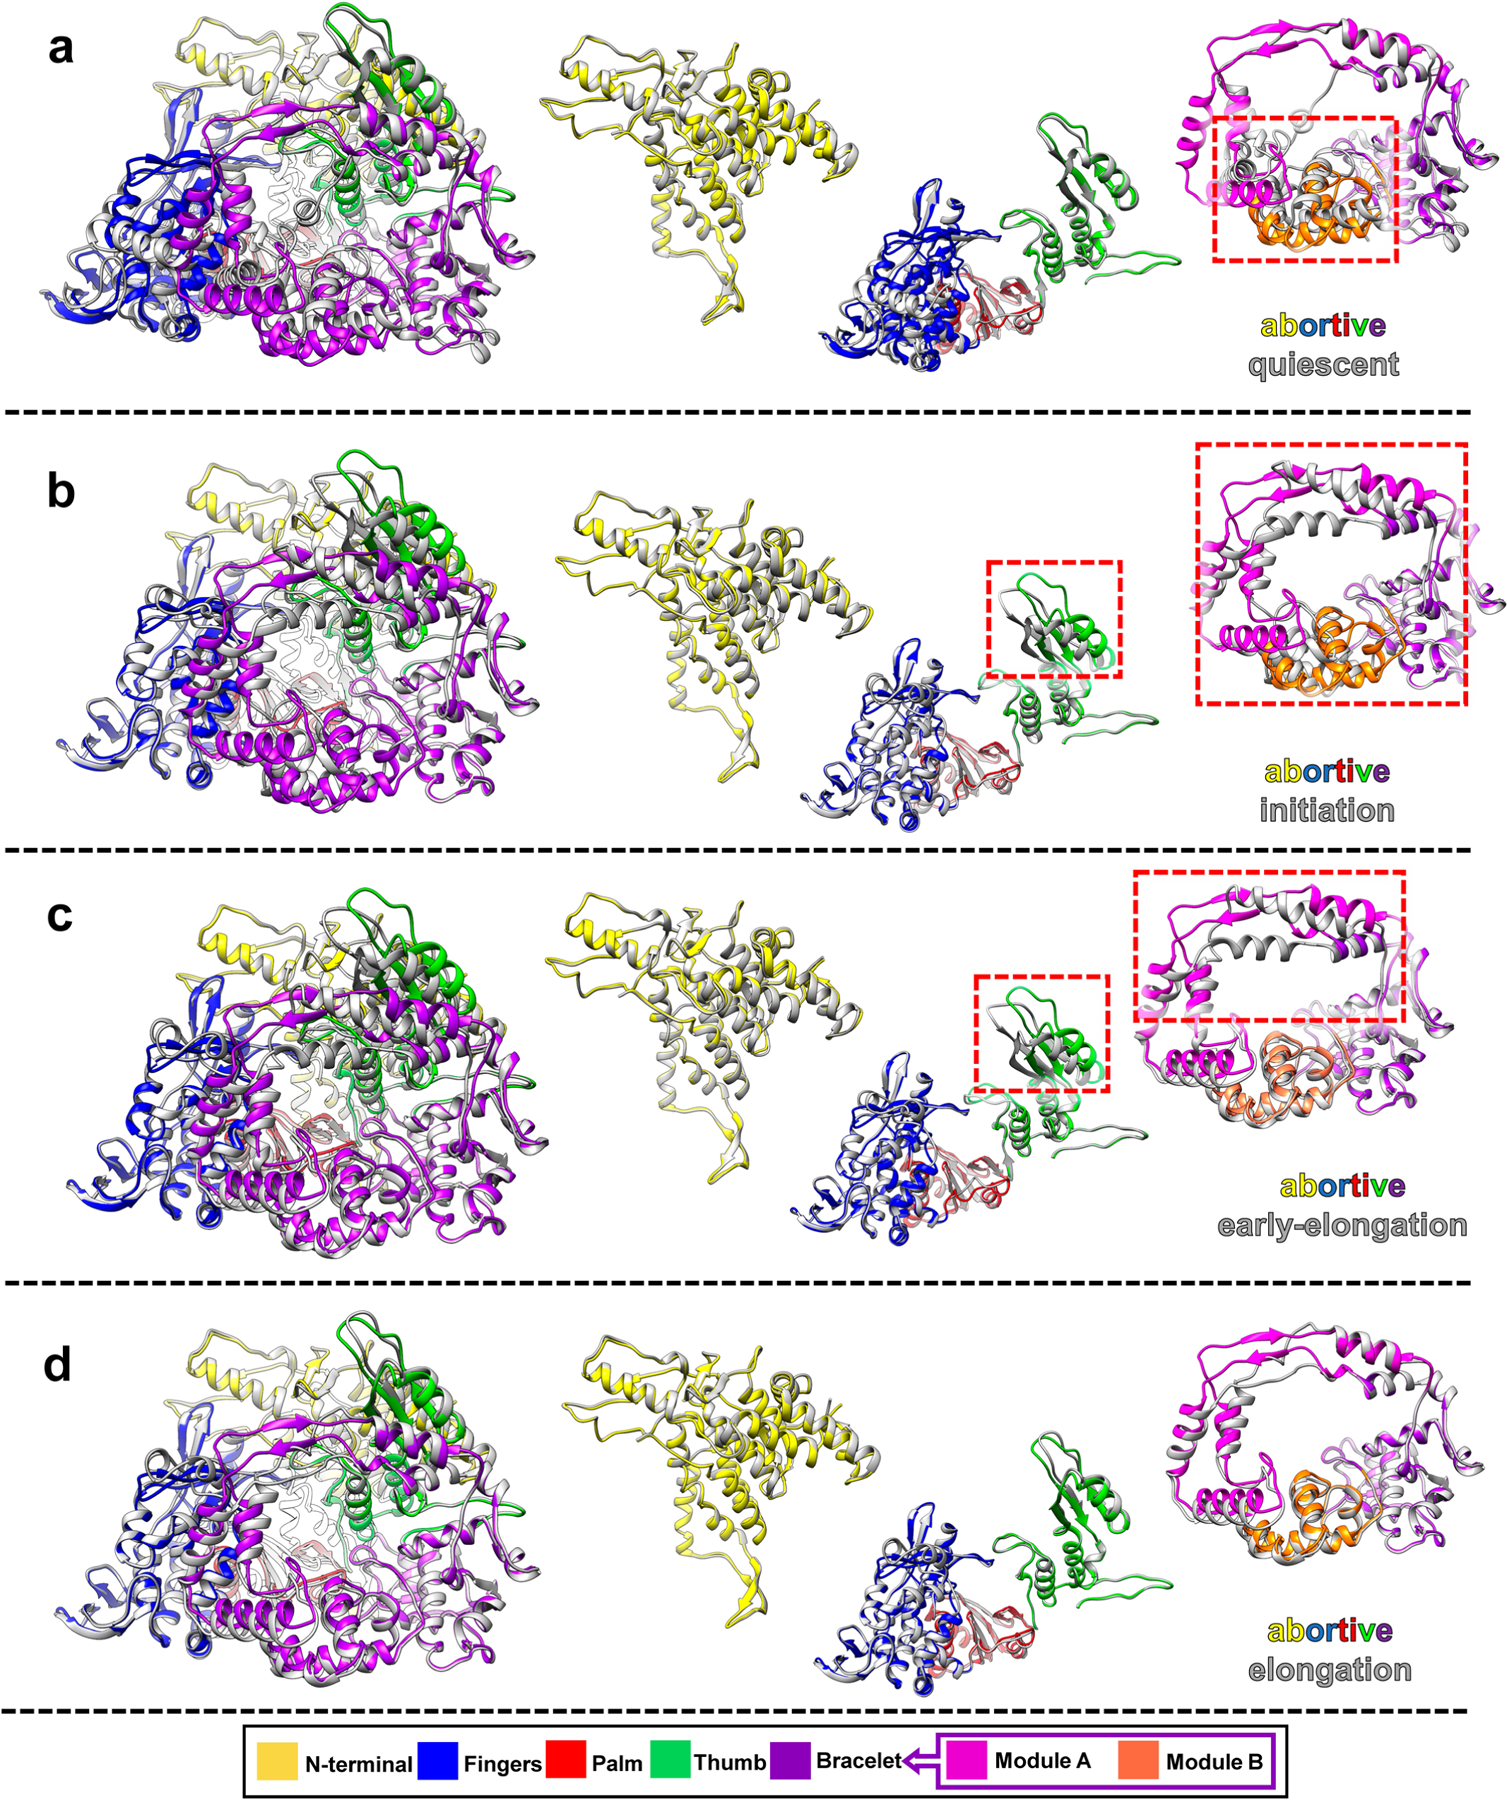
a–d, Superposition of RdRp structures in abortive state and other four sequential states, shown in full RdRp (left) and as separated domains (left).
Extended Data Fig. 9 |. RNA trajectories in the ouroboros model of endogenous transcription and experimental support.
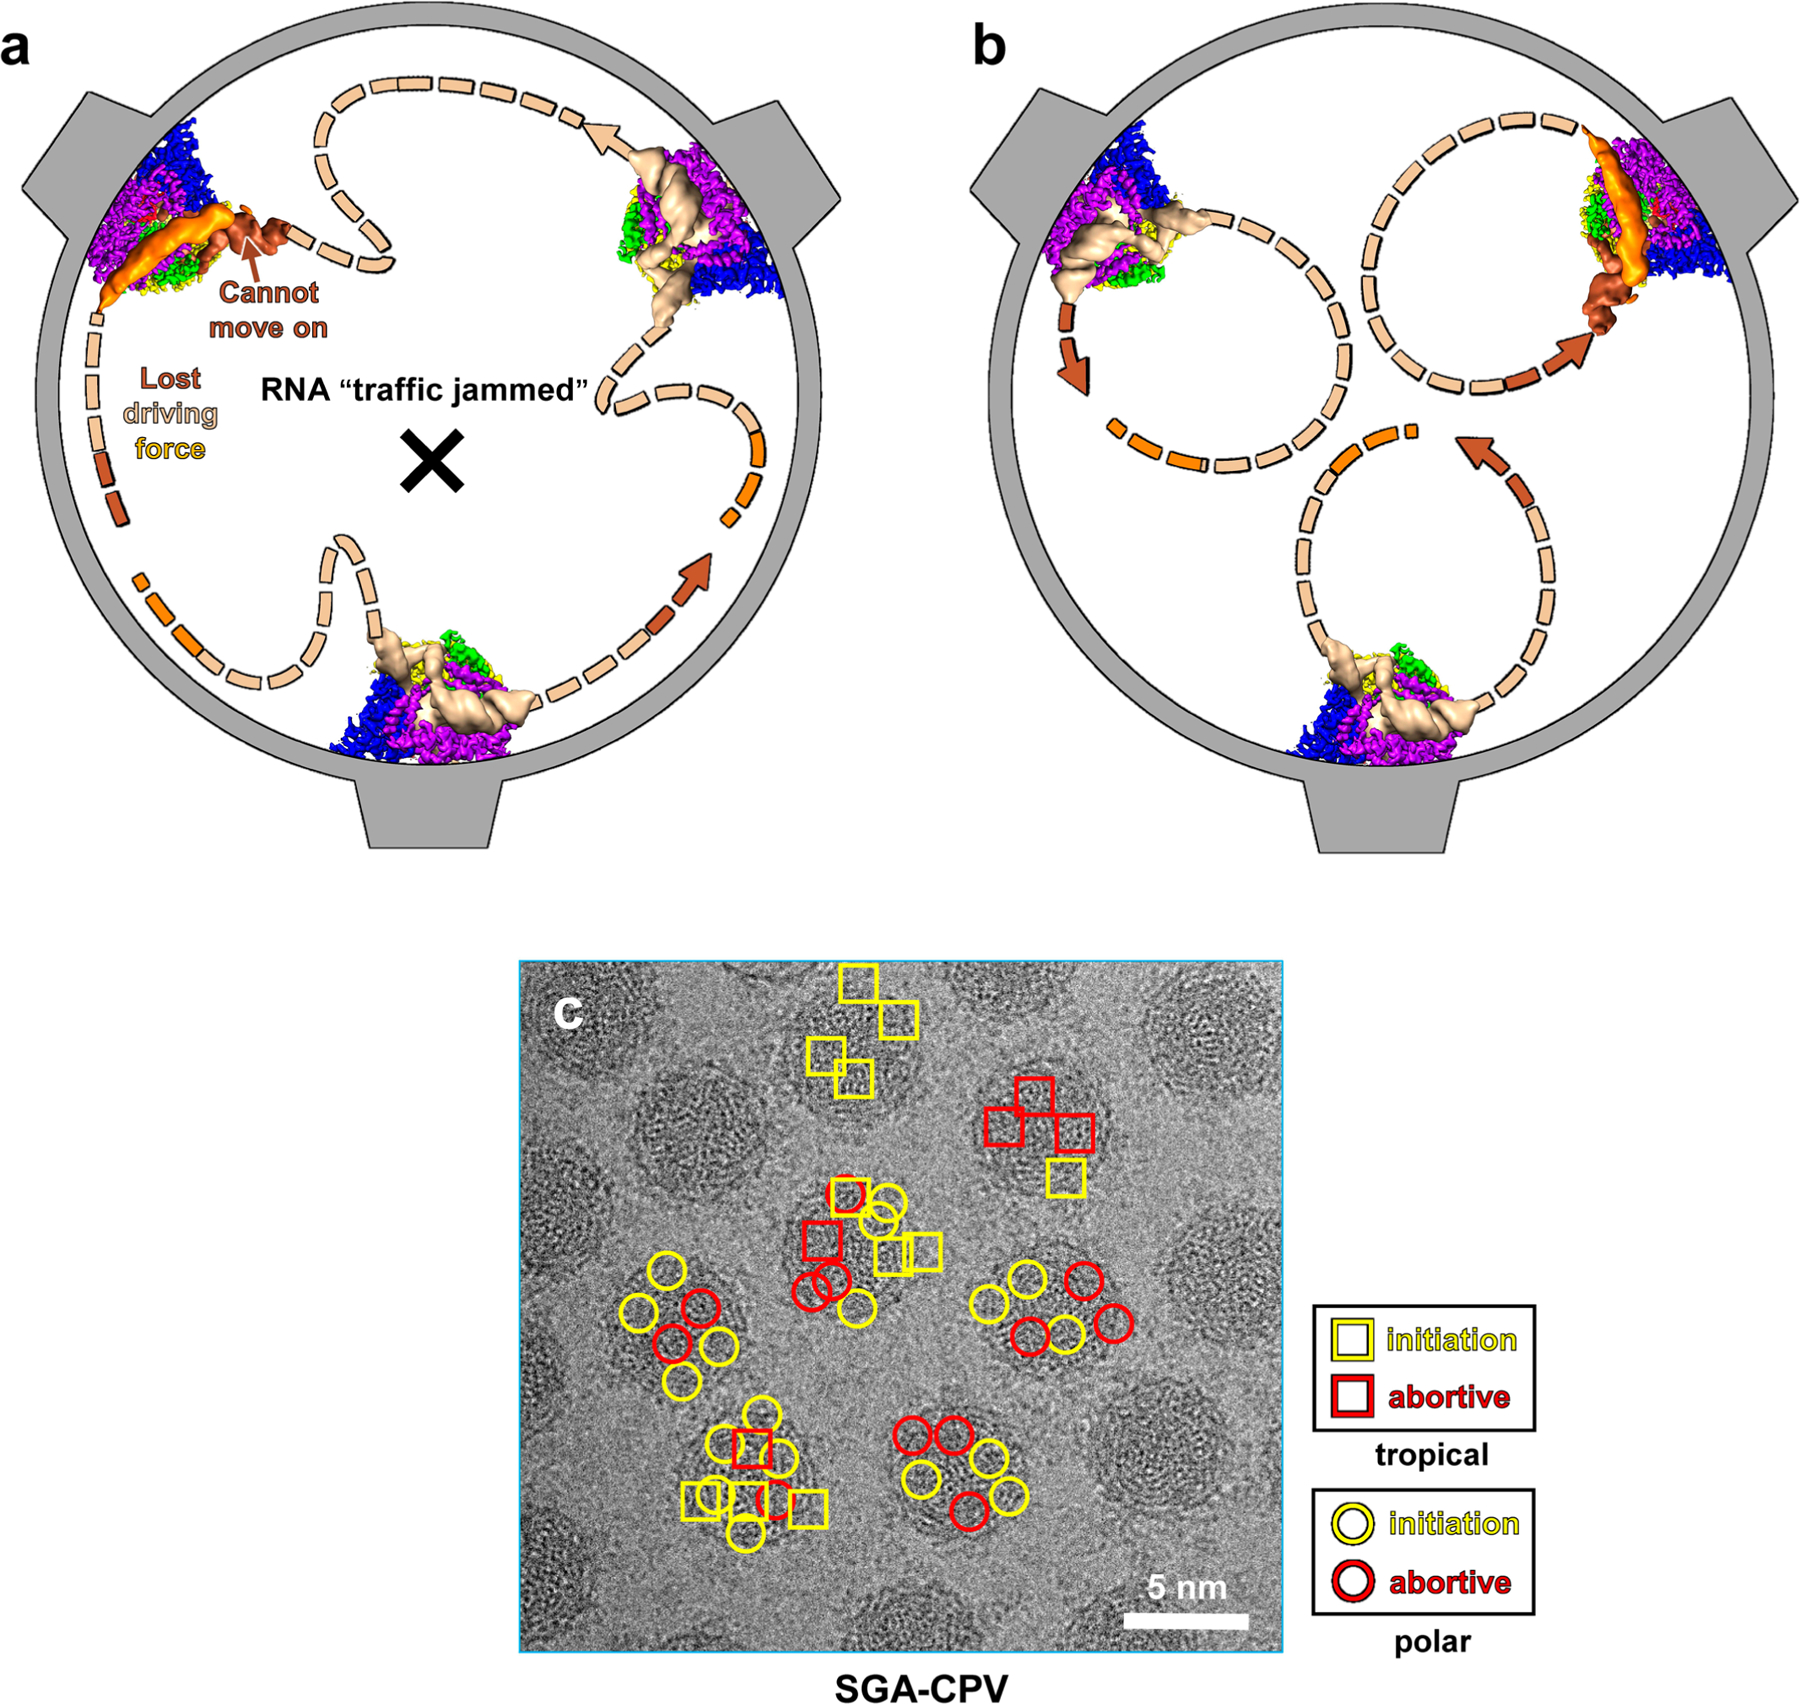
a,b, Schematic illustrations showing two hypothetical trajectories of genomic RNA during transcription. If the capped-terminal RNA and the tail-terminal dsRNA that interact with the same RdRp do not belong to the same segment of genomic RNA, since the lengths of the various segments of genomic RNA are not the same, shorter RNA segments would lose their driving force, leading to an RNA ‘traffic jam’ (a). However, if the capped-terminal RNA and the tail-terminal dsRNA that interact with the same RdRp do belong to the same segment of genomic RNA, individual rounds of transcription would be independent and would not affect others’, allowing simultaneous rounds of transcription to run smoothly (b). c, Subparticle classification results supporting the ouroboros model. An example SGA-CPV cryoEM micrograph is displayed in grayscale and the identified states of sub-particles are indicated for 7 viral particles. The classification results indicate that RNA transcription by RdRp in different sub-particles within the same virion is not synchronized and could be in different states.
Supplementary Material
Acknowledgements
We thank X. Yu and X. Zhang for their early efforts on this project, K. Ding and Y. He for advice in data processing and for discussion, T. Nguyen for manuscript editing, D. Weisman for illustrations, I. Atanasov for assistance in electron microscopy and P. Ge for computational support. This work was supported in part by grants from National Natural Science Foundation of China (No. 31672489 to J.S.) and the US National Institutes of Health (AI094386 and GM071940 to Z.H.Z.). We acknowledge the use of instruments at the Electron Imaging Center for Nanomachines supported by UCLA and by instrumentation grants from the National Institutes of Health (1S10RR23057, 1S10OD018111 and U24GM116792) and the National Science Foundation (DMR-1548924 and DBI-1338135).
Footnotes
Online content
Any methods, additional references, Nature Research reporting summaries, source data, extended data, supplementary information, acknowledgements, peer review information, details of author contributions and competing interests, and statements of data and code availability are available at https://doi.org/10.1038/s41594-019-0320-0.
Data availability
The data that support the findings of this study are available from the corresponding authors upon reasonable request. Accession codes for deposited maps in the Electron Microscopy Data Bank include those for the asymmetric reconstructed cryoEM density maps (EMD-20595 (q-CPV), EMD-20596 (S-CPV), EMD-20597 (SG-CPV), EMD-20598 (SA-CPV), EMD-20599 (SGA-CPV), EMD-20600 (SGAU-CPV) and EMD-20601 (t-CPV)) and those for the subparticle reconstructed cryoEM density maps (EMD-20581 (quiescent state), EMD-20582 (initiation state), EMD-20585 (abortive state), EMD-20586 (early-elongation state) and EMD-20587 (elongation state)). Accession codes for atomic models deposited in the Protein Data Bank include 6TY8 (quiescent state), 6TY9 (initiation state), 6TZ0 (abortive state), 6TZ1 (early-elongation state), and 6TZ2 (elongation state).
Competing interests
The authors declare no competing interests.
Extended data is available for this paper at https://doi.org/10.1038/s41594-019-0320-0.
Supplementary information is available for this paper at https://doi.org/10.1038/s41594-019-0320-0.
Peer review information Beth Moorefield was the primary editor on this article and managed its editorial process and peer review in collaboration with the rest of the editorial team.
References
- 1.Lawton JA, Estes MK & Prasad BV Mechanism of genome transcription in segmented dsRNA viruses. Adv. Virus Res 55, 185–229 (2000). [DOI] [PMC free article] [PubMed] [Google Scholar]
- 2.Shatkin AJ & Sipe JD RNA polymerase activity in purified reoviruses. Proc. Natl Acad. Sci. USA 61, 1462–1469 (1968). [DOI] [PMC free article] [PubMed] [Google Scholar]
- 3.Furuichi Y ‘Methylation-coupled’ transcription by virus-associated transcriptase of cytoplasmic polyhedrosis virus containing double-stranded RNA. Nucleic Acids Res. 1, 809–822 (1974). [DOI] [PMC free article] [PubMed] [Google Scholar]
- 4.Farsetta DL, Chandran K & Nibert ML Transcriptional activities of reovirus RNA polymerase in recoated cores. Initiation and elongation are regulated by separate mechanisms. J. Biol. Chem 275, 39693–39701 (2000). [DOI] [PubMed] [Google Scholar]
- 5.Borsa J, Sargent MD, Lievaart PA & Copps TP Reovirus: evidence for a second step in the intracellular uncoating and transcriptase activation process. Virology 111, 191–200 (1981). [DOI] [PubMed] [Google Scholar]
- 6.Furuichi Y ‘Pretranscriptional capping’ in the biosynthesis of cytoplasmic polyhedrosis virus mRNA. Proc. Natl Acad. Sci. USA 75, 1086–1090 (1978). [DOI] [PMC free article] [PubMed] [Google Scholar]
- 7.Mertens P The dsRNA viruses. Virus Res. 101, 3–13 (2004). [DOI] [PubMed] [Google Scholar]
- 8.Zhang X et al. In situ structures of the segmented genome and RNA polymerase complex inside a dsRNA virus. Nature 527, 531–534 (2015). [DOI] [PMC free article] [PubMed] [Google Scholar]
- 9.Liu H & Cheng L Cryo-EM shows the polymerase structures and a nonspooled genome within a dsRNA virus. Science 349, 1347–1350 (2015). [DOI] [PubMed] [Google Scholar]
- 10.Ding K, Nguyen L & Zhou ZH In situ structures of the polymerase complex and RNA genome show how aquareovirus transcription machineries respond to uncoating. J. Virol 92, e00774–18 (2018). [DOI] [PMC free article] [PubMed] [Google Scholar]
- 11.Ding K et al. In situ structures of rotavirus polymerase in action and mechanism of mRNA transcription and release. Nat. Commun 10, 2216 (2019). [DOI] [PMC free article] [PubMed] [Google Scholar]
- 12.Jenni S et al. In situ structure of rotavirus VP1 RNA-dependent RNA polymerase. J Mol Biol 431, 3124–3138 (2019). [DOI] [PMC free article] [PubMed] [Google Scholar]
- 13.He Y et al. In situ structures of RNA-dependent RNA polymerase inside bluetongue virus before and after uncoating. Proc. Natl Acad. Sci. USA 116, 16535–16540 (2019). [DOI] [PMC free article] [PubMed] [Google Scholar]
- 14.Zhou ZH in Segmented Double-Stranded RNA Viruses: Structure and Molecular Biology (ed. Patton JT) Ch. 2 (Caister Academic Press, 2008). [Google Scholar]
- 15.Mertens PPC, Rao S & Zhou ZH in Virus Taxonomy, VIIIth Report of the ICTV (eds Fauquet CM et al. ) 522–533 (Elsevier/Academic Press, 2004). [Google Scholar]
- 16.Smith RE & Furuichi Y The double-stranded RNA genome segments of cytoplasmic polyhedrosis virus are independently transcribed. J. Virol 41, 326–329 (1982). [DOI] [PMC free article] [PubMed] [Google Scholar]
- 17.Furuichi Y & Miura K A blocked structure at the 5’ terminus of mRNA from cytoplasmic polyhedrosis virus. Nature 253, 374–375 (1975). [DOI] [PubMed] [Google Scholar]
- 18.Yu X, Jin L & Zhou ZH 3.88 A structure of cytoplasmic polyhedrosis virus by cryo-electron microscopy. Nature 453, 415–419 (2008). [DOI] [PMC free article] [PubMed] [Google Scholar]
- 19.Yu X, Jiang J, Sun J & Zhou ZH A putative ATPase mediates RNA transcription and capping in a dsRNA virus. eLife 4, e07901 (2015). [DOI] [PMC free article] [PubMed] [Google Scholar]
- 20.Cao G et al. Characterization of the complete genome segments from BmCPV-SZ, a novel Bombyx mori cypovirus 1 isolate. Can. J. Microbiol 58, 872–883 (2012). [DOI] [PubMed] [Google Scholar]
- 21.McClure WR, Cech CL & Johnston DE A steady state assay for the RNA polymerase initiation reaction. J. Biol. Chem 253, 8941–8948 (1978). [PubMed] [Google Scholar]
- 22.Zivanov J et al. New tools for automated high-resolution cryo-EM structure determination in RELION-3. eLife 7, e42166 (2018). [DOI] [PMC free article] [PubMed] [Google Scholar]
- 23.Hagiwara K, Rao S, Scott SW & Carner GR Nucleotide sequences of segments 1, 3 and 4 of the genome of Bombyx mori cypovirus 1 encoding putative capsid proteins VP1, VP3 and VP4, respectively. J. Gen. Virol 83, 1477–1482 (2002). [DOI] [PubMed] [Google Scholar]
- 24.Sosunov V et al. Unified two-metal mechanism of RNA synthesis and degradation by RNA polymerase. EMBO J. 22, 2234–2244 (2003). [DOI] [PMC free article] [PubMed] [Google Scholar]
- 25.Svetlov V & Nudler E Basic mechanism of transcription by RNA polymerase II. Biochim. Biophys. Acta 1829, 20–28 (2013). [DOI] [PMC free article] [PubMed] [Google Scholar]
- 26.Rothwell PJ & Waksman G Structure and mechanism of DNA polymerases. Adv. Protein Chem 71, 401–440 (2005). [DOI] [PubMed] [Google Scholar]
- 27.Tsai MD How DNA polymerases catalyze DNA replication, repair, and mutation. Biochemistry 53, 2749–2751 (2014). [DOI] [PubMed] [Google Scholar]
- 28.Steitz TA & Steitz JA A general two-metal-ion mechanism for catalytic RNA. Proc. Natl Acad. Sci. USA 90, 6498–6502 (1993). [DOI] [PMC free article] [PubMed] [Google Scholar]
- 29.Steitz TA DNA polymerases: structural diversity and common mechanisms. J. Biol. Chem 274, 17395–17398 (1999). [DOI] [PubMed] [Google Scholar]
- 30.Yang W, Lee JY & Nowotny M Making and breaking nucleic acids: two-Mg2+-ion catalysis and substrate specificity. Mol. Cell 22, 5–13 (2006). [DOI] [PubMed] [Google Scholar]
- 31.Smith RE & Furuichi Y A unique class of compound, guanosine-nucleoside tetraphosphate G(5’)pppp(5’)N, synthesized during the in vitro transcription of cytoplasmic polyhedrosis virus of Bombyx mori. Structural determination and mechanism of formation. J. Biol. Chem 257, 485–494 (1982). [PubMed] [Google Scholar]
- 32.Tao Y, Farsetta DL, Nibert ML & Harrison SC RNA synthesis in a cage-structural studies of reovirus polymerase lambda3. Cell 111, 733–745 (2002). [DOI] [PubMed] [Google Scholar]
- 33.Wang X et al. Structure of RNA polymerase complex and genome within a dsRNA virus provides insights into the mechanisms of transcription and assembly. Proc. Natl Acad. Sci. USA 115, 7344–7349 (2018). [DOI] [PMC free article] [PubMed] [Google Scholar]
- 34.Yamakawa M, Furuichi Y & Shatkin AJ Reovirus transcriptase and capping enzymes are active in intact virions. Virology 118, 157–168 (1982). [DOI] [PubMed] [Google Scholar]
- 35.Zarbl H, Hastings KE & Millward S Reovirus core particles synthesize capped oligonucleotides as a result of abortive transcription. Arch. Biochem. Biophys 202, 348–360 (1980). [DOI] [PubMed] [Google Scholar]
- 36.Hubin EA et al. Structure and function of the mycobacterial transcription initiation complex with the essential regulator RbpA. eLife 6, e22520 (2017). [DOI] [PMC free article] [PubMed] [Google Scholar]
- 37.Boyaci H, Chen J, Jansen R, Darst SA & Campbell EA Structures of an RNA polymerase promoter melting intermediate elucidate DNA unwinding. Nature 565, 382–385 (2019). [DOI] [PMC free article] [PubMed] [Google Scholar]
- 38.Suloway C et al. Automated molecular microscopy: The new Leginon system. J. Struct. Biol 151, 41–60 (2005). [DOI] [PubMed] [Google Scholar]
- 39.Mastronarde DN Automated electron microscope tomography using robust prediction of specimen movements. J. Struct. Biol 152, 36–51 (2005). [DOI] [PubMed] [Google Scholar]
- 40.Zheng SQ et al. MotionCor2: anisotropic correction of beam-induced motion for improved cryo-electron microscopy. Nat. Methods 14, 331–332 (2017). [DOI] [PMC free article] [PubMed] [Google Scholar]
- 41.Li X et al. Electron counting and beam-induced motion correction enable near-atomic-resolution single-particle cryo-EM. Nat. Methods 10, 584–590 (2013). [DOI] [PMC free article] [PubMed] [Google Scholar]
- 42.Rohou A & Grigorieff N CTFFIND4: Fast and accurate defocus estimation from electron micrographs. J. Struct. Biol 192, 216–221 (2015). [DOI] [PMC free article] [PubMed] [Google Scholar]
- 43.Kivioja T, Ravantti J, Verkhovsky A, Ukkonen E & Bamford D Local average intensity-based method for identifying spherical particles in electron micrographs. J. Struct. Biol 131, 126–134 (2000). [DOI] [PubMed] [Google Scholar]
- 44.Heymann JB & Belnap DM Bsoft: Image processing and molecular modeling for electron microscopy. J. Struct. Biol 157, 3–18 (2007). [DOI] [PubMed] [Google Scholar]
- 45.Kucukelbir A, Sigworth FJ & Tagare HD Quantifying the local resolution of cryo-EM density maps. Nat. Methods 11, 63–65 (2014). [DOI] [PMC free article] [PubMed] [Google Scholar]
- 46.Emsley P & Cowtan K Coot: model-building tools for molecular graphics. Acta. Crystallogr. D Biol. Crystallogr 60, 2126–2132 (2004). [DOI] [PubMed] [Google Scholar]
- 47.Yu I et al. Building atomic models based on near atomic resolution cryoEM maps with existing tools. J. Struct. Biol 204, 313–318 (2018). [DOI] [PMC free article] [PubMed] [Google Scholar]
- 48.Adams PD et al. PHENIX: a comprehensive Python-based system for macromolecular structure solution. Acta. Crystallogr. D Biol. Crystallogr 66, 213–221 (2010). [DOI] [PMC free article] [PubMed] [Google Scholar]
- 49.Pettersen EF et al. UCSF Chimera-a visualization system for exploratory research and analysis. J. Comput. Chem 25, 1605–1612 (2004). [DOI] [PubMed] [Google Scholar]
Associated Data
This section collects any data citations, data availability statements, or supplementary materials included in this article.


