

Abstract
How genome-wide association studies-identified single-nucleotide polymorphisms (SNPs) affect remote genes remains unknown. Expression quantitative trait locus (eQTL) association meta-analysis on 496 prostate tumor and 602 normal prostate samples with 117 SNPs revealed novel cis-eQTLs and trans-eQTLs. Mediation testing and colocalization analysis demonstrate that MSMB is a cis-acting mediator for SNHG11 (P < 0.01). Removing rs10993994 in LNCaP cell lines by CRISPR/Cas9 editing shows that the C-allele corresponds with an over 100-fold increase in MSMB expression and 5-fold increase in SNHG11 compared with the T-allele. Colocalization analysis confirmed that the same set of SNPs associated with MSMB expression is associated with SNHG11 expression (posterior probability of shared variants is 66.6% in tumor and 91.4% in benign). These analyses further demonstrate variants driving MSMB expression differ in tumor and normal, suggesting regulatory network rewiring during tumorigenesis.
Introduction
Genome-wide association studies (GWAS) have now identified over 160 loci at which common genetic polymorphisms are associated with the risk of a diagnosis of prostate cancer of any grade (1–3). As this has been typical for results from such genome-wide scans, the identified SNPs do not exert their effects through changes in protein coding regions of genes. Instead, many of the single-nucleotide polymorphisms (SNPs) associated with prostate cancer risk are associated with gene expression changes at the mRNA level in both the normal and cancerous prostate tissues (4–9). Some of these quantitative associations extend beyond mRNA expression, as several prostate cancer risk SNPs are associated with levels of prostate-secreted proteins in prostate secretions and blood (10–13). Prostate cancer risk variants are enriched in regulatory regions of prostate tissue (14, 15), further supporting a role for regulatory variation in prostate cancer risk.
How GWAS-identified prostate cancer risk SNPs affect expression of genes, in particular remote ones, remain unknown. It has been proposed that ‘information’ about the slightly increased risk of disease indicated by a SNP, typically with odds ratios between 1.1 and 1.2, flows through the transcriptional network first by influencing expression of nearby gene(s) and then propagating through the network (16). If this is the case, then downstream ‘trans’ targets, which are indirectly regulated by the risk-conferring SNP, can be identified and characterized. If so, then expression of these trans-genes could be mediated by the activity of a cis-expression quantitative trait locus (eQTL) gene, and such cis-eQTL genes could mediate numerous trans-eQTL genes. Following on the ideas suggested by Yao et al. (17) and Larson et al. (18), here we test this hypothesis by meta-analysis of prostate eQTL datasets from 496 tumor and 602 normal samples, followed by a systematic discovery of trans-eQTLs, mediation, and colocalization testing and determine the extent to which such cis-mediated trans-eQTLs correspond with prostate cancer risk SNPs to build our understanding of the regulatory networks underlying prostate cancer risk, as summarized in Figure 1.
Figure 1.
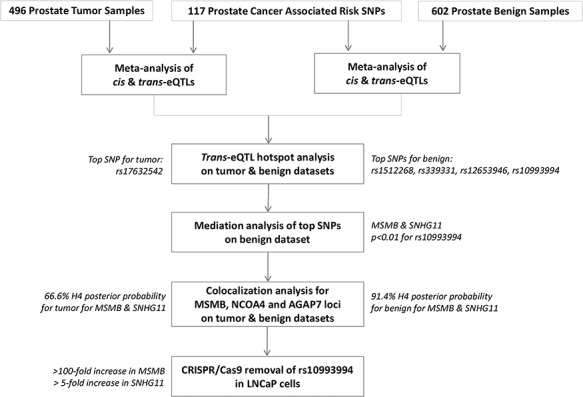
Schematic representation of findings illustrating SNHG11 mediated through MSMB, the SNPs involved and their differential effect depending on tumor versus normal samples.
Results
To begin to understand the role of regulatory variation in modulating gene expression in prostate cancer, we performed whole-genome genotyping and whole-transcriptome expression profiling of prostate tissue from 91 individuals from Turku University Hospital, Turku, Finland, who underwent radical prostatectomy for prostate cancer. Of those, we were able to obtain and maintain high quality RNA from 56 samples containing prostate cancer tissue and 58 adjacent samples containing normal prostate tissue for gene expression microarray analysis (Supplementary Table 1). We genotyped ~2.5 million SNPs in one sample from each of the 91 unique individuals contributing prostatectomy specimens on the Illumina Omni-2.5 array (see section Materials and Methods). After quality control (QC), we were left with 2 366 230 SNPs. Expression levels of 18 087 genes were measured in 114 RNA samples that passed QC using the Illumina Human HT-12 array; we refer to this dataset as the ‘Finland dataset’.
We first asked to what extent SNPs in these individuals correlate with gene expression in both the normal and tumor prostate tissues. Given our limited sample size, we only asked this for cis-effects, where we limited consideration to genes within 200 kb of the SNP of interest, thereby greatly reducing the multiple testing burden. To speed up the computation, we adjusted gene expression levels for principal components of ancestry and batch, as this has been previously described (19). This approach allows us to run the longer, multivariate regression model fitting algorithm once per gene instead of once per SNP/gene pair, and then rapidly compute the association statistics using the analytical solution for single variable linear regression without covariates. We identified 622 SNP/gene pairs that were significant in the tumor tissue and 778 in normal at a significance level of P < 0.05 after correcting for multiple testing within each of the two analyses (tumor and normal, Supplementary Table 2).
eQTLs for prostate phenotype-associated SNPs
While the above results generally describe eQTLs in prostate tissue, they do not describe the extent to which prostate cancer risk SNPs correlate with gene expression. To answer this question, we focused on 117 SNPs previously associated with prostate cancer or levels of prostate-secreted proteins (Supplementary Table 3). To identify genes influenced by the genotype at these prostate cancer associated-SNPs, we first performed a cis-eQTL analysis. Analyzing the tumor and adjacent normal tissues separately, we asked if each SNP was associated with expression levels of any of the nearby genes. After correcting for the number of tests at false discovery rate (FDR) 10%, two significant associations (IRX4 with rs12653946 (adjusted P-value 2.03 × 10⁻⁴), RGS17 with rs1933488 (adjusted P-value 4.06 × 10⁻⁴) were found in the tumor tissue (Supplementary Table 4), both of which had been previously identified (4, 20, 21). Analysis of the adjacent normal tissue showed these two eQTLs again, along with several others (Supplementary Table 4). Trans-eQTL analysis did not identify any additional significant results.
We hypothesized that the limited sample size in our study severely reduced our ability to find eQTLs. To address this problem, we used meta-analysis to combine prostate eQTL datasets. We combined our samples from the Finland dataset with 74 individuals from the Genotype-Tissue Expression (GTEx) project (22), 470 individuals from a study from the Mayo Clinic (6) and 440 individuals from The Cancer Genome Atlas (TCGA) (23) (Supplementary Table 5).
Using these datasets, we performed a meta-analysis searching for both cis- and trans-eQTLs of the 117 SNPs of interest. We applied meta-analysis to tumor (TCGA, Finland) and normal samples (GTEx, Mayo, Finland) datasets separately, though we combined normal tissue from prostate cancer patients and individuals without prostate cancer. Because of differing types of attainment and processing of the studies, we opted for a sample size-based meta-analysis approach. At an FDR of 10%, we identified 39 cis-eQTLs in tumor samples and 141 cis-eQTLs in normal samples. Most of these had been previously reported in analyses from single cohorts as expected, validating our meta-analysis approach, while we were also able to identify novel ones. Comparing these results from meta-analysis to the previously reported cis-eQTL findings from 470 normal samples in a single cohort (6), we observed 53 cis-eQTLs in common and 58 novel, including rs3096702 with NOTCH4 (P = 4.06 × 10⁻⁴, q = 2.33 × 10⁻³ for normal). This is of particular interest as functional studies suggest both tumor suppressive and oncogenic roles of notch in prostate cancer (24).
For trans-eQTLs, at an FDR of 10%, filtering for the same direction of effect, we identified 10 trans-eQTLs in normal (Supplementary Table 6a) and 33 in tumor (Supplementary Table 6b) samples.
Trans-eQTL hotspot analysis
When SNPs at a trans-eQTL locus affect the expression of multiple genes, the region is defined as a trans-eQTL hotspot (17). To identify SNPs that seemed to have the largest effect on the gene expression network, we performed trans-eQTL hotspot analysis, where we rank-ordered SNPs by the number of genes for which they are trans-eQTLs. Detailed in Figure 2 are the top five SNPs, of which two are at genes that code for prostate-secreted proteins: rs10993994 for MSMB and rs17632542 for KLK3 [PSA]; while the other three are at transcription factor genes: rs12653946 which is confirmed as a cis-eQTL with IRX4 (4), rs1512268 which is near NKX3–1, a transcription factor known to play a role in prostate cancer (25) and rs339331, which has been shown to associate with RFX6 activity (26).
Figure 2.
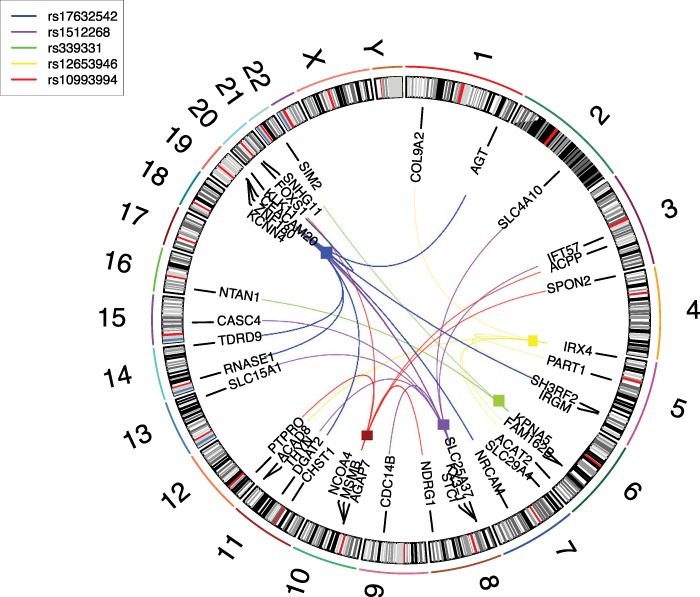
Top five SNPs from trans-eQTL hotspot analysis and their cis- and trans-associated genes. Boxes indicate cis-eQTLs. A different color is used to represent each eQTL hotspot SNP.
Mediation analysis of trans-eQTLs
As many of these SNPs are both cis- and trans-eQTLs, we next asked if these trans-eQTL effects are mediated through the cis-eQTL and this has been previously described (17). Causal mechanisms can be statistically investigated by mediation analysis, where a set of linear regression models is fitted and the estimates of ‘mediation effects’ are computed from the fitted models. For cases where a particular SNP is both a cis-eQTL and a trans-eQTL, we used mediation analysis to test if the effect we observe between the eQTL SNP and the target trans gene is mediated at least in part through the SNP’s effect on the cis gene. We tested all five trans-eQTL hotspots to find only rs10993994 gave significant results (Supplementary Table 8), so we investigated this hotspot further. The SNP rs10993994 is located in the promoter of the MSMB gene, which encodes β-microseminoprotein (β-MSP), one of the major secretory products of the prostate; this SNP is known to alter promoter function (27).
Out of five trans-eQTLs of the rs10993994 SNP, three appear to be mediated through MSMB expression levels (SNHG11, SPON2 and NDRG1) while none appear to be mediated through NCOA4 and AGAP7 (Table 1; Supplementary Table 8). MSMB and NCOA4 are only 6 Mbp apart and are both known cis-eQTL target genes for rs10993994 (5). As this cis-eQTL rs10993994 has been previously proposed to mediate prostate cancer risk through both MSMB and NCOA4 cis genes (5), this demonstrates how increasing sample size and analysis of trans-eQTLs and mediation as proposed here will build our understanding of the regulatory networks underlying prostate cancer risk. A second SNP at the MSMB locus, rs3123078, is also associated with SNHG11 and mediated through MSMB (P < 0.01).
Table 1.
Results from the mediation analysis testing if rs10993994’s effects on trans genes is mediated through cis target genes
| rs10993994 | |||
|---|---|---|---|
| Cis | Trans | ACME P-value | ADE P-value |
| MSMB | SNHG11 | <0.01 | 0.50 |
| PTPRO | 0.06 | 0.76 | |
| SPON2 | 0.04 | 0.26 | |
| NDRG1 | 0.04 | 0.58 | |
| ACPP | 0.94 | 0.94 | |
| NCOA4 | SNHG11 | 0.98 | 0.02 |
| PTPRO | 0.96 | 0.78 | |
| SPON2 | 0.92 | 0.38 | |
| NDRG1 | 0.98 | 0.74 | |
| ACPP | 1.00 | 0.64 | |
| AGAP7 | SNHG11 | 0.86 | 0.02 |
| PTPRO | 0.88 | 0.86 | |
| SPON2 | 1.00 | 0.44 | |
| NDRG1 | 0.84 | 0.56 | |
| ACPP | 0.88 | 0.90 | |
ACME, average causal mediation effect; ADE, average direct effect. Significant p-values are highlighted in bold.
Colocalization analysis of trans-eQTLs
We hypothesized that for a true trans-eQTL, besides a significant result from mediation analysis, we would observe colocalization of the signals of the cis- and trans-eQTLs. While mediation analysis took into consideration only one SNP at a time, colocalization allowed us to investigate all the SNPs in the region. Colocalization further allowed the use of meta-analysis results rather than a single dataset used for mediation analysis. A high posterior probability for H3 indicates distinct causal variants, whereas a high posterior probability for H4 indicates common shared variants, in other words evidence for cis-mediation (see section Materials and Methods).
Applying colocalization analysis to the cis- and trans-eQTLs at the MSMB/NCOA4 locus we found strong evidence that the same SNPs are driving the association with MSMB and SNHG11. This is indicated by a high H4 posterior probability (H4 posterior probability 91.4% in normal tissue and 66.6% in tumor tissue; Fig. 3), along with similar patterns of association of the SNPs between the cis-MSMB and trans-SNHG11, further supporting the high H4 posterior probabilities (Fig. 4A, E, B and F). In the normal tissue, none of the other trans-eQTLs showed evidence for colocalization with MSMB or NCOA4, though there was some evidence for colocalization of AGAP7 and SNHG11 eQTL signals (Fig. 3A). In contrast, in the tumor tissue, the SNPs driving both MSMB and NCOA4 expression colocalize with the SNPs driving trans expression of SNHG11, NDRG1 and ACPP. As colocalization analysis was designed for independent samples (28), we wanted to ensure that our use of overlapping samples did not cause us to substantially bias the results towards H4. We randomly split each dataset into two halves, one half was used to test the cis-eQTL and the other was used to test the trans-eQTL. Similar results were observed (Supplementary Table 10), though with less confidence that we attribute to the smaller sample size.
Figure 3.
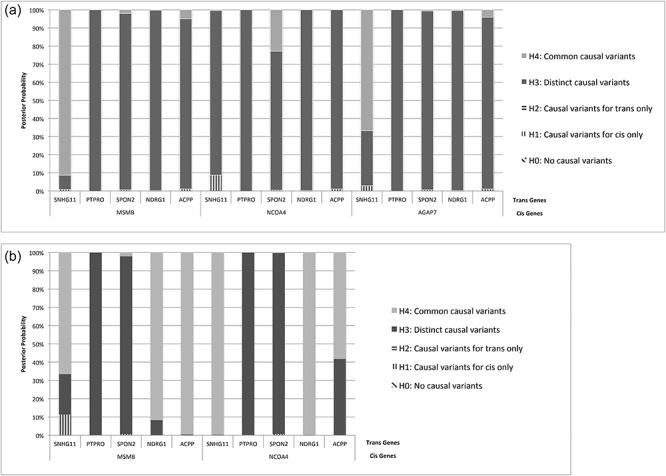
Colocalization results for SNPs at the MSMB/NCOA4/AGAP7 locus associated with cis and trans genes for (A) normal and (B) tumor. Posterior probabilities of H0 (no causal variant), H1 (causal variant for cis only), H2 (causal variant for trans only), H3 (distinct causal variants) and H4 (common causal variants) are reported; the highest probability for each gene pair is in bold.
Figure 4.
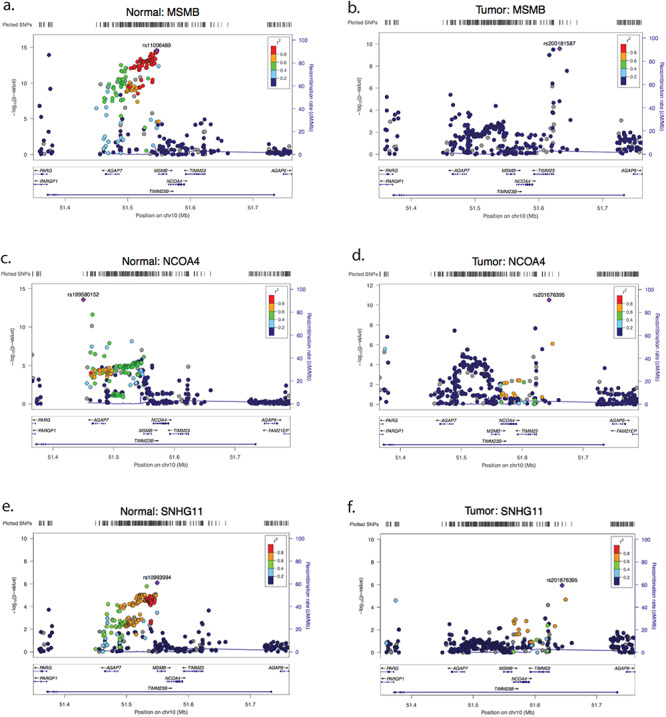
Association of SNPs at the MSMB/NCOA4 locus with MSMB (A and B), NCOA4 (C and D) and SNHG11 (E and F) in normal (benign) and tumor tissue. All P-values are from the meta-analysis. The color of each SNP indicates the linkage disequilibrium with the most significant SNP in each plot, whose identity is printed.
Surprisingly, the colocalization results at this locus showed marked differences between the tumor and normal. To address this further, we directly compared the eQTL signals between tumor and normal samples at this locus. Striking differences are observed through H3 and H4 posterior probabilities along with the patterns of SNP associations, suggesting a clear difference between the effects of specific variants in regulatory regions for normal and tumor tissues (Fig. 4; Supplementary Table 9). For both MSMB and NCOA4, colocalization analysis suggests that SNPs at the locus are associated with expression changes in both genes in tumor and normal tissues. However, different SNPs are responsible for the signals in tumor and normal tissues as indicated by the H3 posterior probability of 100% for both genes when comparing tumor data to normal data (Supplementary Table 9) and very different patterns of SNP associations (Fig. 4). In the normal tissue, different SNPs appear to be associated with expression of MSMB and NCOA4 (H3 posterior probabilities of 100% for both, Fig. 4A and C), but not AGAP7 (H4 posterior probability of 59.8%, Supplementary Table 9). In contrast, the eQTL signals for MSMB and NCOA4 are observed to colocalize in tumor tissue (H4 posterior probability of 84.5%, Fig. 4B and D; Supplementary Table 9).
Validation using CRISPR/Cas9-mediated genome editing
To test if alteration of MSMB expression directly influences SNHG11 levels, we took advantage of isogenic clones of LNCaP cell lines we had previously generated, where one copy of the heterozygous SNP rs10993994 was deleted by CRISPR/Cas9 editing (29). As we had previously shown, removing the T-allele results in an over 100-fold increase in MSMB expression. We also observed significant, but more modest, increases in SNHG11, SPON2 and ACPP expression in this cell line (Fig. 5), consistent with the colocalization results for tumor tissue (Fig. 3B).
Figure 5.
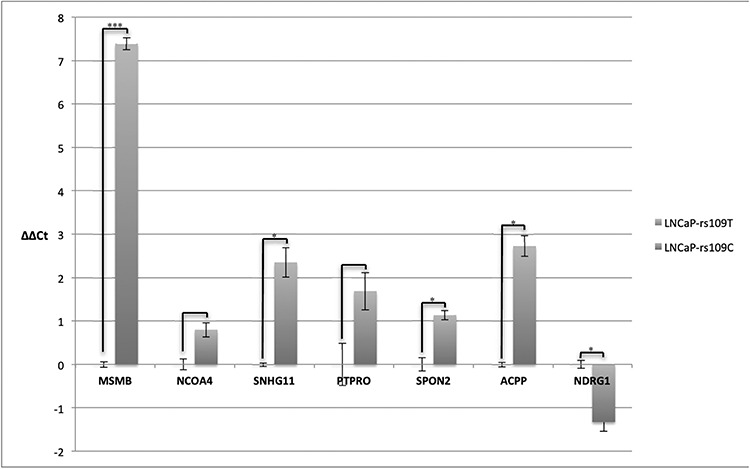
mRNA expression changes when the C-allele of rs10993994 is present compared with the T-allele (reference). Results are reported as –ΔΔCT and are therefore on the log scale for expression. The results for each gene are normalized to the result from the T-allele cell line; each measurement was performed in duplicate in two qPCR wells. Error bars represent the standard error of measure. ***P < 0.001 and *P < 0.05.
Discussion
Here, we have conducted a comprehensive search of cis- and trans-target genes whose expression is modified by known prostate cancer risk SNPs using an integrative meta-analysis of several prostate eQTL datasets. These findings demonstrate that meta-analysis can be an efficient method to obtain the sample size necessary in eQTL studies to identify weak trans-effects after correcting for multiple testing.
Using this approach, the strongest evidence for trans-effects mediated through a cis-effect was for rs10993994, a known cis-eQTL for MSMB. MSMB codes for β-MSP, one of the three most abundant proteins secreted by the prostate (30). Histopathological studies suggest reduced levels of β-MSP are correlated with prostate tumors and worse outcomes (31–33). It has been found to exhibit tumor suppressive properties in vitro (5, 34, 35); other studies have suggested a fungicidal activity for β-MSP (36).
Our mediation analysis suggests a trans-association of SNHG11, NDRG1 and SPON2 expression with prostate cancer risk SNP rs10993994 to be mediated by MSMB expression. A previous study also found the same for NDRG1 and MSMB (18), further supporting our mediation approach.
Of the trans effects of rs10993994 mediated through MSMB, evidence was strongest for SNHG11, as it had the smallest average causal mediation effects (ACME) P-value (<0.01, Table 1), including our finding that removing one copy of rs1099394 in LNCaP results in changes in SNHG11 expression in an allele-specific manner. SNHG11 is a small nucleolar RNA (snoRNA) host gene. Transcripts from two introns from this gene are trimmed down and processed into the H/ACA box snoRNA genes SNORA60 (also known as ACA60) and SNORA71E (also known as ACA39). H/ACA snoRNA genes guide the pseudouridylation of specific uredines in RNA; SNORA60 guides pseudouridylation of uridine 1004 in 18S ribosomal RNA, while the target of SNORA71E is unknown (37).
It is also notable that the colocalization analysis of tumor samples and the CRISPR/Cas9 experiment suggest rs10993994 is a trans-eQTL for ACPP mediated through MSMB, while not such effect is observed in the normal tissue through either mediation or colocalization analysis. ACPP codes for prostatic acid phosphatase. Prostatic acid phosphatase, along with the prostate specific antigen and β-microseminoprotein (coded for by MSMB), is one of the three predominant proteins secreted by the prostate (30). It is also the prostate antigen that the therapeutic prostate cancer vaccine Sipuleucel-T targets (38). Whether rs10993994 correlates with levels of prostatic acid phosphatase in prostate secretions or on the membrane of prostate cancer cells is not known.
From our in-depth analysis of the MSMB/NCOA4 locus, we observed that the variants driving MSMB expression differ in tumor and normal cells. This raises the possibility that, at least at this locus, the regulatory network was rewired during the oncogenic transformation process. Notably, the locus remains a cis-eQTL for both MSMB and NCOA4; it is the specific SNPs driving the association that appear to change. Whether this is a general phenomenon across eQTLs remains an open question.
It should be noted that for our analyses of both normal and tumor samples, one study represented the majority of the cases and could be driving our results. Furthermore, the normal tissue analysis combined adjacent normal tissue from prostate cancer patients with normal prostates from patients who underwent surgery or were deceased from other causes. Besides using an integrative meta-analysis approach, larger single studies of prostate eQTLs will be needed to insure that one study is not driving the analysis.
Our approach allows efficient and systematic dissection of molecular phenotypes and their mediators in human disease. To the best of our knowledge, this is the first meta-analysis study of prostate eQTL data, as well as the first application of colocalization analyses to cis- and trans-eQTLs. The meta-analysis further identified numerous new cis- and trans-eQTLs of interest that may play a role in prostate cancer. Combining mediation analysis and colocalization analysis allows us to both consider testing focused on one SNP and analysis of an entire SNP set near the cis gene. These results suggest a generalizable computational framework that can be applied to identify additional cis-mediated trans-eQTLs.
The approaches presented here are generally applicable not just to studies of gene expression but to additional data types such as DNA methylation and histone marks as population scale assays for these variables improve. By integrating meta-analysis of eQTLs with mediation and colocalization analyses for prostate cancer risk loci, we identified multiple plausible downstream effects mediated by prostate cancer risk genes MSMB and SNHG11. Our work provides the foundation for novel hypotheses for further investigation into the functional genetics of prostate cancer susceptibility and tumor progression.
Materials and Methods
Study subjects and tissue samples
Prostate tissue samples were obtained from prostate cancer patients immediately after prostatectomy, as previously described (39). A tissue sample wedge was obtained from the suspected cancerous lobe and another from the presumed control lobe minutes after the prostate was surgically removed. Each tissue slice’s immediate adjacent tissue was subsequently histologically examined by a highly experienced genito-urinary trained pathologist and classified as either histological normal, prostatic intraepithelial neoplasia (PIN) or cancerous with an assigned Gleason grade between 2 and 5. All samples were gathered under a study protocol approved by the local ethics committee and written informed consent was obtained from each participant. The study protocol is in accordance with the Helsinki Declaration of 1975, as revised in 1996.
DNA extraction
DNA was extracted from prostate tissue samples with phenol–chloroform as previously described (40). Briefly, tissue samples were lysed and treated with proteinase K and RNase A. Phenol/chloroform/isoamyl alcohol was added and the aqueous phase extracted. Twice, chloroform/isoamyl was added and the aqueous phase extracted. DNA was precipitated with isopropanol and washed with ethanol twice. Finally, samples were dried and re-suspended in nuclease free water.
RNA extraction
Total RNA was extracted as previously described (41). A known amount of a previously established internal RNA standard was added to each sample after cell lysis (42). This RNA standard derives from an artificial and mutant form of KLK3 known as mmPSA and is inconsequential to the rest of the analysis.
Expression microarray processing
Quality control was performed on each RNA sample; low quality samples were discarded for low RNA integrity, as measured visually and by A260/280 and A230/260 ratios. For each sample passing QC, 200 ng of RNA was prepared into cDNA and then hybridized on Illumina Human HT-12 microarrays. Raw data were analyzed in Illumina’s BeadStudio and exported into Partek Genomic Suite format. Genes that were not expressed in our samples (defined as <5% of samples expressed above negative control probes) were removed. Gene-level microarray data were quantile normalized before analysis.
Processing of genotype data
As each of these datasets generated germline SNP data using a different platform, the direct overlap of SNPs between all datasets is limited. Therefore, we took advantage of the linkage disequilibrium structure of the genome and used established tools to impute all common variants in all of the samples. Specifically, we first performed standard quality check using PLINK (43) on the genotype data in the discovery cohorts by removing SNPs and individuals with excess missingness, excess heterozygosity or deviation from Hardy–Weinberg equilibrium. Principal component analysis was used to evaluate presence of batch effect and population substructure (44) in Finland dataset. We then performed phasing and imputation with SHAPEIT (45) and IMPUTE2 (46) from the 1000 genomes panel. We only considered SNPs with an imputation quality of r2 > 0.5 for further analysis.
Selection of prostate cancer risk SNPs
Our approach to studying prostate cancer eQTLs has focused on those SNPs previously identified as prostate cancer risk factors. This primary set of prostate cancer risk SNPs to be analyzed was derived from the published literature and the NHGRI/EBI Catalog (47, 48), only considering SNPs for which the evidence of association exceeds the genome-wide significance level of 5 × 10⁻⁷. We augmented this with several SNPs of interest to our laboratory, including some that had only been previously associated with levels of prostate-secreted proteins. This list consisted of 117 SNPs, detailed in Supplementary Table 1 that were manually curated and reduced by removing SNPs in linkage disequilibrium.
Datasets and processing for meta-analysis
To perform the meta-analysis, we obtained genotype and gene expression data from three additional datasets from dbGaP: Functional Significance of Prostate Cancer Risk SNPs (phs000985.v1.p1), TCGA (phs000178.v1.p1) and the GTEx Project (phs000424.v6.p1). Genotype and gene expression data for GTEx and phs000985 were downloaded from dbGaP; genotype and gene expression data for TCGA were downloaded as previously described (49). Reads Per Kilobase Million (RPKM) normalized gene expression values were used for all datasets. Genes were selected based on expression thresholds of >0.1 RPKM in at least two individuals. For genotype data, QC and imputation were performed as described above.
Meta-analysis of cis- and trans-eQTLs
Meta-analysis of eQTLs consisted of two steps; conducting the initial eQTL analysis in each cohort independently and then combining the results. Our eQTL pipeline consists of first adjusting gene expression for known covariates that are available such as principal components representing population structure (44) and hidden confounders (50), as well as batch or other differences among samples, using a previously described approach (19). Then, for each SNP/gene pair to be tested a simple linear regression model is used and the significance estimated from the T statistic. For each analysis, meta-analysis was applied using METAL software in ‘Sample Size’ mode (51). P-values were adjusted for multiple comparisons using the FDR method. eQTLs at FDR of 10% were considered as significant. We define SNPs that reside within 2 Mb of the transcription start site of an associated gene to be a cis-eQTLs for that gene, and SNPs that are at a distance >5 Mb from the transcriptional start site (TSS) of an associated transcript on the same chromosome or on a different chromosome to be trans-eQTLs.
Mediation testing of trans-eQTLs
Mediation testing was conducted using the ‘mediation’ package in R (52). For the primary mediation analysis, we used the largest single dataset representative of the tissue type (Mayo Clinic for normal, TCGA for tumor), as the mediation software does not work out of the box in the meta-analysis framework. Significant mediation effects were defined at P < 0.05. A significant P-value in ACME indicates an estimated average increase in the dependent variable among the treatment group that arrives as a result of the mediators, suggesting cis mediation of the trans-eQTL.
Colocalization analysis of trans-eQTLs
SNP selection was based upon the regions of the cis gene being investigated. ‘coloc’ R package’s coloc. Abf function (53) was used to perform colocalization analysis. Based on P-values and SNP minor allele frequencies, this function calculates posterior probabilities of different causal variant configurations under the assumption of a single causal variant for each eQTL association. Posterior probabilities are calculated in terms of five percentages denoted by H0, H1, H2, H3 and H4, where they represent no causal variant, causal variants for cis association only, causal variants for trans association only, distinct causal variants and common causal variants, respectively. Reported result is the posterior probability H4 of the SNP being causal for the shared signal.
Generation of LNCaP clones with isogenic allelic deletion at the rs10993994 site
The details of targeting the rs10993994 site to engineer cells with isogenic allelic deletion were mentioned in our previous work (29). Briefly, PX458-rs10993994-g4a and PX459v2-rs10993994-g4b plasmids were used to target the site. The prostate cancer cell line LNCaP (CRL-1740, ATCC, Rockville, MD) was maintained in Roswell Park Memorial Institute (RPMI) 1640 medium (Gibco) supplemented with 15% fetal bovine serum (FBS) and 1% penicillin/streptomycin (Gibco). At 30–70% confluency, 1 μg each of PX458-rs10993994-g4a and PX459v2-rs10993994-g4b plasmids was mixed at room temperature with 10 μL Lipofectmine 2000 and 250 μL Opti-MEM mix. Twenty minutes later, the mix was gently and evenly added to cells cultured in six-well plate. Cells were returned to incubator and changed to fresh medium 4–6 h later. Forty-eight hours later, 2 μg/mL puromycin (Santa Cruz Biotechnology) was added for selection which lasted for 3–7 days. Bulk transfected cells were then transferred to 96-well plate by serial dilution and cultured in 0.22 μm Millex membrane (Millipore) filtered LNCaP condition medium. Single clones started to form in about 3 weeks and expanded for genotyping and qPCR analysis. To identify clones with isogenic allelic deletion, genomic DNA was extracted from each clone using DNeasy kit (Qiagen) followed by PCR amplification with flanking primers (29). Amplified products were run on 1.5% agarose gel, clones with rs10993994 allelic deletion showed both 274 and 479 bp bands. All bands were then excised, purified and sequenced by Sanger sequencing, only the clones with the least non-specific editing in the region were used for further analysis. In the end, LNCaP-rs10993994T and LNCaP-rs10993994C clones were generated for the rs10993994 site.
Total RNA extraction and qPCR analysis
To compare the differential gene expression level of MSMB, NCOA4, ACPP, SNHG11, SPON2 and NDRG1 from above generated isogenic clones, total RNA samples were extracted with RNeasy Mini kit (Qiagen, Germantown, MD), quantified by Nanodrop spectrophotometer (ThermoScientific, Waltham, MA, USA) and quality assessed using Agilent RNA 6000 Nano kit (Agilent). cDNA were then generated using the High Capacity cDNA Reverse Transcription Kit (Applied Biosystems, Waltham, MA, USA) with 1 μg RNA for each clone. TaqMan gene-specific primers (Life Technologies) were used for real-time qPCR: MSMB (Hs00159303_m1), NCOA4 (Hs01033772_g1), ACPP (Hs00173475_m1), SNHG11 (Hs00290821_m1), SPON2 (Hs00202813_m1), NDRG1 (Hs00608387_m1); GAPDH was used as internal control. The reactions were setup in duplicate following Taqman protocol and performed on a ViiA7 qPCR machine (Applied Biosystems), then analyzed with the ΔΔCT method (Applied Biosystems, cms_042380).
Supplementary Material
Acknowledgements
We are grateful to Eli Stahl and Amanda Dobbyn for helpful discussions.
Conflict of Interest Statement. None declared.
Funding
This work was supported by the National Cancer Institute (R01 CA175491, R03 CA165082, Cancer Center Support Grant to MSKCC [P30 CA008748], SPORE grant in prostate cancer to Dr. H. Scher [P50 CA92629]), National Human Genome Research Institute (U01 HG007033), the Sidney Kimmel Center for Prostate and Urological Cancers, David H. Koch through the Prostate Cancer Foundation, the Swedish Cancer Society (CAN 2017/559), the Swedish Research Council (VR-MH project no. 2016-02974), General Hospital in Malmö Foundation for Combating Cancer, and the Geoffrey Beene Cancer Research Center at MSKCC.
Conflict of Interest: Hans Lilja holds a patent on assays to measure intact PSA and is named on a patent for a statistical method to detect prostate cancer that has been commercialized as 4Kscore test by OPKO Health. Hans Lilja receives royalties from sales of the test and has stock options in OPKO Health.
References
- 1. Al Olama A.A., Kote-Jarai Z., Berndt S.I., Conti D.V., Schumacher F., Han Y., Benlloch S., Hazelett D.J., Wang Z., Saunders E. et al. (2014) A meta-analysis of 87,040 individuals identifies 23 new susceptibility loci for prostate cancer. Nat. Genet., 46, 1103–1109. [DOI] [PMC free article] [PubMed] [Google Scholar]
- 2. Schumacher F.R., Al Olama A.A., Berndt S.I., Benlloch S., Ahmed M., Saunders E.J., Dadaev T., Leongamornlert D., Anokian E., Cieza-Borrella C. et al. (2018) Association analyses of more than 140, 000 men identify 63 new prostate cancer susceptibility loci. Nat. Genet., 50, 928–936. [DOI] [PMC free article] [PubMed] [Google Scholar]
- 3. Hoffmann T.J., Van Den Eeden S.K., Sakoda L.C., Jorgenson E., Habel L.A., Graff R.E., Passarelli M.N., Cario C.L., Emami N.C., Chao C.R. et al. (2015) A large multiethnic genome-wide association study of prostate cancer identifies novel risk variants and substantial ethnic differences. Cancer Discov., 5, 878–891. [DOI] [PMC free article] [PubMed] [Google Scholar]
- 4. Xu X., Hussain W.M., Vijai J., Offit K., Rubin M.A., Demichelis F. and Klein R.J. (2014) Variants at IRX4 as prostate cancer expression quantitative trait loci. Eur. J. Hum. Genet., 22, 558–563. [DOI] [PMC free article] [PubMed] [Google Scholar]
- 5. Pomerantz M.M., Shrestha Y., Flavin R.J., Regan M.M., Penney K.L., Mucci L.A., Stampfer M.J., Hunter D.J., Chanock S.J., Schafer E.J. et al. (2010) Analysis of the 10q11 cancer risk locus implicates MSMB and NCOA4 in human prostate tumorigenesis. PLoS Genet., 6, e1001204. doi: 10.1371/journal.pgen.1001204. [DOI] [PMC free article] [PubMed] [Google Scholar]
- 6. Thibodeau S.N., French A.J., McDonnell S.K., Cheville J., Middha S., Tillmans L., Riska S., Baheti S., Larson M.C., Fogarty Z. et al. (2015) Identification of candidate genes for prostate cancer-risk SNPs utilizing a normal prostate tissue eQTL data set. Nat. Commun., 6, 8653. [DOI] [PMC free article] [PubMed] [Google Scholar]
- 7. Penney K.L., Sinnott J.A., Tyekucheva S., Gerke T., Shui I.M., Kraft P., Sesso H.D., Freedman M.L., Loda M., Mucci L.A. et al. (2015) Association of prostate cancer risk variants with gene expression in normal and tumor tissue. Cancer Epidemiol. Biomarkers Prev., 24, 255–260. [DOI] [PMC free article] [PubMed] [Google Scholar]
- 8. Grisanzio C., Werner L., Takeda D., Awoyemi B.C., Pomerantz M.M., Yamada H., Sooriakumaran P., Robinson B.D., Leung R., Schinzel A.C. et al. (2012) Genetic and functional analyses implicate the NUDT11, HNF1B, and SLC22A3 genes in prostate cancer pathogenesis. Proc. Nat. Acad. Sci. U.S.A., 109, 11252–11257. [DOI] [PMC free article] [PubMed] [Google Scholar]
- 9. Chen X., McClelland M., Jia Z., Rahmatpanah F.B., Sawyers A., Trent J., Duggan D. and Mercola D. (2015) The identification of trans-associations between prostate cancer GWAS SNPs and RNA expression differences in tumor-adjacent stroma. Oncotarget, 6, 1865–1873. doi: 10.18632/oncotarget.2763. [DOI] [PMC free article] [PubMed] [Google Scholar]
- 10. Xu X., Valtonen-Andre C., Savblom C., Hallden C., Lilja H. and Klein R.J. (2010) Polymorphisms at the microseminoprotein-beta locus associated with physiologic variation in beta-microseminoprotein and prostate-specific antigen levels. Cancer Epidemiol. Biomarkers Prev., 19, 2035–2042. [DOI] [PMC free article] [PubMed] [Google Scholar]
- 11. Klein R.J., Hallden C., Cronin A.M., Ploner A., Wiklund F., Bjartell A.S., Stattin P., Xu J., Scardino P.T., Offit K. et al. (2010) Blood biomarker levels to aid discovery of cancer-related single-nucleotide polymorphisms: kallikreins and prostate cancer. Cancer Prev. Res., 3, 611–619. [DOI] [PMC free article] [PubMed] [Google Scholar]
- 12. Savblom C., Hallden C., Cronin A.M., Sall T., Savage C., Vertosick E.A., Klein R.J., Giwercman A. and Lilja H. (2014) Genetic variation in KLK2 and KLK3 is associated with concentrations of hK2 and PSA in serum and seminal plasma in young men. Clin. Chem., 60, 490–499. [DOI] [PMC free article] [PubMed] [Google Scholar]
- 13. Sullivan J., Kopp R., Stratton K., Manschreck C., Corines M., Rau-Murthy R., Hayes J., Lincon A., Ashraf A., Thomas T. et al. (2015) An analysis of the association between prostate cancer risk loci, PSA levels, disease aggressiveness and disease-specific mortality. Br. J. Cancer, 113, 166–172. doi: 10.1038/bjc.2015.199. [DOI] [PMC free article] [PubMed] [Google Scholar]
- 14. Gusev A., Shi H., Kichaev G., Pomerantz M., Li F., Long H.W., Ingles S.A., Kittles R.A., Strom S.S., Rybicki B.A. et al. (2016) Atlas of prostate cancer heritability in European and African-American men pinpoints tissue-specific regulation. Nat. Commun., 7, 10979. [DOI] [PMC free article] [PubMed] [Google Scholar]
- 15. Whitington T., Gao P., Song W., Ross-Adams H., Lamb A.D., Yang Y., Svezia I., Klevebring D., Mills I.G., Karlsson R. et al. (2016) Gene regulatory mechanisms underpinning prostate cancer susceptibility. Nat. Genet., 48, 387. [DOI] [PubMed] [Google Scholar]
- 16. Boyle E.A., Li Y.I. and Pritchard J.K. (2017) An expanded view of complex traits: from polygenic to omnigenic. Cell, 169, 1177–1186. doi: 10.1016/j.cell.2017.05.038. [DOI] [PMC free article] [PubMed] [Google Scholar]
- 17. Yao C., Joehanes R., Johnson A.D., Huan T., Liu C., Freedman J.E., Munson P.J., Hill D.E., Vidal M. and Levy D. (2017) Dynamic role of trans regulation of gene expression in relation to complex traits. Am. J. Hum. Genet., 100, 985–986. doi: 10.1016/J.AJHG.2017.02.003. [DOI] [PMC free article] [PubMed] [Google Scholar]
- 18. Larson N.B., McDonnell S.K., Fogarty Z., Larson M.C., Cheville J., Riska S., Baheti S., Weber A.M., Nair A.A., Wang L. et al. (2017) Network-directed cis-mediator analysis of normal prostate tissue expression profiles reveals downstream regulatory associations of prostate cancer susceptibility loci. Oncotarget, 8, 85896–85908. doi: 10.18632/oncotarget.20717. [DOI] [PMC free article] [PubMed] [Google Scholar]
- 19. Schadt E.E., Molony C., Chudin E., Hao K., Yang X., Lum P.Y., Kasarskis A., Zhang B., Wang S., Suver C. et al. (2008) Mapping the genetic architecture of gene expression in human liver. PLoS Biol., 6, e107. doi: 10.1371/journal.pbio.0060107. [DOI] [PMC free article] [PubMed] [Google Scholar]
- 20. Nguyen H.H., Takata R., Akamatsu S., Shigemizu D., Tsunoda T., Furihata M., Takahashi A., Kubo M., Kamatani N., Ogawa O. et al. (2012) IRX4 at 5p15 suppresses prostate cancer growth through the interaction with vitamin D receptor, conferring prostate cancer susceptibility. Hum. Mol. Genet., 21, 2076–2085. doi: 10.1093/hmg/dds025. [DOI] [PubMed] [Google Scholar]
- 21. Li Q., Stram A., Chen C., Kar S., Gayther S., Pharoah P., Haiman C., Stranger B., Kraft P. and Freedman M.L. (2014) Expression QTL-based analyses reveal candidate causal genes and loci across five tumor types. Hum. Mol. Genet., 23, 5294–5302. doi: 10.1093/hmg/ddu228. [DOI] [PMC free article] [PubMed] [Google Scholar]
- 22. Consortium G.T., Ardlie K.G., Deluca D.S., Segre A.V., Sullivan T.J., Young T.R., Gelfand E.T., Trowbridge C.A., Maller J.B., Tukiainen T. et al. (2015) The genotype-tissue expression (GTEx) pilot analysis: multitissue gene regulation in humans. Science, 348, 648–660. [DOI] [PMC free article] [PubMed] [Google Scholar]
- 23. Abeshouse A., Ahn J., Akbani R., Ally A., Amin S., Andry C.D., Annala M., Aprikian A., Armenia J., Arora A. et al. (2015) The molecular taxonomy of primary prostate cancer. Cell, 163, 1011–1025. doi: 10.1016/j.cell.2015.10.025. [DOI] [PMC free article] [PubMed] [Google Scholar]
- 24. Su Q. and Xin L. (2016) Notch signaling in prostate cancer: refining a therapeutic opportunity. Histol. Histopathol., 31, 149–157. [DOI] [PMC free article] [PubMed] [Google Scholar]
- 25. Akamatsu S., Takata R., Ashikawa K., Hosono N., Kamatani N., Fujioka T., Ogawa O., Kubo M., Nakamura Y. and Nakagawa H. (2010) A functional variant in NKX3.1 associated with prostate cancer susceptibility down-regulates NKX3.1 expression. Hum. Mol. Genet., 19, 4265–4272. doi: 10.1093/hmg/ddq350. [DOI] [PubMed] [Google Scholar]
- 26. Huang Q., Whitington T., Gao P., F Lindberg J., Yang Y., Sun J., Väisänen M.-R., Szulkin R., Annala M., Yan J. et al. (2014) A prostate cancer susceptibility allele at 6q22 increases RFX6 expression by modulating HOXB13 chromatin binding. Nat. Genet., 46, 126–135. [DOI] [PubMed] [Google Scholar]
- 27. Lou H., Yeager M., Li H., Bosquet J.G., Hayes R.B., Orr N., Yu K., Hutchinson A., Jacobs K.B., Kraft P. et al. (2009) Fine mapping and functional analysis of a common variant in MSMB on chromosome 10q11.2 associated with prostate cancer susceptibility. Proc. Nat. Acad. Sci. U.S.A., 106, 7933–7938. doi: 10.1073/pnas.0902104106. [DOI] [PMC free article] [PubMed] [Google Scholar]
- 28. Giambartolomei C., Zhenli Liu J., Zhang W., Hauberg M., Shi H., Boocock J., Pickrell J., Jaffe A.E., Pasaniuc B. and Roussos P. (2017) A Bayesian framework for multiple trait colocalization from summary association statistics. Bioinformatics, 34, 2538–2545. doi: 10.1101/155481. [DOI] [PMC free article] [PubMed] [Google Scholar]
- 29. Wang X., Hayes J., Xu D., Gao X., Mehta D., Lilja H. and Klein R. (2018) Validation of prostate cancer risk variants by CRISPR/Cas 9 mediated genome editing. bioRxiv, 337022. doi: 10.1101/337022. [DOI] [PMC free article] [PubMed] [Google Scholar]
- 30. Lilja H. and Abrahamsson P.A. (1988) Three predominant proteins secreted by the human prostate gland. Prostate, 12, 29–38. [DOI] [PubMed] [Google Scholar]
- 31. Bjartell A.S., Al-Ahmadie H., Serio A.M., Eastham J.A., Eggener S.E., Fine S.W., Udby L., Gerald W.L., Vickers A.J., Lilja H. et al. (2007) Association of cysteine-rich secretory protein 3 and -microseminoprotein with outcome after radical prostatectomy. Clin. Cancer Res., 13, 4130–4138. [DOI] [PMC free article] [PubMed] [Google Scholar]
- 32. Whitaker H.C., Kote-Jarai Z., Ross-Adams H., Warren A.Y., Burge J., George A., Bancroft E., Jhavar S., Leongamornlert D., Tymrakiewicz M. et al. (2010) The rs10993994 risk allele for prostate cancer results in clinically relevant changes in microseminoprotein-beta expression in tissue and urine. PLoS One, 5, e13363. [DOI] [PMC free article] [PubMed] [Google Scholar]
- 33. Sjöblom L., Saramäki O., Annala M., Leinonen K., Nättinen J., Tolonen T., Wahlfors T., Nykter M., Bova G.S., Schleutker J. et al. (2016) Microseminoprotein-beta expression in different stages of prostate cancer. PLoS One, 11, e0150241. [DOI] [PMC free article] [PubMed] [Google Scholar]
- 34. Garde S.V., Basrur V.S., Li L., Finkelman M.A., Krishan A., Wellham L., Ben-Josef E., Haddad M., Taylor J.D., Porter A.T. et al. (1999) Prostate secretory protein (PSP94) suppresses the growth of androgen-independent prostate cancer cell line (PC3) and xenografts by inducing apoptosis. Prostate, 38, 118–125. [DOI] [PubMed] [Google Scholar]
- 35. Shukeir N., Arakelian A., Kadhim S., Garde S. and Rabbani S.A. (2003) Prostate secretory protein PSP-94 decreases tumor growth and hypercalcemia of malignancy in a syngenic in vivo model of prostate cancer. Cancer Res., 63, 2072–2078. [PubMed] [Google Scholar]
- 36. Edström Hägerwall A.M.L., Rydengård V., Fernlund P., Mörgelin M., Baumgarten M., Cole A.M., Malmsten M., Kragelund B.B. and Sørensen O.E. (2012) β-Microseminoprotein endows post coital seminal plasma with potent Candidacidal activity by a calcium- and pH-dependent mechanism. PLoS Pathog., 8, e1002625. [DOI] [PMC free article] [PubMed] [Google Scholar]
- 37. Kiss A.M., Jády B.E., Bertrand E. and Kiss T. (2004) Human box H/ACA pseudouridylation guide RNA machinery. Mol. Cell. Biol., 24, 5797–5807. [DOI] [PMC free article] [PubMed] [Google Scholar]
- 38. Kantoff P.W., Higano C.S., Shore N.D., Berger E.R., Small E.J., Penson D.F., Redfern C.H., Ferrari A.C., Dreicer R., Sims R.B. et al. (2010) Sipuleucel-T immunotherapy for castration-resistant prostate cancer. N. Engl. J. Med., 363, 411–422. [DOI] [PubMed] [Google Scholar]
- 39. Väänänen R.-M., Lilja H., Kauko L., Helo P., Kekki H., Cronin A.M., Vickers A.J., Nurmi M., Alanen K., Bjartell A. et al. (2014) Cancer-associated changes in the expression of TMPRSS2-ERG, PCA3, and SPINK1 in histologically benign tissue from cancerous vs noncancerous prostatectomy specimens. Urology, 83, 511.e1-511.e7. [DOI] [PMC free article] [PubMed] [Google Scholar]
- 40. Berger M.F., Lawrence M.S., Demichelis F., Drier Y., Cibulskis K., Sivachenko A.Y., Sboner A., Esgueva R., Pflueger D., Sougnez C. et al. (2011) The genomic complexity of primary human prostate cancer. Nature, 470, 214–220. doi: 10.1038/nature09744. [DOI] [PMC free article] [PubMed] [Google Scholar]
- 41. Valta M.P., Tuomela J., Bjartell A., Valve E., Väänänen H.K. and Härkönen P. (2008) FGF-8 is involved in bone metastasis of prostate cancer. Int. J. Cancer, 123, 22–31. [DOI] [PubMed] [Google Scholar]
- 42. Nurmi J., Lilja H. and Ylikoski A. (2000) Time-resolved fluorometry in end-point and real-time PCR quantification of nucleic acids. Luminescence, 15, 381–388. [DOI] [PubMed] [Google Scholar]
- 43. Purcell S., Neale B., Todd-Brown K., Thomas L., Ferreira M.A., Bender D., Maller J., Sklar P., Bakker P.I., Daly M.J. et al. (2007) PLINK: a tool set for whole-genome association and population-based linkage analyses. Am. J. Hum. Genet., 81, 559–575. [DOI] [PMC free article] [PubMed] [Google Scholar]
- 44. Price A.L., Patterson N.J., Plenge R.M., Weinblatt M.E., Shadick N.A. and Reich D. (2006) Principal components analysis corrects for stratification in genome-wide association studies. Nat. Genet., 38, 904–909. [DOI] [PubMed] [Google Scholar]
- 45. Delaneau O., Marchini J. and Zagury J.F. (2012) A linear complexity phasing method for thousands of genomes. Nat. Methods, 9, 179–181. [DOI] [PubMed] [Google Scholar]
- 46. Howie B.N., Donnelly P. and Marchini J. (2009) A flexible and accurate genotype imputation method for the next generation of genome-wide association studies. PLoS Genet., 5, e1000529. [DOI] [PMC free article] [PubMed] [Google Scholar]
- 47. Hindorff L.A., Sethupathy P., Junkins H.A., Ramos E.M., Mehta J.P., Collins F.S. and Manolio T.A. (2009) Potential etiologic and functional implications of genome-wide association loci for human diseases and traits. Proc. Natl. Acad. Sci., 106, 9362–9367. [DOI] [PMC free article] [PubMed] [Google Scholar]
- 48. MacArthur J., Bowler E., Cerezo M., Gil L., Hall P., Hastings E., Junkins H., McMahon A., Milano A., Morales J. et al. (2017) The new NHGRI-EBI Catalog of published genome-wide association studies (GWAS Catalog). Nucleic Acids Res., 45, D896–D901. [DOI] [PMC free article] [PubMed] [Google Scholar]
- 49. Li W., Middha M., Bicak M., Sjoberg D.D., Vertosick E., Dahlin A., Häggström C., Hallmans G., Rönn A.-C., Stattin P. et al. (2018) Genome-wide scan identifies role for AOX1 in prostate cancer survival. Eur. Urol., 6, 710–719. [DOI] [PMC free article] [PubMed] [Google Scholar]
- 50. Stegle O., Parts L., Piipari M., Winn J. and Durbin R. (2012) Using probabilistic estimation of expression residuals (PEER) to obtain increased power and interpretability of gene expression analyses. Nat. Protoc., 7, 500–507. doi: 10.1038/nprot.2011.457. [DOI] [PMC free article] [PubMed] [Google Scholar]
- 51. Willer C.J., Li Y. and Abecasis G.R. (2010) METAL: fast and efficient meta-analysis of genomewide association scans. Bioinformatics, 26, 2190–2191. [DOI] [PMC free article] [PubMed] [Google Scholar]
- 52. Tingley D., Yamamoto H.T., Kentaro M., Princeton H., Keele L., State P. and Imai K. (2014) Mediation: R package for causal mediation analysis. JSS J. Stat. Softw., 59, 5. [Google Scholar]
- 53. Wallace C. (2013) Statistical testing of shared genetic control for potentially related traits. Genet. Epidemiol., 37, 802–813. [DOI] [PMC free article] [PubMed] [Google Scholar]
Associated Data
This section collects any data citations, data availability statements, or supplementary materials included in this article.