

Abstract
The associations between cognitive function and neuropathological markers in patients with mild cognitive impairment (MCI) and Alzheimer disease (AD) remain only partly defined. We investigated relationships between antemortem global cognitive scores and β-amyloid (Aβ), tau, TDP-43, synaptic proteins and other key AD neuropathological markers assessed by biochemical approaches in postmortem anterior parietal cortex samples from 36 subjects (12 MCI, 12 AD and 12 not cognitively impaired) from the Religious Orders Study. Overall, the strongest negative correlation coefficients associated with global cognitive scores were obtained for insoluble phosphorylated tau (r2 = −0.484), insoluble Aβ42 (r2 = −0.389) and neurofibrillary tangle counts (r2 = −0.494) (all p < 0.001). Robust inverse associations with cognition scores were also established for TDP-43-positive cytoplasmic inclusions (r2 = −0.476), total insoluble tau (r2 = −0.385) and Aβ plaque counts (r2 = −0.426). Sarkosyl (SK)- or formic acid (FA)-extracted tau showed similar interrelations. On the other hand, synaptophysin (r2 = +0.335), pS403/404 TDP-43 (r2 = +0.265) and septin-3 (r2 = +0.257) proteins positively correlated with cognitive scores. This study suggests that tau and Aβ42 in their insoluble aggregated forms, synaptic proteins and TDP-43 are the markers in the parietal cortex that are most strongly associated with cognitive function. This further substantiates the relevance of investigating these markers to understand the pathogenesis of AD and develop therapeutic tools.
Keywords: Alzheimer disease, Amyloid-β, Mild cognitive impairment, Parietal cortex, Postmortem, Synaptic proteins, Tau
INTRODUCTION
Alzheimer disease (AD) is characterized clinically by progressive cognitive impairment, and neuropathologically by the presence of intraneuronal neurofibrillary tangles and extracellular amyloid plaques (1–8). The effects of the 2 most robust risk factors for AD, older age and the E4 allele of apolipoprotein E (9,10), are mostly attributed to Aβ deposition and tangle pathology (11). However, individuals clinically diagnosed with mild cognitive impairment (MCI) and AD display heterogeneous neuropathological profiles (1,2,4–6,8,12). These observations suggest either that plaques and tangles only embody one of the many aspects of Aβ and tau neuropathologies or that other neuropathologies are involved in cognitive decline in AD. Studies have revealed that the pathogenic role of Aβ or tau depends on their quaternary states, post-translational modifications, oligomerization status and subcellular localization, which may be better revealed by biochemical separation steps and the use of subtype-specific antibodies (8,10,13,14). In addition to neurofibrillary tangles and neuritic plaques, other age-related markers such as transactive response DNA-binding protein 43 (TDP-43) inclusions (15–17) and loss of synaptic proteins (18–25) are associated with cognitive impairment and AD. The identification of markers that correlate with clinical manifestations will be instrumental for developing more efficient symptomatic treatments and ultimately, disease-modifying interventions. Nevertheless, in the scientific literature, the heterogeneity of methodologies and brain region used to determine which neuropathological marker of AD correlates with clinical manifestations result in conflicting results. Therefore, there is a strong need to clarify this issue and compare among all the postmortem markers studied to date, that is, which one correlates with antemortem cognitive deficit and the clinical diagnosis of AD using the same methodology.
In the present study, we compared correlations between neuropathological AD markers and antemortem cognitive performance in a single series of subjects from the Rush Religious Orders Study manifesting no cognitive deficits (NCI), MCI or AD (3,5,12). Biochemical measurements were performed on samples from the parietal cortex, an associative region implicated in the memory circuitry and affected early during the evolution of MCI to AD (26–28). Focus was placed on tau, Aβ, synaptic, cholinergic and other AD markers. Cytosolic and extracellular water-soluble proteins were differentiated from membrane detergent-soluble proteins, whereas detergent-insoluble proteins, including the Aβ peptide, were extracted using formic acid (FA) (8,29). Because concerns have been raised about the FA extraction procedures for the quantification of insoluble tau (30–35), we also performed a sarkosyl (SK)-based extraction in parallel in order to compare both protein extraction methods. In additional analysis, the MCI group was subdivided into 2 groups, that is, individuals displaying amyloid plaques were included in the MCI-amyloid pathophysiology (MCI-AP) group and those without amyloid plaques in the MCI nonamyloid pathology (MCI-NAP) group. We took advantage of the Rush Religious Order Study to avoid any predefined hypothesis and to compare all the markers selected in an objective fashion.
MATERIALS AND METHODS
Study Participants and Handling of Brain Tissue
Brain cortex samples were obtained from participants in the Religious Orders Study, a longitudinal clinical–pathologic study of aging and dementia from which an extensive amount of clinical and neuropathological data are available (5). The study subjects were classified as MCI (n = 12), AD (n = 12), or with no obvious cognitive impairment (NCI,n = 12), based on detailed clinical evaluation, as previously described (36,37). Each participant had undergone a uniform structured baseline clinical evaluation and an annual follow-up evaluation until death. Cognitive abilities were summarized as a global measure of cognition based on 19 performance tests, and as 5 domains of cognition: episodic memory, semantic memory, working memory, perceptual speed, and visuospatial ability (5,38). The tests that were performed to examine 5 domains of cognition are detailed inSupplementary Table 1. At death, each case was assigned a Braak score based on neuronal neurofibrillary tangle pathology, a neuritic plaque score based on modified CERAD criteria (excluding age and clinical diagnosis), and an AD pathologic diagnosis based on the National Institute on Aging (NIA)-Reagan criteria by examiners blinded to all clinical data (39).Table 1 summarizes clinical data of subjects grouped by the clinical assessment. Individuals with AD showed a significant cognitive deficit compared to NCI and MCI as assessed with mini-mental state examination (MMSE) and global cognition based on 19 cognitive performance tests (Table 1). Neuritic plaques, diffuse plaques, and neurofibrillary tangles in the parietal cortex were counted following Bielschowsky silver impregnation, as previously described (40). In additional analyses, we split the MCI group into 2 groups: one defined by the absence of amyloid plaques and named MCI-NAP and the second displaying amyloid plaques and named MCI-AP (Table 2).
TABLE 1.
Characteristics of Subjects From the Religious Order Study With a Clinical Diagnosis of No Cognitive Impairment, Mild Cognitive Impairment or Alzheimer Disease.
| Characteristics | NCI | MCI | AD | Statistical analysis |
|---|---|---|---|---|
| N | 12 | 12 | 12 | – |
| Men, % | 8.4 | 50 | 25 | C; Pearson test,r2 = 5.26; p = 0.07 |
| Mean age at death | 85.0 (6.0) | 84.5 (3.8) | 86.1 (5.8) | A;F(groups)2,33 = 0.29; p = 0.75 |
| Mean education, y (SD) | 17.5 (3.9) | 19.6 (2.4) | 18.0 (2.8) | A;F(groups)2,33 = 1.49; p = 0.24 |
| Mean MMSE (SD) | 27.4 (2.0) | 26.9 (2.2) | 16.2 (8.9)a | A;F(group)2,33 = 16.57; p < 0.0001 |
| Global cognition score (SD) | −0.12 (0.23) | −0.43 (0.46) | −1.75 (0.96)a | A;F(group)2,32 = 22.22; p < 0.0001 |
| ApoE ε4 allele carriage, % | 25 | 33 | 50 | C; Pearson test,r2 = 1.69; p = 0.43 |
| Cerebellar pH (SD) | 6.36 (0.31) | 6.46 (0.21) | 6.49 (0.37) | A;F(groups)2,33 = 0.62; p = 0.55 |
| Postmortem delay, hours (SD) | 7.4 (6.4) | 6.0 (4.1) | 6.3 (3.9) | A;F(groups)2,33 = 0.26; p = 0.77 |
| pS403/404 TDP-43 inclusion (SD) | 0.7 (0.67) | 1.0 (0.94) | 2.67 (1.22)a | A;F(groups)2,33 = 3.89; p < 0.001 |
| Hippocampal atrophy score (SD) | 2.08 (1.68) | 2.45 (1.51) | 2.67 (1.50) | A;F(groups)2,33 = 0.43; p = 0.66 |
| CERAD score 4/3/2/1 (n) | 3/3/5/1 | 6/0/4/2 | 0/1/3/8 | n/a |
| Braak score I/II/III/IV/V (n) | 2/0/6/4/0 | 0/0/5/6/1 | 0/0/5/1/6 | n/a |
| Reagan score 3/2/1 (n) | 7/5/0 | 6/5/1 | 1/5/6 | n/a |
Neuropathological data were generated on coronal sections or immunoblots from the temporal and/or parietal cortex; diagnoses were based on clinical evaluation; brain pH was measured in cerebellum extracts. AD, Alzheimer disease; NCI, no cognitive impairment; MCI, mild cognitive impairment; A, ANOVA; CERAD, Consortium to Establish a Registry for Alzheimer’s Disease; C, Contingency; MMSE, Mini Mental State Examination; SD, standard deviation; TDP-43, transactive response DNA binding protein 43; y, year;n, number. Values are expressed as mean (SD). Intergroup comparisons: a, p < 0.001 versus NCI and MCI.
TABLE 2.
Summary of Neuropathological Markers Investigated.
| Tau Markers | NCI | MCI-NAP | MCI-AP | AD | Statistical analysis | |
|---|---|---|---|---|---|---|
| Total tau (tau 13), ROD (SD) | TBS | 8289.00 (2525) | 9552.00 (2415) | 7721.00 (1595) | 7714.00 (2814) | A;F(groups)3,32 = 0.82; p = 0.49 |
| FA | 42.59 (25.74) | 64.01 (33.68) | 90.10 (64.49) | 107.70 (62.69)b | A;F(groups)3,32 = 3.81; p < 0.05 | |
| SK | 0.32 (0.34) | 0.12 (0.16) | 5.40 (11.35) | 9.84 (10.82) | A;F(groups)3,32 = 3.69; p < 0.05 | |
| Unphosphorylated tau (tau 1), ROD (SD) | TBS | 213.70 (39.52) | 279.50 (70.68) | 244.10 (63.55) | 214.20 (48.81) | A;F(groups)3,32 = 2.35; p = 0.09 |
| FA | 287.50 (115.2) | 305.50 (161.5) | 396.50 (288.7) | 232.70 (149.8) | A;F(groups)3,32 = 1.24; p = 0.31 | |
| SK | 22.91 (28.16) | 43.33 (31.93) | 38.42 (37.99) | 70.35 (73) | A;F(groups)3,32 = 1.85; p = 0.16 | |
| pT231/S235 tau (AT180), ROD (SD) | TBS | 0.30 (0.33) | 0.35 (0.36) | 0.58 (0.42) | 0.85 (1.04) | A;F(groups)3,32 = 1.53; p = 0.22 |
| FA | 27.76 (21.74) | 78.76 (92.95) | 67.27 (139.4) | 4633.00 (9549) | A;F(groups)3,32 = 1.70; p = 0.19 | |
| SK | 3.95 (3.78) | 2.14 (2.50) | 87.68 (209) | 177.60 (343.2) | A;F(groups)3,32 = 1.55; p = 0.22 | |
| pS396/404 tau (PHF1), ROD (SD) | TBS | 0.44 (0.41) | 0.60 (0.32) | 2.64 (3.03) | 3.95 (4.14)b | A;F(groups)3,32 = 2.68; p = 0.06 |
| FA | 0.63 (1.85) | 0.12 (0.12) | 10.14 (20.59) | 15.69 (21.65)b | A;F(groups)3,32 = 2.53; p = 0.07 | |
| SK | 0.52 (1.50) | 0.20 (0.19) | 4.45 (9.36) | 14.35 (21.43)c | A;F(groups)3,32 = 2.73; p = 0.06 | |
| Amyloid markers | NCI | MCI-NAP | MCI-AP | AD | Statistical analysis | |
| Aβ42 (SD) | TBS | 604.10 (785.8) | 53.30 (49.22) | 937.70 (449)d | 1026.00 (687.3)c | A;F(groups)3,32 = 2.93 p < 0.05 |
| FA | 742.50 (759.5) | 254.70 (569.3) | 1380.00 (905.1) | 1834.00 (1170)c,e | A;F(groups)3,32 = 5.00; p < 0.01 | |
| Plaque counts (SD) | 5.42 (7.29) | 0.00 (0.00) | 11.50 (6.22) | 19.75 (17.09)b,e | A;F(groups)3,32 = 5.35; p < 0.01 | |
| X11, ROD (SD) | 4.73 (3.22) | 2.11 (0.86) | 2.89 (1.94)d | 2.09 (1.19)c,e | A;F(groups)3,32 = 3.50; p < 0.05 | |
| Synaptic and other markers | NCI | MCI-NAP | MCI-AP | AD | Statistical analysis | |
| Synaptophysin, ROD (SD) | 85.14 (9.31) | 71.30 (9.17) | 72.82 (4.85) | 69.04 (9.61)c | A;F(groups)3,32 = 7.12; p < 0.001 | |
| Septin-3, ROD (SD) | 24.08 (4.61) | 23.00 (6.65) | 23.11 (3.19) | 19.60 (2.42) | A;F(groups)3,32 = 3.10; p < 0.05 | |
| SNAP25, ROD (SD) | 145.10 (22.81) | 122.50 (22.56) | 129.80 (23.86) | 125.10 (28.44) | A;F(groups)3,32 = 1.71; p = 0.18 | |
| Drebrin, ROD (SD) | 4.57 (3.99) | 3.56 (4.10) | 6.54 (5.83) | 2.41 (2.79) | A;F(groups)3,32 = 1.54; p = 0.22 | |
| Syntaxin 3, ROD (SD) | 115.00 (22.00) | 97.17 (21.59) | 93.56 (7.12)b | 110.40 (16.08) | A;F(groups)3,32 = 4.78; p < 0.01 | |
| PSD-95, ROD (SD) | 46.87 (17.90) | 40.80 (26.14) | 33.47 (19.16) | 26.09 (11.25)c | A;F(groups)3,32 = 2.89; p < 0.05 | |
| ChAT, ROD (SD) | 12.72 (4.91) | 16.97 (9.77) | 15.70 (7.33) | 9.65 (3.83) | A;F(groups)3,32 = 7.04; p < 0.001 | |
| VAChT, ROD (SD) | 14.97 (4.70) | 14.90 (3.40) | 13.40 (3.86) | 12.44 (4.03) | A;F(groups)3,32 = 0.90; p = 0.45 | |
| VILIP-1, ROD (SD) | 78.03 (18.31) | 68.96 (84.97) | 69.90 (13.14) | 65.55 (23.81) | A;F(groups)3,32 = 0.88; p = 0.46 | |
| GSTP1, ROD (SD) | 27.28 (4.94) | 27.65 (2.31) | 37.20 (4.40)b,e | 31.67 (4.65) | A;F(groups)3,32 = 7.77; p < 0.001 | |
| pS403/404 TDP-43, ROD (SD) | 385.54 (120.00) | 475.98 (230.56) | 375.61 (263.62) | 243.00 (112.15) | A;F(groups)3,32 = 2.95; p < 0.05 | |
| SIRT1, ROD (SD) | 6.97 (5.19) | 7.60 (6.70) | 5.15 (2.26) | 3.84 (1.81) | A;F(groups)3,32 = 1.44; p = 0.25 | |
| PAK1/2/3, ROD (SD) | 0.30 (0.11) | 0.27 (0.07) | 0.24 (0.09) | 0.18 (0.06)c | A;F(groups)3,32 = 3.39; p < 0.05 |
Neuropathological data were generated on coronal sections or immunoblots from the parietal cortex but the diagnosis was based on clinical evaluation. A, ANOVA; AD, Alzheimer disease; CERAD, Consortium to Establish a Registry for Alzheimer’s Disease; ChAT, choline acetyltransferase; C, Contingency; FA, formic acid; GSTP1, glutathione S-transferase P-1; MCI, mild cognitive impairment; MCI-AP, MCI group with amyloid pathology; MCI-NAP, MCI without amyloid pathology group; MMSE, Mini Mental State Examination; NCI, no cognitive impairment group; PAK, p21-activated kinase; PSD-95, postsynaptic density protein 95; ROD, relative optical density; SD, standard deviation; SIRT1, sirtuin 1; SK, sarkosyl; SNAP-25, synaptosomal-associated protein 25 kDa; TBS, tris-buffered saline; TDP-43, transactive response DNA binding protein 43; VAChT, vesicular acetylcholine transporter; VILIP-1, visinin-like protein-1. Values are expressed as mean (SD). Intergroup comparisons:
, p < 0.01 versus NCI;
, p < 0.05 versus NCI;
, p < 0.05 versus MCI-NAP;
, p < 0.01 versus MCI-NAP;
, p < 0.05 versus MCI-NAP.
Protein Fractionation
Postmortem samples (∼100 mg) from the parietal cortex (Brodmann’s area 7,Fig. 1A) from all study volunteers were homogenized (first in tris-buffered saline [TBS]), sonicated and centrifuged sequentially to generate (i) a TBS-soluble fraction (containing intracellular and extracellular soluble proteins), (ii) a lysis, detergent-soluble fraction (containing detergent-soluble membrane-bound proteins) and 2 detergent-insoluble fractions (containing insoluble proteins) either (iii) solubilized in FA or (iv) extracted using SK, based on published methodologies (8,30,31,41). The methods used for the generation of each fraction with protease and phosphatase inhibitors are summarized inFigure 1 (8). The TBS-soluble fraction is the supernatant obtained after the first centrifugation (Fig. 1B). The resulting water-insoluble pellet was resuspended in lysis buffer (150 mM NaCl, 10 mM NaH2PO4, 1% Triton X-100 and 0.5% deoxycholate) and briefly sonicated (3× for 5× 1-s pulse). Of this homogenate, 100 µl were set aside for SK extraction whereas the rest was centrifuged (100,000 × g for 20 minutes at 4 °C) to produce a supernatant, the detergent-soluble fraction (soluble in lysis buffer) containing membrane-bound proteins (Fig. 1C). The recovered detergent-insoluble pellet was homogenized in 100 μl of 99% FA (Fig. 1D), followed by a short sonication (10 × 1 s pulse) and centrifuged (10,000 × g for 20 minutes at 4 °C). The resulting supernatant was divided before being dried out and solubilized in either Laemmli’s buffer (for electrophoresis) or 5 M guanidine hydrochloride (for enzyme-linked immunosorbent assay [ELISA]) to generate the first insoluble fractions, those that are FA-soluble. The 100 μl collected after the second sonication (lysis) were centrifuged (20,000 × g for 20 minutes at 4 °C) and the supernatant was adjusted to 1% SK, rotated over 2 hours at 37 °C and centrifuged again (100,000 × g for 1 hour at 4 °C). The pellet was carefully washed with 1% SK and solubilized in Laemmli’s buffer to generate the SK-insoluble fraction. The extraction protocol described above is a combination of several previously published protocols (30,31,41) and adapted with our standard extraction procedure (8) to measure a full range of biochemical markers such as Aβ, tau, and synaptic proteins all in the same sample.
FIGURE 1.

Processing method for biochemical analyses.(A) Coronal section of a human brain parietal cortex at Brodmann area 7 indicated in red (adapted from BioImage Suite [139]).(B–E) Workflow to generate a tris-buffered saline (TBS)-soluble protein fraction containing cytosolic and extracellular proteins(B), a detergent-soluble fraction containing membrane-bound proteins(C), a formic acid-soluble fraction(D), and a sarkosyl-insoluble fraction(E), the last two consisting of detergent-insoluble proteins.
Western Immunoblotting and ELISA
For Western immunoblotting, protein concentrations were determined using bicinchoninic acid assays (Pierce/Thermo Fisher Scientific, Waltham, MA). Equal amounts of proteins per sample (15 μg of total proteins per lane) were added to Laemmli’s loading buffer, heated to 95 °C for 5 minutes and subjected to sodium dodecyl sulfate polyacrylamide gel electrophoresis. Proteins were electroblotted onto PVDF membranes (GE Healthcare, Mississauga, ON, Canada) before blocking in 5% nonfat dry milk and 0.5% bovine serum albumin in 10 mM phosphate-buffered saline for 1 hour. Membranes were immunoblotted with the appropriate primary and secondary antibodies and bands were visualized by chemiluminescence (Luminata Forte, Millipore, Etobicoke, ON, Canada). Image acquisition and analysis were performed with a KODAK Image Station 4000MM (Molecular Imaging Software version 5.3.4, Carestream, Woodbridge, CT) and relative optical density values were normalized to actin in TBS- and detergent-soluble fractions for synaptic proteins, cholinergic markers and other proteins possibly implicated in AD. The following antibodies were used in this study: anti-actin (ABM, Richmond, BC, Canada), anti-total tau (tau-13, Covance/Biolegend, San Diego, CA), anti-unphosphorylated tau at epitopes S196, S198, S199 and S202 (tau-1, Millipore), anti-phosphorylated tau at epitopes pS396/404 (PHF-1, gift from Dr. Peter Davies; Feinstein Institute for Medical Research, Manhasset, NY; AD2, Bio-Rad, Marnes-la-Coquette, France), and epitopes pT231/S235 (AT180, Pierce/Thermo Fisher Scientific), anti-phosphorylated TDP-43 at epitopes pS403/404 (Cosmo Bio, Carlsbad, CA), anti-synaptophysin (SVP-38) and anti-SIRT1 (Millipore), anti-septin-3 and anti-syntaxin 3 (Novus Biological, Oakville, ON, Canada), anti-PAK1/2/3 (Cell Signaling Technology, Danvers, MA), anti-VAchT (OSV00002G) and anti-GSTP1 (Pierce/Thermo Fisher Scientific), anti-X11 alpha (H-265, Santa Cruz Biotechnology, Dallas, TX), anti-SNAP25 (SMI 81, Covance/Biolegend), anti-VILIP-1 (Visinin-like 1, GeneTex, Irvine, CA), anti-ChAT (Proteintech, Rosemont, IL), anti-drebrin (M2F6, MBL, Woburn, MA), and anti-PSD-95 (K28/43, UC Davis/NIH NeuroMab Facility, Davis, CA).
Aβ42 concentrations were determined in TBS-soluble and detergent-insoluble (FA-soluble, resuspended in guanidine) fractions using highly sensitive ELISA tests (The Genetics Company, Schlieren, Switzerland), as described elsewhere (8). ELISAs were performed with standard curves according to the manufacturer recommendations and the plates were read at 450 nm using a SynergyTM HT multi-detection microplate reader (Biotek, Winooski, VT).
Neuritic plaques, diffuse plaques, and neurofibrillary tangles in the parietal cortex were counted following Bielschowsky silver impregnation, as previously described (40).
Data Analysis
Levels of each investigated AD marker were first compared between groups (NCI, MCI or AD, or NCI, MCI-NAP, MCI-AP or AD) (5). As is often the case with human samples, acquired data did not meet assumptions of normality of distribution and equal variances between groups. Therefore, we performed nonparametric Kruskal–Wallis ANOVA followed by Dunn’s multiple comparison tests. Correlations between the concentrations of each AD marker and antemortem global cognitive scores were then investigated using linear regression analysis. Global cognitive scores were analyzed as a sum or compartmentalized into the 5 domains of episodic memory, semantic memory, working memory, perceptual speed and visuospatial ability evaluation. MMSE records were also included. Associations were adjusted for the following covariates: age of death, educational level, gender andAPOE genotype. Log transformations of the data were used when needed to equalize variance and to provide more normally distributed measures. The level of significance was at p < 0.05 in all tests. All statistical analyses and additional adjustments were performed using JMP Statistical Analysis Software or Prism.
RESULTS
Comparison of Total and Phosphorylated Tau Levels in NCI, MCI and AD Subjects
To have an overview of total and phosphorylated (p) tau levels in subjects with AD compared to those with no or MCI (NCI or MCI), we assessed tau concentrations in TBS-soluble and in both detergent-insoluble fractions (FA and SK) from parietal cortex samples (representative immunoblots inSupplementary Fig. 1). Individuals classified as MCI could not be differentiated from other groups based on biochemical assessment of tau in either the soluble or insoluble fractions (Fig. 2), which is essentially in agreement with previous work (8,42–44). There were, however, differences between AD patients and NCI subjects. In TBS-soluble fractions, levels of total and phosphorylated tau were comparable between groups (Fig. 2A–C), except for phosphorylation at epitope S396/404 (PHF1 antibody), which was increased in the AD group (8-fold on average, p < 0.05) (Fig. 2D). Moreover, concentrations of pS396/404 tau were also strikingly increased in detergent-insoluble fractions from the same subjects, regardless of the extraction method used (FA: 21-fold on average, p < 0.05; and SK: 27-fold on average, p < 0.01) (Fig. 2H, L). The cortical accumulation of soluble and insoluble pS396/404 tau in AD patients remained significant when corrected for total tau levels (Supplementary Fig. 2C, F). These results obtained with the PHF1 antibody were all confirmed with clone AD2 that also targets the pS396/404 epitope of tau (Supplementary Fig. 3A–C). Furthermore, both total (tau-13; 2.5-fold on average, p < 0.01) and pT231/S235 (AT180; 167-fold on average, p < 0.05) tau were significantly increased in FA fractions of AD cortical samples (Fig. 2E, G). We observed the same tendency in SK fractions for total tau (14-fold on average, nonsignificant) and for pT231/S235 tau (29-fold on average, p < 0.05) (Fig. 2I, K). Finally, an increase in unphosphorylated S196/S198/S199/S202 tau (tau1) was measured only in SK-extracted AD samples (3-fold on average, p < 0.05) (Fig. 2J), although when corrected for total tau it was rather found to be decreased in AD in both FA and SK fractions (Supplementary Fig. 2D, G). Interestingly, even though detergent-insoluble total tau, pT231/S235 tau and pS396/404 tau extracted with either the FA- or SK-based extraction method were well correlated with global cognitive decline (Fig. 2M–P), group comparisons were statistically more robust with the FA extraction method. This is in accordance with our observation that FA extraction generates a larger amount of total proteins compared to SK extraction, facilitating the detection of variation between groups. Indeed, when an equal amount of sample underwent either of the 2 extraction methods and an equal amount was submitted to electrophoresis, the Coomassie blue staining was darker for FA soluble extracts (Supplementary Fig. 4A–C). Despite the fact that the lower protein content in SK-insoluble extracts resulted in sharper band migration during electrophoresis, it also required pixel binning during chemiluminescence exposure after Western blotting (Supplementary Fig. 4B; Fig. 1C). When the MCI-NAP and MCI-AP groups were extracted from the original MCI group, we observed similar results concerning the significant increase of total tau (tau13 antibody) and S396/404 (PHF1 antibody) levels (Table 2). Globally, no significant difference in tau concentrations was observed when comparing MCI groups with and without amyloid pathology in MCI.
FIGURE 2.

Differential expression and phosphorylation of tau in water-soluble and detergent-insoluble fractions of the parietal cortex and comparison between extraction methods.(A–L) Tau protein levels (Western blot) in tris-buffered saline-soluble fractions (TBS)(A–D), formic acid-soluble fractions (FA)(E–H), and sarkosyl-insoluble fractions (SK)(I–L), from parietal cortices of healthy control subjects (NCI) and study participants with either MCI or AD. Individual values are shown and bars represent the means. Antibodies used for immunodetection are indicated. Levels of pT231/S235 tau are on a log scale. Statistical comparisons were performed using a nonparametric Kruskal–Wallis test followed by Dunn’s multiple comparison tests.(M–P) Linear regression analyses assessing the difference in tau levels (Western blot) between FA and SK fractions for each tau species.
Relation of Tau With Cognitive Performance
Next, we studied the correlation of soluble tau, insoluble tau and neurofibrillary tangle counts with antemortem MMSE, global cognitive scores, as well as with the 5 cognitive domains (episodic, semantic and working memories, perceptual speed and visuospatial ability) separately in each subject. We observed a negative correlation in all cortical fractions (soluble p < 0.05; insoluble p < 0.001) between global cognitive score and both pT231/S235 and pS396/404 phosphorylated tau (Table 3;Supplementary Fig. 5C, D, G, H, K, L). A negative correlation with total tau (p < 0.005) was also found but only in detergent-insoluble fractions (Table 3;Supplementary Fig. 5E, I). Interestingly, when analyzing each cognitive domain as well as MMSE separately, we observed that each one correlated negatively with pT231/S235 phosphorylated tau (Table 3). We then conducted an additional analysis using total tau as a covariate to determine whether correlations with phosphorylated tau were driven by total tau. Albeit this adjustment reduced the significance of many associations between separate cognitive scores and phosphorylated tau (including pT231/S235), they remained robust in the soluble fraction with episodic, semantic and working memories as well as between perceptual speed and insoluble pT231/S235 phosphorylated tau (Supplementary Table 2). The correlation between phosphorylated pS396/404 tau and separate cognitive scores was also strong, with negative associations found with episodic memory in all fractions (p < 0.05) and with semantic memory, working memory and MMSE in insoluble fractions (p < 0.01) (Table 3). Adding total tau as a covariate strengthened correlations between soluble pS396/404 tau and cognitive scores, not only extending them to semantic memory, working memory and MMSE, but also weakened associations with insoluble fractions (Supplementary Table 2). Finally, levels of unphosphorylated S196/S198/S199/S202 tau in any fractions generally did not correlate with cognitive performance (Table 3). Taken together, both pT231/S235 and pS396/404 tau are good AD markers for global cognitive performance, which is not the case for unphosphorylated S196/S198/S199/S202 tau. Additionally, correlations between cognitive scores and pT231/S235, pS396/404 tau or total tau were stronger in the insoluble versus soluble fractions. Lastly, tangle counts were robustly correlated (p < 0.01) with global cognitive score and with every cognitive domain and MMSE score (Table 3).
TABLE 3.
Linear Regression Between Immunohistological Tau Alterations and Insoluble and Soluble Tau With Antemortem Cognitive Evaluation.
| Neuropathological markers | Global cognitive score |
Episodic memory |
Semantic memory |
Working memory |
Perceptual speed |
Visuospatial ability |
MMSE |
||||||||
|---|---|---|---|---|---|---|---|---|---|---|---|---|---|---|---|
| r 2 | p | r 2 | p | r 2 | p | r 2 | p | r 2 | p | r 2 | p | r 2 | p | ||
| Tangle counts | −0.494 | <0.0001 | −0.447 | 0.0002 | −0.446 | 0.0005 | −0.357 | 0.0067 | −0.426 | 0.0015 | −0.422 | 0.0095 | −0.480 | <0.0001 | |
| Total tau (tau-13) | FA | −0.385 | 0.0019* | −0.414 | 0.0006* | −0.354 | 0.0059 | 0.244 | ns | 0.261 | ns | 0.338 | ns | −0.325 | 0.0036* |
| SK | −0.365 | 0.0031* | −0.440 | 0.0003* | 0.240 | ns | −0.276 | 0.0464 | 0.232 | ns | 0.313 | ns | −0.255 | 0.0181* | |
| TBS | 0.141 | ns | 0.115 | ns | 0.161 | ns | 0.171 | ns | 0.249 | ns | 0.329 | ns | 0.106 | ns | |
| pS396/404 tau (PHF1) | FA | −0.394 | 0.0014* | −0.420 | 0.0005* | −0.349 | 0.0067* | −0.327 | 0.0138* | 0.244 | ns | 0.310 | ns | −0.344 | 0.0022* |
| SK | −0.485 | 0.0001* | −0.506 | <0.0001* | −0.355 | 0.0058* | −0.342 | 0.0096* | −0.368 | 0.0067 | −0.391 | 0.0213 | −0.439 | 0.0002* | |
| TBS | −0.314 | 0.0427 | −0.339 | 0.0275 | 0.261 | ns | 0.265 | ns | 0.148 | ns | 0.186 | ns | 0.269 | ns | |
| pT231/S235 tau (AT180) | FA | −0.463 | 0.0003* | −0.379 | 0.002* | −0.486 | 0.0002* | −0.348 | 0.0060* | −0.415 | 0.0040* | −0.446 | 0.0072* | −0.443 | 0.0003* |
| SK | −0.422 | 0.0007* | −0.415 | 0.0006* | −0.318 | 0.0141* | −0.319 | 0.0166* | −0.356 | 0.0092* | −0.379 | 0.0303* | −0.354 | 0.0018* | |
| TBS | −0.281 | 0.0219 | −0.229 | 0.0469 | −0.281 | 0.0338 | −0.280 | 0.0421 | 0.223 | ns | −0.377 | 0.0316 | 0.186 | ns | |
| S196/S198/S199/S202 Up-tau (tau1) | FA | 0.200 | ns | 0.191 | ns | 0.208 | ns | 0.272 | ns | 0.183 | ns | 0.274 | ns | 0.161 | ns |
| SK | −0.276 | 0.0250 | −0.344 | 0.0044 | 0.180 | ns | 0.019 | ns | 0.248 | ns | 0.344 | ns | −0.222 | 0.0386 | |
| TBS | 0.146 | ns | 0.190 | ns | 0.157 | ns | 0.165 | ns | 0.167 | ns | 0.287 | ns | 0.127 | ns | |
Linear regressions are adjusted by age of death, educational level, gender and APOE genotype. FA, formic acid; MMSE, Mini-Mental State Examination; SK, sarkosyl; TBS, tris-buffered saline; Up-tau, unphosphorylated tau.
Comparable correlations for FA and SK extracted samples.
Assessment of Aβ Concentrations in the Parietal Cortex and Relation to Cognitive Scores
In parallel, we assessed Aβ concentrations by ELISA in TBS-soluble and in detergent-insoluble (FA) fractions from parietal cortex samples. Insoluble parietal cortex concentrations of Aβ42 were higher (p < 0.05) in AD subjects compared to both NCI (+147%) and MCI (+124%), whereas soluble levels of Aβ42 were similar between groups (Fig. 3A vs C), as previously shown (8,43). When we included MCI-NAP and MCI-AP subgroups in our analysis, higher concentrations of soluble Aβ42 (p < 0.05) in both AD and MCI-AP subjects compared to MCI-NAP (19-fold and 17.6-fold higher in average, respectively) were observed (Table 2). For insoluble Aβ42, concentrations were higher in the AD group compared to the MCI-NAP subgroup (7.2-fold higher in average) (Table 2).
FIGURE 3.

Comparison of Aβ42 peptide levels, plaque counts and X11 protein concentrations in the parietal cortex and correlation to global cognitive scores.(A–D) Quantitative measurement (ELISA) in the parietal cortices of healthy control subjects (NCI) and study participants with either MCI or AD and linear regression with global cognitive score of soluble Aβ42(A, B) and insoluble Aβ42(C, D).(E, F) Amyloid plaque counts and linear regression with global cognitive score.(G, H) Soluble X11 protein levels (Western blot) and linear regression with global cognitive score in the parietal cortices of healthy control subjects (NCI) and study participants with either MCI or AD. Individual values are shown and the bar represents the mean. Statistical comparisons were performed using nonparametric Kruskal–Wallis test followed by Dunn’s multiple comparison tests.
Fittingly, insoluble, but not soluble, cortical Aβ42 showed a significant inverse relationship (r2 = −0.389, p = 0.0017) with global cognitive score (Fig. 3B, D), MMSE as well as with episodic, semantic and working memories (Table 4). On the other hand, soluble cerebral Aβ42 concentrations were correlated only with episodic memory. In line with these results, we noticed that amounts of amyloid plaques were also significantly higher (p < 0.05) in individuals with AD compared to NCI and MCI (3.4-fold and 3.6-fold higher in average, respectively), as also observed in the analysis including both MCI-NAP and MCI-AP subgroups (Fig. 3;Table 2) and that they strongly correlated (r2 = −0.426, p = 0.0006) with antemortem global cognitive scores (Fig. 3F), the 5 cognitive domains subscores and MMSE score (Table 4). Because it was shown to suppress the generation of Aβ through association with amyloid precursor protein (APP) (45), we also analyzed cortical levels of neuronal adaptor protein X11. We observed decreased concentrations of soluble X11 in the AD group (−45%, p < 0.05) compared to NCI individuals (Fig. 3G;Supplementary Fig. 6A). While X11 was not correlated with Aβ concentrations and with global cognitive score, a significant association (r2 = +0.312, p = 0.0267) between cortical X11 concentrations and perceptual speed was detected (Table 4).
TABLE 4.
Linear Regression Between Immunohistological β-Amyloid Alterations, Insoluble and Soluble β-Amyloid and X11 With Antemortem Cognitive Evaluation.
| Neuropathological markers | Global cognitive score |
Episodic memory |
Semantic memory |
Working memory |
Perceptual speed |
Visuospatial ability |
MMSE |
||||||||
|---|---|---|---|---|---|---|---|---|---|---|---|---|---|---|---|
| r 2 | p | r 2 | p | r 2 | p | r 2 | p | r 2 | p | r 2 | p | r 2 | p | ||
| Plaque counts | −0.426 | 0.0006 | −0.423 | 0.0005 | −0.405 | 0.0035 | −0.302 | 0.0251 | −0.292 | 0.0428 | −0.370 | 0.0383 | −0.402 | 0.0005 | |
| Aβ42 | FA | −0.389 | 0.0017 | −0.441 | 0.0003 | −0.295 | 0.0241 | −0.279 | 0.0431 | −0.267 | ns | −0.354 | ns | −0.373 | 0.0011 |
| TBS | −0.209 | ns | −0.261 | 0.0232 | −0.212 | ns | −0.175 | ns | −0.196 | ns | −0.270 | ns | −0.144 | ns | |
| X11 | TBS | 0.241 | ns | 0.214 | ns | 0.221 | ns | 0.243 | ns | 0.312 | 0.0267 | 0.310 | ns | 0.149 | ns |
Linear regressions were adjusted by age of death, educational level, gender and APOE genotype. Abbreviations: FA, formic acid; TBS, tris-buffered saline. Aβ42, β-amyloid.
Assessment of Synaptic Marker Levels in the Parietal Cortex and Correlation With Cognitive Function
The decrease of any synaptic protein in AD is the rule rather than the exception (21,23–25,46–48), and several reports have linked the loss of synaptic proteins with a decrease in cognitive performance (18–20,22,46,47,49–54). To document this association further, we measured 6 different synaptic proteins reported to be implicated in the pathophysiology of AD: synaptophysin, septin-3, synaptosomal-associated protein 25 kDa (SNAP25), drebrin, syntaxin 3 and postsynaptic density protein 95 (PSD-95) in detergent-soluble fractions from parietal cortices. Only reductions in synaptophysin, septin-3 and PSD-95 distinguished AD cases from NCI (−19%, −18.5% and −44%, respectively), with synaptophysin and syntaxin 3 being already diminished in MCI compared to NCI subjects (−44%, and −17%, respectively, p < 0.05) (Fig. 4A, I;Supplementary Fig. 6B–G). In the analysis with the MCI-NAP and MCI-AP subgroups, only synaptophysin and PSD-95 distinguished AD cases from NCI while the MCI-AP group displayed significantly lower levels of syntaxin-3 compared to NCI (−19%) (Table 2), likely reflecting a loss of statistical power. In addition, cerebral concentrations of synaptophysin were positively correlated with performance in all 5 cognitive domains (p < 0.05), while septin-3 was positively correlated with the global cognitive score, episodic memory, working memory and MMSE (p < 0.05) (Fig. 4B, D;Table 5). Among the remaining synaptic proteins, we observed a significant decrease in syntaxin 3 in MCI compared to control groups and a positive correlation between SNAP25 and semantic memory (p < 0.01) (Fig. 4E–J;Table 5).
FIGURE 4.
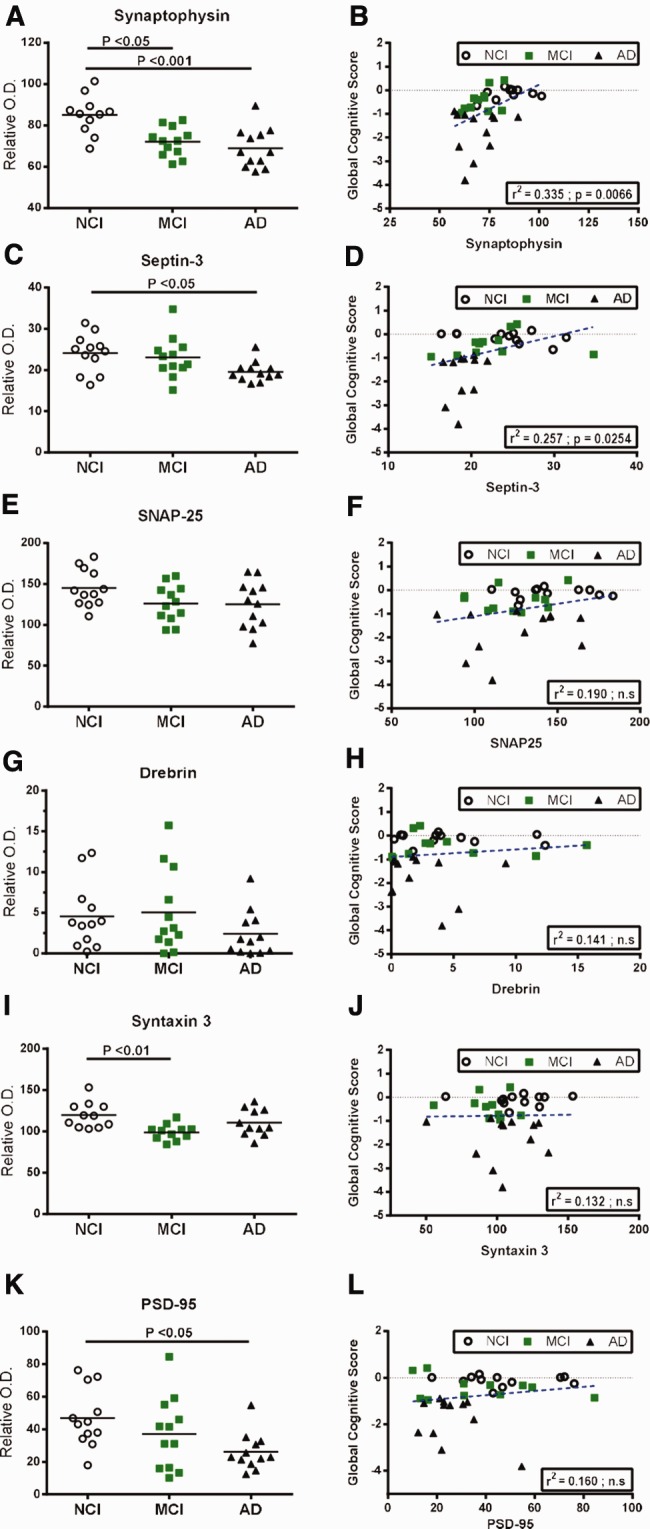
Alterations of synaptic markers in the parietal cortex of MCI or AD subjects and correlations with global cognitive score.(A–L) Synaptophysin(A, B), septin-3(C, D), SNAP25(E, F), drebrin(G, H), syntaxin 3(I, J), PSD-95(K, L) protein levels (Western blot) from detergent-soluble fractions and linear regression analysis with global cognitive score in the parietal cortices of healthy control subjects (NCI) and study participants with either MCI or AD. Individual values are shown and the bar represents the mean. Statistical comparisons were performed using a nonparametric Kruskal–Wallis test followed by Dunn’s multiple comparison tests.
TABLE 5.
Linear Regression Between Immunohistological TDP43 Alterations and Other Known Markers With Antemortem Cognitive Evaluation.
| Neuropathological markers | Global cognitive score |
Episodic memory |
Semantic memory |
Working memory |
Perceptual speed |
Visuospatial ability |
MMSE |
||||||||
|---|---|---|---|---|---|---|---|---|---|---|---|---|---|---|---|
| r 2 | p | r 2 | p | r 2 | p | r 2 | p | r 2 | p | r 2 | p | r 2 | p | ||
| Synaptic markers | Synaptophysin | 0.335 | 0.0066 | 0.259 | 0.023 | 0.307 | 0.0202 | 0.315 | 0.0344 | 0.327 | 0.0213 | 0.395 | 0.0250 | 0.205 | ns |
| Septin-3 | 0.257 | 0.0254 | 0.190 | 0.0431 | 0.286 | ns | 0.305 | 0.0255 | 0.242 | ns | 0.302 | ns | 0.193 | 0.0475 | |
| SNAP25 | 0.190 | ns | 0.124 | ns | 0.283 | 0.0325 | 0.210 | ns | 0.248 | ns | 0.357 | ns | 0.133 | ns | |
| Drebrin | 0.141 | ns | 0.118 | ns | 0.158 | ns | 0.179 | ns | 0.197 | ns | 0.271 | ns | 0.105 | ns | |
| Syntaxin 3 | 0.132 | ns | 0.110 | ns | 0.200 | ns | 0.186 | ns | 0.165 | ns | 0.321 | ns | 0.075 | ns | |
| PSD-95 | 0.160 | ns | 0.155 | ns | 0.162 | ns | 0.171 | ns | 0.242 | ns | 0.268 | ns | 0.128 | ns | |
| Cholinergic markers | ChAT | 0.155 | ns | 0.151 | ns | 0.152 | ns | 0.134 | ns | 0.207 | ns | 0.275 | ns | 0.119 | ns |
| VAChT | 0.137 | ns | 0.132 | ns | 0.179 | ns | 0.168 | ns | 0.193 | ns | 0.276 | ns | 0.100 | ns | |
| Other markers | VILIP-1 | 0.190 | ns | 0.128 | ns | 0.213 | ns | 0.312 | 0.0218 | 0.194 | ns | 0.343 | ns | 0.118 | ns |
| GSTP1 | −0.254 | 0.0407 | −0.241 | 0.0364 | −0.247 | ns | −0.231 | ns | −0.238 | ns | −0.278 | ns | −0.175 | ns | |
| Cytoplasmic pS403/404 TDP-43 inclusions | −0.476 | 0.0015 | −0.43 | 0.0055 | −0.324 | 0.0276 | −0.363 | 0.0173 | −0.544 | 0.0005 | −0.630 | 0.0004 | −0.513 | 0.0004 | |
| pS403/404 TDP-43 | 0.265 | 0.0316 | 0.296 | 0.0105 | 0.188 | ns | 0.244 | ns | 0.203 | ns | 0.308 | ns | 0.150 | ns | |
| SIRT1 | 0.179 | ns | 0.152 | ns | 0.219 | ns | 0.180 | ns | 0.253 | ns | 0.279 | ns | 0.085 | ns | |
| PAK1/2/3 | 0.239 | ns | 0.219 | ns | 0.209 | ns | 0.219 | ns | 0.287 | 0.0463 | 0.365 | 0.0348 | 0.159 | ns | |
Linear regressions are adjusted by age of death, educational level, gender and APOE genotype. TDP-43 data used for this linear regression analysis were previously published [104]. ChAT, choline acetyltransferase; VAChT, vesicular acetylcholine transporter; VILIP-1, visinin-like protein-1; GSTP1, glutathione S-transferase P-1; TDP-43, transactive response DNA binding protein 43; SIRT1, sirtuin 1; PAK, p21-activated kinase; SNAP-25, synaptosomal-associated protein 25 kDa; PSD-95, postsynaptic density protein 95.
Comparison of Cholinergic Marker Levels and Correlation With Cognitive Decline
We next analyzed the cholinergic markers choline acetyltransferase (ChAT) and vesicular acetylcholine transporter (VAChT) in detergent-soluble fractions. Although depletion of the cholinergic system in AD was reported more than 30 years ago (55), only a few studies have investigated these markers in MCI subjects or their relationship with cognitive decline. Our data show that, whereas a significant decrease in ChAT was observed in AD patients compared to MCI (−44%, p < 0.01), no significant modifications of VAChT protein levels were observed between groups in parietal cortices (Fig. 5A, C;Supplementary Fig. 6H, I). No significant variations of ChAT and VAChT were observed when introducing the MCI-NAP subgroup (Table 2). Interestingly though, NIA-Reagan criteria were associated with both reduced ChAT (−48%, p < 0.05 between Reagan score 3 and 1), and VAChT (−37%, p < 0.01 between Reagan score 3 and 1) protein levels (Fig. 5B, D), indicating that cerebral ChAT and VAChT might be associated more directly with Aβ and tau burden than with cognitive decline. This hypothesis is further supported by the observation that cortical levels of both ChAT and VAChT were not correlated with any cognitive performance score (Table 5), while an inverse relationship was found with plaque counts and insoluble pS396/404 phosphorylated tau (Table 6).
FIGURE 5.

Protein levels of cholinergic markers based on cognitive scores (NCI, MCI or AD), or Reagan score (3,2,1) and correlations with pathological markers.(A, B) ChAT protein levels (Western blot) in detergent-soluble fractions from parietal cortices of study volunteers either divided according to cognitive impairment (NCI, MCI or AD)(A) or Reagan score(B).(C, D) VAChT protein levels (Western blot) in the parietal cortices of study volunteers either divided according to cognitive impairment (NCI, MCI or AD)(C), or Reagan score(D). Individual values are shown and the bars represent the mean. Statistical comparisons were performed using a nonparametric Kruskal–Wallis test followed by Dunn’s multiple comparison tests.
TABLE 6.
Linear Regression Analysis Between Synaptic Markers, TDP-43 and Markers of Amyloid and Tau Pathologies in the Parietal Cortex.
| Neuropathological Markers | Plaque count |
Insoluble Aβ42 |
Tangle count |
Insoluble total tau (tau13) |
Insoluble pS396/404 tau (PHF1) |
Insoluble pT231/S235 tau (AT180) |
|||||||
|---|---|---|---|---|---|---|---|---|---|---|---|---|---|
| r² | p | r² | p | p | p | r² | p | r² | p | r² | p | ||
| Synaptic markers | Synaptophysin | 0.132 | ns | 0.083 | ns | 0.085 | ns | 0.310 | ns | 0.159 | ns | 0.134 | ns |
| Septin-3 | 0.170 | ns | 0.060 | ns | 0.138 | ns | 0.282 | ns | 0.194 | ns | 0.209 | ns | |
| SNAP25 | 0130 | ns | 0.104 | ns | 0.089 | ns | 0.261 | ns | 0.130 | ns | 0.156 | ns | |
| drebrin | 0.132 | ns | 0.089 | ns | 0.073 | ns | 0.260 | ns | 0.167 | ns | 0.107 | ns | |
| Syntaxin 3 | 0.123 | ns | 0.135 | ns | 0.077 | ns | 0.347 | ns | 0.171 | ns | 0.109 | ns | |
| PSD-95 | 0.190 | ns | 0.089 | ns | 0.115 | ns | 0.296 | ns | 0.236 | ns | 0.148 | ns | |
| Cholinergic markers | ChAT | -0.281 | 0.0276 | 0.186 | ns | 0.097 | ns | 0.279 | ns | -0.303 | 0.0123 | 0.127 | ns |
| VAChT | 0.184 | ns | 0.088 | ns | 0.127 | ns | 0.285 | ns | -0.271 | 0.0224 | 0.133 | ns | |
| Others markers | VILIP-1 | 0.148 | ns | 0.114 | ns | 0.087 | ns | 0.258 | ns | 0.147 | ns | 0.105 | ns |
| GSTP1 | 0.249 | 0.0343 | 0.181 | ns | 0.095 | ns | 0.342 | 0.0520 | 0.191 | ns | 0.124 | ns | |
| Cytoplasmic pS403/404 TDP-43 inclusions | 0.463 | 0.0138 | 0.198 | ns | 0.369 | 0.0168 | 0.219 | ns | 0.160 | ns | 0.358 | 0.0155 | |
| pS403/404 TDP-43 | 0.225 | ns | 0.191 | ns | 0.076 | ns | 0.304 | ns | 0.253 | 0.0339 | 0.107 | ns | |
| SIRT1 | 0.204 | ns | 0.148 | ns | 0.195 | ns | 0.258 | ns | 0.170 | ns | 0.147 | ns | |
| PAK1/2/3 | 0.216 | ns | 0.174 | ns | -0.293 | 0.0068 | -0.392 | 0.0560 | -0.258 | 0.0576 | -0.374 | 0.0023 | |
Linear regressions are adjusted by age of death, educational level, gender and APOE genotype. TDP-43 data’s used for these linear regression analysis were previously published [104]. Abbreviations: ChAT, choline acetyltransferase; VAChT, vesicular acetylcholine transporter; VILIP-1, visinin-like protein-1; GSTP1, glutathione S-transferase P-1; TDP-43, transactive response DNA binding protein 43; SIRT1, sirtuin 1; PAK, p21-activated kinase; SNAP-25, synaptosomal-associated protein 25kDa; PSD-95, postsynaptic density protein 95.
Other Proteins Possibly Implicated in Alzheimer disease
We next extended our analysis in TBS-soluble fractions to other proteins previously associated to AD including visinin-like protein-1 (VILIP-1), glutathione S-transferase P-1 (GSTP1), transactive response DNA binding protein 43 (TDP-43), sirtuin-1 (SIRT1) and members of the P21 activated kinase (PAK) family in their respective cortical fractions. VILIP-1 is a neuronal calcium-sensor protein, which was recently suggested to be associated with AD progression (56). In the present study, we observed no alterations in VILIP-1 levels between groups (Fig. 6A, B;Supplementary Fig. 6J). Although a positive association with working memory was observed (r2 = +0.312, p = 0.0218), no correlation was found with any of the other cognitive subdomains or MMSE (Table 5). Genetic variations in theGSTP1 gene have been associated with increased risk for the development of AD (57,58). Accordingly, while we did not observe a significant variation in expression between AD, MCI and control groups (Fig. 6C, D;Supplementary Fig. 6K), we noted a negative correlation between GSTP1 and global cognitive scores, particularly with the episodic cognitive domain (r2 = −0.254, p = 0.0407, andr2 = −0.241, p = 0.0364, respectively) (Table 5), and a positive correlation with plaque counts (r2 = 0.249, p = 0.0343) (Table 6). However, when we consider the MCI-NAP subgroup, we observed a significant increase of GSTP1 protein levels in MCI-AP compared to both NCI and MCI-NAP (+36% and +34%, respectively) (Table 2). Previously, we reported an increase of insoluble cytoplasmic inclusions of pS403/404 phosphorylated TDP-43 in AD patients, correlating with the clinical and neuropathologic features of AD in the same Religious Orders Study cohort as the one used in the present study (17). Here, strong inverse correlations (r2 = −0.324 to −0.630, p = 0.0276–0.0004) were found between cortical insoluble pS403/404 TDP-43 and global cognitive score, as well as all 5 cognition domains and MMSE (Table 5). In addition, the evaluation of cytoplasmic pS403/404 TDP-43 inclusions was positively correlated with plaque and tangle counts and with the levels of insoluble pT231/S235 tau (AT180) (Table 6). Conversely, TBS-soluble pS403/404 TDP-43 was instead positively associated with global cognitive score, episodic memory (Table 5) and insoluble pS396/404 tau (PHF1) (Table 6). Decreased cerebral levels of SIRT1 were shown to be associated with CERAD, Braak and NIA-Reagan criteria (59). We thus assessed SIRT1 concentrations in our parietal cortex samples; however, we did not observe any correlation with global cognitive score in the present analysis (Table 5). Lastly, we previously reported that PAK1/2/3 was downregulated in AD compared to NCI subjects, correlating with cognitive impairment (60). In the present study, we observed that PAK1/2/3 correlated with perceptual speed, visuospatial ability (Table 5) and inversely correlated with tangle counts and levels of insoluble pT231/S235 tau (AT180) (Table 6).
FIGURE 6.

Comparison of protein levels of VILIP-1 and GSTP1 in the parietal cortex and correlation to global cognitive score.(A–D) VILIP-1(A, B) and GSTP1(C, D) protein levels (Western blot) in TBS-soluble fractions and linear regression analysis with global cognitive score in the parietal cortices of healthy control subjects (NCI) and study participants with either MCI or AD. Individual values are shown and the bar represents the mean. Statistical comparisons were performed using a nonparametric Kruskal–Wallis test followed by Dunn’s multiple comparison tests.
Comparing Markers: Which Ones Correlate Best With Cognitive Performance?
Overall, the strongest negative correlation coefficients with global cognitive scores were obtained for neurofibrillary tangle counts (r2 = −0.494, p < 0.0001), insoluble phosphorylated tau (AT180:r2 = −0.463, p = 0.0003 and PHF-1:r2 = −0.394, p = 0.0014) (Table 3), TDP-43-positive cytoplasmic inclusions (r2 = −0.476, p = 0.0015) (Table 5), Aβ plaque counts (r2 = −0.426, p = 0.0006), insoluble Aβ42 (r2 = −0.389, p = 0.0017) (Table 4) and total insoluble tau (r2 = −0.385, p = 0.0019) (Table 3). Other inverse associations with global cognitive scores were observed for soluble phosphorylated tau (PHF-1:r2 = −0.314, p = 0.0427; AT180:r2 = −0.281, p = 0.0219) (Table 3) and GSTP1 (r2 = −0.254, p = 0.0407) (Table 5). Finally, synaptophysin (r2 = +0.335, p = 0.0066) and septin-3 (r2 = +0.257, p = 0.0254) were the 2 synaptic proteins positively associated with cognitive scores (Table 5).
DISCUSSION
After decades of research on AD, clinicopathological studies not only have established the importance of neuritic plaques, synaptic markers and neurofibrillary tau pathology in AD, but have also revealed imperfections in their correlation with the clinical expression of the disease (61). In the present work, we provide a comparison between the concentrations of biochemically assessed key AD markers in the parietal cortex in relation with antemortem cognitive symptoms, focusing on the same series of subjects.
Our main finding is that phosphorylated tau and Aβ42, found in detergent-insoluble fractions, stand as the strongest postmortem correlates of cognitive impairment, at least in the parietal cortex. More specifically, insoluble pS396/404 and pT231/S235 tau were strongly correlated with cognitive decline followed by insoluble Aβ42 (r2 = −0.485,r2 = −0.463 andr2 = −0.389, respectively). Also immunohistochemical assessment demonstrated that neurofibrillary tangles, pS403/404 TDP-43 inclusions and amyloid plaques were strongly correlated with cognitive decline (r2 = −0.494,r2 = −0.476 andr2 = −0.426, respectively). Lastly, while tau and Aβ42 remain the strongest inverse markers for global cognitive decline, synaptophysin, followed by soluble pS403/404 TDP-43 and septin-3, were identified as the best positive correlates (r2 = +0.335,r2 = +0.265 andr2 = +0.257, respectively).
We analyzed a brain region impacted early in AD, the parietal cortex. One advantage of the Religious Orders Study is the assessment of multiple cognitive abilities in the same series of volunteers. Some of these cognitive abilities are associated with the parietal cortex, particularly episodic memory, visuospatial abilities, and some task tests requiring attention (Supplementary Table 1). The parietal cortex is implicated in multiple cognitive circuitry (27): it is fundamental in controlling spatial aspects of motor behavior (62,63), voluntary attention (64,65), mental imagery tasks (66) and episodic memory, the latter being particularly impaired in AD (28,67–69).
Tau Pathology
The present study provides further arguments for a strong relationship between tau and cognitive manifestations of AD. More particularly, the strongestr2 andp values were obtained with tangle counts, as well as pS396/404 and pT231/S235 tau concentrations in insoluble fractions from the parietal cortex. Insoluble total tau also correlated with cognitive scores independently of its phosphorylation index. In contrast, total soluble tau and unphosphorylated S196/S198/S199/S202 tau levels in AD brain were comparable to NCI controls, an observation consistent with our previous data (8). The results of our study thus support the notion that the pathogenic role of tau is based on its insolubility and phosphorylation state (8,70–72). This hypothesis is in agreement with previous postmortem studies assessing the correlation between tau neuropathology and clinical expression of the disease. Indeed, despite different methodological designs, statistics or sample size, most studies based on immunohistochemistry report an increase in neurofibrillary tangles correlating with dementia severity scores (3–6,8,44,73–76).
In the present study, we performed biochemical assessment of detergent-insoluble tau using 2 protein extraction processes, one with FA and the other with SK, the latter having been suggested to better preserve antigenic epitopes for tau immune detection (30,77,78). In our hands, these 2 extraction methods led to very similar correlations between tau and cognitive performance scores. Thus, both methods are suitable for analysis of tau insoluble forms, as initially suggested (30,31,41), although the FA method had 2 major advantages: it generates a higher amount of proteins available for subsequent analysis and it allows the analysis of insoluble Aβ in the same sample. Besides comparing extraction techniques, we also compared antibodies PHF1 and AD2, both of which target tau pS396/404. We observed comparable results among group comparisons, correlations to cognitive decline (at least in the soluble fraction), and very strong correlations between the signals obtained with both antibodies (Supplementary Fig. 3G–I) indicating that both antibodies are interchangeable when assessing tau pathology.
In summary, our data support the idea that tau is the most informative postmortem marker of AD in relation to cognitive decline. However, our results also point out that methodological approaches allowing finer discrimination of specific subtypes, classified over solubility and phosphorylated epitopes for example, is probably essential to pinpoint pathogenic forms of tau most closely associated with AD pathogenesis.
Aβ Pathology
Aβ deposition in the brain is one of the most studied pathological features of AD. However, in the light of the failure of recent clinical trials with Aβ-modifying compounds (79,80), unraveling the link between Aβ and cognitive decline has become even more pressing. In the present cohort of individuals, concentrations of insoluble Aβ42 and Aβ plaque counts in postmortem tissue were comparable between controls and MCI, but significantly higher in AD subjects, in agreement with previous reports (3,5,8). This is in line with the lower cortical concentrations of X11 we observed in the same patients. Indeed, X11 is a well-characterized neuronal adaptor protein that regulates the trafficking and metabolism of APP (81). Many reports indicate that X11 binds to APP and suppresses Aβ generation in vitro and in vivo (45,82–85). Our observations thus suggest that the increased concentrations of Aβ in AD patients could be, at least partially, related to the loss of X11 in AD.
Next, we evaluated the correlations between cognitive performance and X11 or Aβ. X11 was only positively associated with perceptual speed and soluble Aβ42 only negatively with episodic memory. However, we detected strong correlations between insoluble Aβ42, Aβ plaques and multiple antemortem cognitive indices, even though we observed occasional accumulation of Aβ in brains of neurologically and cognitively normal individual. These observations are in line with previous reports, including immunohistochemistry results from the Rush Religious Orders Study (6,8,11,86). Neuroimaging findings in a large population-based study with more than 400 normal older participants showed that 34% presented increased ratios of Pittsburgh compound B binding, which were correlated with memory performance, language, attention, and visuospatial processing (87). Accordingly, we also report a negative association between visuospatial ability and plaque counts. Lastly, we observed a significant inverse correlation between insoluble Aβ42 or plaques and performance in episodic, semantic or working memory. The present data indicate that Aβ levels in the parietal cortex are markers for cognitive impairment, particularly when insolubility is taken into account.
Synaptic Markers
A wealth of converging evidence indicates that synapse loss is an early event in the pathogenesis of AD (21,24,46,47,50,88–92). In this study, we analyzed the levels of 6 different synaptic proteins in detergent-soluble fractions of parietal cortices. Our analysis failed to show any correlation with memory loss for drebrin, syntaxin 3 and PSD-95, but there was a positive correlation with semantic memory for SNAP25. Previous publications have shown decreased levels of SNAP25 protein and mRNA in postmortem AD brain samples (48,93,94), but we did not observe any significant variations of SNAP25 concentrations in the parietal cortex between groups. On the other hand, syntaxin 3 levels were surprisingly reduced only in MCI subjects, which contrast with previous studies (22,48,54,95). Interestingly, reduced syntaxin mRNA levels were previously observed in the CA1 hippocampal brain region from MCI subjects of the Religious Orders Study (22). However, in contrast to our observations in the parietal cortex, the authors reported a correlation with global cognitive performance score (22). Thus, it is important to consider which brain region is analyzed when comparing results from different studies.
The next synaptic marker found to correlate with antemortem cognitive performance was septin-3. Septin-3 is a neuronal member of the septin subfamily of GTPase-domain proteins, which is involved in vesicle trafficking, neurite outgrowth, and neurofibrillary tangle formation (96,97). Here, we established a positive correlation between septin-3 and MMSE, global cognitive score, episodic memory and working memory performances. Moreover, septin-3 levels were significantly downregulated in AD but not in MCI. Taken together with the genetic association of septin-3 with AD (98), our data suggest that this protein might be related to cognitive decline.
Lastly, the synaptic marker that best correlated negatively with cognitive decline was synaptophysin. Indeed, we observed strong positive correlations between synaptophysin levels and all cognitive domains, which is in line with previous reports (18,19,22). Interestingly, we noticed a significant decrease in synaptophysin levels in AD but also in MCI subjects. Consistently, synaptophysin losses in presynaptic terminals from AD patients have persistently been reported by several groups using immunochemistry, immunoblotting, mRNAin situ hybridization or microarray (18–22,25,48,51–54,92,99,100). This synaptophysin loss in MCI parietal cortices is in agreement with previous assessments performed in the cingulate gyrus (21), but not in the hippocampus (23) or other cortical regions (19). Taken together, these observations highlight that, at least in the parietal cortex, the decrease in synaptophysin or syntaxin 3 might be good early markers of cognitive decline, whereas the loss of septin-3 might occur after conversion to AD.
Cholinergic Markers
An impaired cholinergic neurotransmitter system has long been recognized as a hallmark of AD and forms the rationale of approved treatments (55,101,102). Intriguingly, our observations confirmed that ChAT and VAChT concentrations in the parietal cortex were lower in advanced AD, as indexed with the Reagan criteria, but they were not associated with antemortem cognitive scores. Multiple approaches including biochemical assessment, mRNA hybridization and imaging analysis have also demonstrated decreased levels of these cholinergic markers in AD brains (103–107); these alterations could be correlated with disease severity (104) or amyloid plaque numbers in preclinical AD (106). However, no analysis of cognitive performance was carried out in those reports. Supporting our observation, in the Religious Orders Study, previous analysis reported an increase of hippocampal ChAT activity only in MCI subjects (107) and a markedly depleted hippocampal ChAT levels in AD cases (107,108).
The time point at which those cholinergic alterations appear in AD is still debated. Some groups have reported that lower cortical presynaptic cholinergic markers occurred only in later clinical stages (109–113), whereas others published that part of cortical and/or basal cholinergic markers in the forebrain were altered prior to the onset of MCI (114–117). Imaging studies of the cortical cholinergic system in living human subjects generally support early involvement of the deficit, that is, at the stage of MCI or mild dementia (105,106,118,119). Our results and those of the Religious Orders Study on the other hand support a relatively weak link between cholinergic markers and early cognitive symptoms; they rather suggest that the decrease in cortical ChAT and VAChT takes place when Aβ and tau neuropathology becomes extensive (108).
Other AD Markers
Numerous other neuronal proteins, which are not exclusively present in synapses, are suspected to be implicated in the pathogenesis of AD. However, among the additional markers studied in this paper, only GSTP1 and cytoplasmic inclusions of pS403/404 TDP-43 were inversely correlated with global cognitive score whereas levels of soluble pS403/404 TDP-43 were positively associated. Accordingly, previous studies indicate that TDP-43 pathology is strongly associated with clinical phenotypes in AD (17,120,121), supporting our observations in the parietal cortex. Interestingly though, cytoplasmic pS403/404 TDP-43 inclusions also correlated negatively with all separate cognitive domains, while nonphosphorylated TDP-43 inclusions were previously inversely associated only with episodic and working memory in the same cohort (15,16).
Lastly, we demonstrate for the first time that GSTP1, a detoxification enzyme that should protect from oxidative stress, is negatively correlated with cognitive performance, positively correlated with tau and Aβ pathologies and significantly increased in the MCI group. This observation is in accordance with recent comparative analysis of the proteome from AD and nondemented patients showing a significant increase of GSTP1 in AD (95). Taken together, these results suggest that GSTP1 and TDP-43 (phosphorylated at S396/404) might be good markers for the progression of cognitive impairment during AD.
The Concept of MCI-NAP
In recent years, the concept of “suspected non Alzheimer disease pathophysiology” (SNAP) has gained growing interest. It is a biomarker-based concept relying on the presence or absence of Aβ evidenced by PET scan and/or CSF measurements (122–125). The SNAP concept categorizes NCI individuals without amyloid loading and no cognitive impairment but with a “brain injury/neurodegeneration” evidenced by hippocampal atrophy estimated with MRI, probably compensated by cognitive reserve (122–125). As in others cohorts, we observed heterogeneity among subjects in NCI and MCI groups with and without amyloid plaques whereas all AD subjects had amyloid plaques (Fig. 4). Thus, we applied the SNAP concept by analyzing hippocampal atrophy in the NCI group but found no significant differences. Slower pathology progression (as assessed with neuroimaging) has been reported in MCI individuals without amyloid pathology (MCI-NAP) (126,127). MCI-NAP individuals could represent a mix of several different types of amyloid-unrelated pathologies that may resemble AD clinically, in line with the fact that a non-negligible minority of patients do not meet neuropathologic criteria for AD histopathology (126,128). Here, the MCI-NAP subgroup had low concentrations of soluble and insoluble Aβ42, consistent with the absence of plaques; however, tau as well as cholinergic and synaptic markers in the parietal cortex were similar to the MCI-AP group. Interestingly, however, GSTP1 levels were significantly higher in MCI-AP individuals, possibly reflecting the presence of abnormal oxidative stress associated to amyloid pathology. Assessment of GSTP1 concentrations could therefore be useful to subcategorize MCI.
Limitations of This Study
Although the Rush Religious Orders Study is one of the best-characterized cohorts used for clinicopathological studies, we used a limited number of subjects to conduct this study for technical reasons. This limitation must be taken into consideration and further analysis in a larger cohort is needed to confirm our results. In addition, it is important to acknowledge the limitations of correlative analyses to avoid using them as evidence of cause-effect relationships. Regression analyses tell us that 2 variables are associated without inferring a causative link (129). Moreover in AD, numerous alterations were reported with multiple putative causes adding a complexity level to decipher causative links between these alterations and cognitive decline. Different brain changes can be related only through a common cause. Highly significant correlates of AD symptomatology might just be a beneficial compensatory mechanism and could even display detrimental consequences if targeted (130–137). For example, it has been argued that removal of Aβ plaques or tau tangles from the aged diseased brain could rather disrupt an ongoing compensatory mechanism and be harmful (137,138). The failure of anti-amyloid treatments late into clinical development only added more fuel to this counterargument (136,137). Nevertheless, a strong correlation remains a crucial clue of clinically significant ongoing pathogenic processes.
CONCLUSION
In conclusion, we set out to help harmonize the pathological and clinical diagnosis of AD. We performed an extensive correlation study between biochemically-determined AD markers in the parietal cortex and antemortem cognitive symptoms. Our main finding is that insoluble phosphorylated tau, (and tangle counts), as well as insoluble Aβ42 (and plaque counts) stand as the strongest postmortem correlates of cognitive impairment. Moreover, our data also highlight that inclusions of phosphorylated TDP-43 and loss of synaptic proteins such as synaptophysin are associated with cognitive decline, thus justifying further investigations on their role(s) in AD pathogenesis. Hence, all these markers are potential drug targets or, at the very least, may be useful surrogate biomarkers.
Cyntia Tremblay and Arnaud François contributed equally to this work.
This work was supported by grants from the Alzheimer Society Canada (FC), the Canadian Institutes of Health Research (CIHR) (FC-MOP 102532), the Canada Foundation for Innovation (FC-10307), National Institute of Aging grants (DAB) P30AG10161 and RF1AG15819. The salary of F. Calon was supported by the Fonds de recherche du Québec – Santé.
Supplementary data can be found athttp://www.jnen.oxfordjournals.org.
Supplementary Material
ACKNOWLEDGMENT
The authors are indebted to the hundreds of nuns, priests, and brothers from the Catholic clergy participating in the Religious Orders Study.
Contributor Information
Cyntia Tremblay, Faculté de pharmacie, Université Laval, Québec, QC, Canada; Centre Hospitalier Universitaire de Québec (CHU-Q) Research Center, Neuroscience Axis, Québec, QC, Canada.
Arnaud François, Faculté de pharmacie, Université Laval, Québec, QC, Canada; Centre Hospitalier Universitaire de Québec (CHU-Q) Research Center, Neuroscience Axis, Québec, QC, Canada.
Charlotte Delay, Facteurs de risque et déterminants moléculaires des maladies liées au vieillissement (RID-AGE) Research Group, University of Lille, INSERM U1167, Lille University Medical Center, Institut Pasteur de Lille, Lille, France (CD).
Laure Freland, Faculté de pharmacie, Université Laval, Québec, QC, Canada; Centre Hospitalier Universitaire de Québec (CHU-Q) Research Center, Neuroscience Axis, Québec, QC, Canada.
Milène Vandal, Faculté de pharmacie, Université Laval, Québec, QC, Canada; Centre Hospitalier Universitaire de Québec (CHU-Q) Research Center, Neuroscience Axis, Québec, QC, Canada.
David A Bennett, Rush Alzheimer’s Disease Center, Rush University Medical Center, Chicago, IL.
Frédéric Calon, Faculté de pharmacie, Université Laval, Québec, QC, Canada; Centre Hospitalier Universitaire de Québec (CHU-Q) Research Center, Neuroscience Axis, Québec, QC, Canada.
REFERENCES
- 1. Morris JC, Blennow K, Froelich L,et al. Harmonized diagnostic criteria for Alzheimer’s disease: recommendations.J Intern Med 2014;275:204–13 [DOI] [PubMed] [Google Scholar]
- 2. Serrano-Pozo A, Frosch MP, Masliah E,et al. Neuropathological alterations in Alzheimer disease.Cold Spring Harb Perspect Med 2011;1:a006189. [DOI] [PMC free article] [PubMed] [Google Scholar]
- 3. Bennett DA. Postmortem indices linking risk factors to cognition: results from the Religious Order Study and the Memory and Aging Project.Alzheimer Dis Assoc Disord 2006;20:S63–8 [DOI] [PubMed] [Google Scholar]
- 4. Schneider JA, Arvanitakis Z, Leurgans SE,et al. The neuropathology of probable Alzheimer disease and mild cognitive impairment.Ann Neurol 2009;66:200–8 [DOI] [PMC free article] [PubMed] [Google Scholar]
- 5. Bennett DA, Schneider JA, Arvanitakis Z,et al. Overview and findings from the religious orders study.Curr Alzheimer Res 2012;9:628–45 [DOI] [PMC free article] [PubMed] [Google Scholar]
- 6. Bennett DA, Schneider JA, Wilson RS,et al. Neurofibrillary tangles mediate the association of amyloid load with clinical Alzheimer disease and level of cognitive function.Arch Neurol 2004;61:378–84 [DOI] [PubMed] [Google Scholar]
- 7. Dubois B, Feldman HH, Jacova C,et al. Revising the definition of Alzheimer’s disease: a new lexicon.Lancet Neurol 2010;9:1118–27 [DOI] [PubMed] [Google Scholar]
- 8. Tremblay C, Pilote M, Phivilay A,et al. Biochemical characterization of Abeta and tau pathologies in mild cognitive impairment and Alzheimer’s disease.J Alzheimers Dis 2007;12:377–90 [DOI] [PubMed] [Google Scholar]
- 9. Liu CC, Kanekiyo T, Xu H,et al. Apolipoprotein E and Alzheimer disease: risk, mechanisms and therapy.Nat Rev Neurol 2013;9:106–18 [DOI] [PMC free article] [PubMed] [Google Scholar]
- 10. Li JQ, Tan L, Wang HF,et al. Risk factors for predicting progression from mild cognitive impairment to Alzheimer’s disease: a systematic review and meta-analysis of cohort studies.J Neurol Neurosurg Psychiatry 2016;87:476–84 [DOI] [PubMed] [Google Scholar]
- 11. Yu L, Boyle PA, Leurgans S,et al. Disentangling the effects of age and APOE on neuropathology and late life cognitive decline.Neurobiol Aging 2014;35:819–26 [DOI] [PMC free article] [PubMed] [Google Scholar]
- 12. Bennett DA, Schneider JA, Arvanitakis Z,et al. Neuropathology of older persons without cognitive impairment from two community-based studies.Neurology 2006;66:1837–44 [DOI] [PubMed] [Google Scholar]
- 13. Viola KL, Klein WL. Amyloid beta oligomers in Alzheimer’s disease pathogenesis, treatment, and diagnosis.Acta Neuropathol 2015;129:183–206 [DOI] [PMC free article] [PubMed] [Google Scholar]
- 14. Cardenas-Aguayo Mdel C, Gomez-Virgilio L, DeRosa S,et al. The role of tau oligomers in the onset of Alzheimer’s disease neuropathology.ACS Chem Neurosci 2014;5:1178–91 [DOI] [PubMed] [Google Scholar]
- 15. Nag S, Yu L, Capuano AW,et al. Hippocampal sclerosis and TDP-43 pathology in aging and Alzheimer disease.Ann Neurol 2015;77:942–52 [DOI] [PMC free article] [PubMed] [Google Scholar]
- 16. Wilson RS, Yu L, Trojanowski JQ,et al. TDP-43 pathology, cognitive decline, and dementia in old age.JAMA Neurol 2013;70:1418–24 [DOI] [PMC free article] [PubMed] [Google Scholar]
- 17. Tremblay C, St-Amour I, Schneider J,et al. Accumulation of transactive response DNA binding protein 43 in mild cognitive impairment and Alzheimer disease.J Neuropathol Exp Neurol 2011;70:788–98 [DOI] [PMC free article] [PubMed] [Google Scholar]
- 18. Terry RD, Masliah E, Salmon DP,et al. Physical basis of cognitive alterations in Alzheimer’s disease: synapse loss is the major correlate of cognitive impairment.Ann Neurol 1991;30:572–80 [DOI] [PubMed] [Google Scholar]
- 19. Counts SE, Nadeem M, Lad SP,et al. Differential expression of synaptic proteins in the frontal and temporal cortex of elderly subjects with mild cognitive impairment.J Neuropathol Exp Neurol 2006;65:592–601 [DOI] [PubMed] [Google Scholar]
- 20. Calon F, Lim GP, Yang F,et al. Docosahexaenoic acid protects from dendritic pathology in an Alzheimer’s disease mouse model.Neuron 2004;43:633–45 [DOI] [PMC free article] [PubMed] [Google Scholar]
- 21. Scheff SW, Price DA, Ansari MA,et al. Synaptic change in the posterior cingulate gyrus in the progression of Alzheimer’s disease.J Alzheimers Dis 2015;43:1073–90 [DOI] [PMC free article] [PubMed] [Google Scholar]
- 22. Counts SE, Alldred MJ, Che S,et al. Synaptic gene dysregulation within hippocampal CA1 pyramidal neurons in mild cognitive impairment.Neuropharmacology 2014;79:172–9 [DOI] [PMC free article] [PubMed] [Google Scholar]
- 23. Counts SE, He B, Nadeem M,et al. Hippocampal drebrin loss in mild cognitive impairment.Neurodegener Dis 2012;10:216–9 [DOI] [PMC free article] [PubMed] [Google Scholar]
- 24. Marcello E, Epis R, Saraceno C,et al. Synaptic dysfunction in Alzheimer’s disease.Adv Exp Med Biol 2012;970:573–601 [DOI] [PubMed] [Google Scholar]
- 25. Reddy PH, Mani G, Park BS,et al. Differential loss of synaptic proteins in Alzheimer’s disease: implications for synaptic dysfunction.J Alzheimers Dis 2005;7:103–17; discussion 173–80 [DOI] [PubMed] [Google Scholar]
- 26. Greene SJ, Killiany RJ. Subregions of the inferior parietal lobule are affected in the progression to Alzheimer’s disease.Neurobiol Aging 2010;31:1304–11 [DOI] [PMC free article] [PubMed] [Google Scholar]
- 27. Cavanna AE, Trimble MR. The precuneus: a review of its functional anatomy and behavioural correlates.Brain 2006;129:564–83 [DOI] [PubMed] [Google Scholar]
- 28. Tromp D, Dufour A, Lithfous S,et al. Episodic memory in normal aging and Alzheimer disease: insights from imaging and behavioral studies.Ageing Res Rev 2015;24:232–62 [DOI] [PubMed] [Google Scholar]
- 29. Skovronsky DM, Doms RW, Lee VM. Detection of a novel intraneuronal pool of insoluble amyloid beta protein that accumulates with time in culture.J Cell Biol 1998;141:1031–9 [DOI] [PMC free article] [PubMed] [Google Scholar]
- 30. Julien C, Bretteville A, Planel E. Biochemical isolation of insoluble tau in transgenic mouse models of tauopathies.Methods Mol Biol 2012;849:473–91 [DOI] [PubMed] [Google Scholar]
- 31. Ishihara T, Hong M, Zhang B,et al. Age-dependent emergence and progression of a tauopathy in transgenic mice overexpressing the shortest human tau isoform.Neuron 1999;24:751–62 [DOI] [PubMed] [Google Scholar]
- 32. Probst A, Gotz J, Wiederhold KH,et al. Axonopathy and amyotrophy in mice transgenic for human four-repeat tau protein.Acta Neuropathol 2000;99:469–81 [DOI] [PubMed] [Google Scholar]
- 33. Gotz J, Tolnay M, Barmettler R,et al. Oligodendroglial tau filament formation in transgenic mice expressing G272V tau.Eur J Neurosci 2001;13:2131–40 [DOI] [PubMed] [Google Scholar]
- 34. Eckermann K, Mocanu MM, Khlistunova I,et al. The beta-propensity of Tau determines aggregation and synaptic loss in inducible mouse models of tauopathy.J Biol Chem 2007;282:31755–65 [DOI] [PubMed] [Google Scholar]
- 35. Tanemura K, Murayama M, Akagi T,et al. Neurodegeneration with tau accumulation in a transgenic mouse expressing V337M human tau.J Neurosci 2002;22:133–41 [DOI] [PMC free article] [PubMed] [Google Scholar]
- 36. Bennett DA, Wilson RS, Schneider JA,et al. Natural history of mild cognitive impairment in older persons.Neurology 2002;59:198–205 [DOI] [PubMed] [Google Scholar]
- 37. Bennett DA, Schneider JA, Aggarwal NT,et al. Decision rules guiding the clinical diagnosis of Alzheimer’s disease in two community-based cohort studies compared to standard practice in a clinic-based cohort study.Neuroepidemiology 2006;27:169–76 [DOI] [PubMed] [Google Scholar]
- 38. Wilson RS, Beckett LA, Barnes LL,et al. Individual differences in rates of change in cognitive abilities of older persons.Psychol Aging 2002;17:179–93 [PubMed] [Google Scholar]
- 39. Bennett DA, Schneider JA, Bienias JL,et al. Mild cognitive impairment is related to Alzheimer disease pathology and cerebral infarctions.Neurology 2005;64:834–41 [DOI] [PubMed] [Google Scholar]
- 40. Bennett DA, Wilson RS, Schneider JA,et al. Apolipoprotein E epsilon4 allele, AD pathology, and the clinical expression of Alzheimer’s disease.Neurology 2003;60:246–52 [DOI] [PubMed] [Google Scholar]
- 41. Greenberg SG, Davies P. A preparation of Alzheimer paired helical filaments that displays distinct tau proteins by polyacrylamide gel electrophoresis.Proc Natl Acad Sci U S A 1990;87:5827–31 [DOI] [PMC free article] [PubMed] [Google Scholar]
- 42. Nelson PT, Braak H, Markesbery WR. Neuropathology and cognitive impairment in Alzheimer disease: a complex but coherent relationship.J Neuropathol Exp Neurol 2009;68:1–14 [DOI] [PMC free article] [PubMed] [Google Scholar]
- 43. Forman MS, Mufson EJ, Leurgans S,et al. Cortical biochemistry in MCI and Alzheimer disease: lack of correlation with clinical diagnosis.Neurology 2007;68:757–63 [DOI] [PubMed] [Google Scholar]
- 44. Guillozet AL, Weintraub S, Mash DC,et al. Neurofibrillary tangles, amyloid, and memory in aging and mild cognitive impairment.Arch Neurol 2003;60:729–36 [DOI] [PubMed] [Google Scholar]
- 45. Saito Y, Sano Y, Vassar R,et al. X11 proteins regulate the translocation of amyloid beta-protein precursor (APP) into detergent-resistant membrane and suppress the amyloidogenic cleavage of APP by beta-site-cleaving enzyme in brain.J Biol Chem 2008;283:35763–71 [DOI] [PMC free article] [PubMed] [Google Scholar]
- 46. Selkoe DJ. Alzheimer’s disease is a synaptic failure.Science 2002;298:789–91 [DOI] [PubMed] [Google Scholar]
- 47. Pozueta J, Lefort R, Shelanski ML. Synaptic changes in Alzheimer’s disease and its models.Neuroscience 2013;251:51–65 [DOI] [PubMed] [Google Scholar]
- 48. Shimohama S, Kamiya S, Taniguchi T,et al. Differential involvement of synaptic vesicle and presynaptic plasma membrane proteins in Alzheimer’s disease.Biochem Biophys Res Commun 1997;236:239–42 [DOI] [PubMed] [Google Scholar]
- 49. Savioz A, Leuba G, Vallet PG. A framework to understand the variations of PSD-95 expression in brain aging and in Alzheimer’s disease.Ageing Res Rev 2014;18:86–94 [DOI] [PubMed] [Google Scholar]
- 50. DeKosky ST, Scheff SW. Synapse loss in frontal cortex biopsies in Alzheimer’s disease: correlation with cognitive severity.Ann Neurol 1990;27:457–64 [DOI] [PubMed] [Google Scholar]
- 51. Sze CI, Troncoso JC, Kawas C,et al. Loss of the presynaptic vesicle protein synaptophysin in hippocampus correlates with cognitive decline in Alzheimer disease.J Neuropathol Exp Neurol 1997;56:933–44 [DOI] [PubMed] [Google Scholar]
- 52. Heffernan JM, Eastwood SL, Nagy Z,et al. Temporal cortex synaptophysin mRNA is reduced in Alzheimer’s disease and is negatively correlated with the severity of dementia.Exp Neurol 1998;150:235–9 [DOI] [PubMed] [Google Scholar]
- 53. Beeri MS, Haroutunian V, Schmeidler J,et al. Synaptic protein deficits are associated with dementia irrespective of extreme old age.Neurobiol Aging 2012;33:1125.e1–8 [DOI] [PMC free article] [PubMed] [Google Scholar]
- 54. Minger SL, Honer WG, Esiri MM,et al. Synaptic pathology in prefrontal cortex is present only with severe dementia in Alzheimer disease.J Neuropathol Exp Neurol 2001;60:929–36 [DOI] [PubMed] [Google Scholar]
- 55. Davies P, Maloney AJ. Selective loss of central cholinergic neurons in Alzheimer’s disease.Lancet 1976;2:1403. [DOI] [PubMed] [Google Scholar]
- 56. Kester MI, Teunissen CE, Sutphen C,et al. Cerebrospinal fluid VILIP-1 and YKL-40, candidate biomarkers to diagnose, predict and monitor Alzheimer’s disease in a memory clinic cohort.Alzheimers Res Ther 2015;7:59. [DOI] [PMC free article] [PubMed] [Google Scholar]
- 57. Pinhel MA, Nakazone MA, Cacao JC,et al. Glutathione S-transferase variants increase susceptibility for late-onset Alzheimer’s disease: association study and relationship with apolipoprotein E epsilon4 allele.Clin Chem Lab Med 2008;46:439–45 [DOI] [PubMed] [Google Scholar]
- 58. Bernardini S, Bellincampi L, Ballerini S,et al. Glutathione S-transferase P1 *C allelic variant increases susceptibility for late-onset Alzheimer disease: association study and relationship with apolipoprotein E epsilon4 allele.Clin Chem 2005;51:944–51 [DOI] [PubMed] [Google Scholar]
- 59. Julien C, Tremblay C, Emond V,et al. Sirtuin 1 reduction parallels the accumulation of tau in Alzheimer disease.J Neuropathol Exp Neurol 2009;68:48–58 [DOI] [PMC free article] [PubMed] [Google Scholar]
- 60. Arsenault D, Dal-Pan A, Tremblay C,et al. PAK inactivation impairs social recognition in 3xTg-AD Mice without increasing brain deposition of tau and Abeta.J Neurosci 2013;33:10729–40 [DOI] [PMC free article] [PubMed] [Google Scholar]
- 61. Nelson PT, Alafuzoff I, Bigio EH,et al. Correlation of Alzheimer disease neuropathologic changes with cognitive status: a review of the literature.J Neuropathol Exp Neurol 2012;71:362–81 [DOI] [PMC free article] [PubMed] [Google Scholar]
- 62. Grefkes C, Ritzl A, Zilles K,et al. Human medial intraparietal cortex subserves visuomotor coordinate transformation.Neuroimage 2004;23:1494–506 [DOI] [PubMed] [Google Scholar]
- 63. Karnath HO, Perenin MT. Cortical control of visually guided reaching: evidence from patients with optic ataxia.Cereb Cortex 2005;15:1561–9 [DOI] [PubMed] [Google Scholar]
- 64. Nagahama Y, Okada T, Katsumi Y,et al. Transient neural activity in the medial superior frontal gyrus and precuneus time locked with attention shift between object features.Neuroimage 1999;10:193–9 [DOI] [PubMed] [Google Scholar]
- 65. Simon O, Mangin JF, Cohen L,et al. Topographical layout of hand, eye, calculation, and language-related areas in the human parietal lobe.Neuron 2002;33:475–87 [DOI] [PubMed] [Google Scholar]
- 66. Malouin F, Richards CL, Jackson PL,et al. Brain activations during motor imagery of locomotor-related tasks: a PET study.Hum Brain Mapp 2003;19:47–62 [DOI] [PMC free article] [PubMed] [Google Scholar]
- 67. Schmidt D, Krause BJ, Mottaghy FM,et al. Brain systems engaged in encoding and retrieval of word-pair associates independent of their imagery content or presentation modalities.Neuropsychologia 2002;40:457–70 [DOI] [PubMed] [Google Scholar]
- 68. Platel H, Baron JC, Desgranges B,et al. Semantic and episodic memory of music are subserved by distinct neural networks.Neuroimage 2003;20:244–56 [DOI] [PubMed] [Google Scholar]
- 69. Cabeza R, Ciaramelli E, Olson IR,et al. The parietal cortex and episodic memory: an attentional account.Nat Rev Neurosci 2008;9:613–25 [DOI] [PMC free article] [PubMed] [Google Scholar]
- 70. Bertrand J, Senechal P, Zummo-Soucy M,et al. The formation of tau pathological phospho-epitopes in the axon is prevented by the dephosphorylation of selective sites in primary hippocampal neurons over-expressing human tau.J Neurochem 2010;114:1353–67 [DOI] [PubMed] [Google Scholar]
- 71. Morris M, Maeda S, Vossel K,et al. The many faces of tau.Neuron 2011;70:410–26 [DOI] [PMC free article] [PubMed] [Google Scholar]
- 72. Wang JZ, Xia YY, Grundke-Iqbal I,et al. Abnormal hyperphosphorylation of tau: sites, regulation, and molecular mechanism of neurofibrillary degeneration.J Alzheimers Dis 2013;33 Suppl 1:S123–39 [DOI] [PubMed] [Google Scholar]
- 73. Arriagada PV, Growdon JH, Hedley-Whyte ET,et al. Neurofibrillary tangles but not senile plaques parallel duration and severity of Alzheimer’s disease.Neurology 1992;42:631–9 [DOI] [PubMed] [Google Scholar]
- 74. Wilcock GK, Esiri MM. Plaques, tangles and dementia. A quantitative study.J Neurol Sci 1982;56:343–56 [DOI] [PubMed] [Google Scholar]
- 75. Robinson JL, Geser F, Corrada MM,et al. Neocortical and hippocampal amyloid-beta and tau measures associate with dementia in the oldest-old.Brain 2011;134:3705–12 [DOI] [PMC free article] [PubMed] [Google Scholar]
- 76. Thal DR, Arendt T, Waldmann G,et al. Progression of neurofibrillary changes and PHF-tau in end-stage Alzheimer’s disease is different from plaque and cortical microglial pathology.Neurobiol Aging 1998;19:517–25 [DOI] [PubMed] [Google Scholar]
- 77. Ren Y, Sahara N. Characteristics of tau oligomers.Front Neurol 2013;4:102. [DOI] [PMC free article] [PubMed] [Google Scholar]
- 78. Forest SK, Acker CM, d'Abramo C,et al. Methods for measuring tau pathology in transgenic mouse models.J Alzheimers Dis 2013;33:463–71 [DOI] [PMC free article] [PubMed] [Google Scholar]
- 79. Schor NF. What the halted phase III gamma-secretase inhibitor trial may (or may not) be telling us.Ann Neurol 2011;69:237–9 [DOI] [PubMed] [Google Scholar]
- 80. Schneider LS, Mangialasche F, Andreasen N,et al. Clinical trials and late-stage drug development for Alzheimer’s disease: an appraisal from 1984 to 2014.J Intern Med 2014;275:251–83 [DOI] [PMC free article] [PubMed] [Google Scholar]
- 81. Suzuki T, Nakaya T. Regulation of amyloid beta-protein precursor by phosphorylation and protein interactions.J Biol Chem 2008;283:29633–7 [DOI] [PMC free article] [PubMed] [Google Scholar]
- 82. Lee JH, Lau KF, Perkinton MS,et al. The neuronal adaptor protein X11beta reduces amyloid beta-protein levels and amyloid plaque formation in the brains of transgenic mice.J Biol Chem 2004;279:49099–104 [DOI] [PubMed] [Google Scholar]
- 83. Lee JH, Lau KF, Perkinton MS,et al. The neuronal adaptor protein X11alpha reduces Abeta levels in the brains of Alzheimer’s APPswe Tg2576 transgenic mice.J Biol Chem 2003;278:47025–9 [DOI] [PubMed] [Google Scholar]
- 84. Mitchell JC, Ariff BB, Yates DM,et al. X11beta rescues memory and long-term potentiation deficits in Alzheimer’s disease APPswe Tg2576 mice.Hum Mol Genet 2009;18:4492–500 [DOI] [PMC free article] [PubMed] [Google Scholar]
- 85. Kondo M, Shiono M, Itoh G,et al. Increased amyloidogenic processing of transgenic human APP in X11-like deficient mouse brain.Mol Neurodegener 2010;5:35. [DOI] [PMC free article] [PubMed] [Google Scholar]
- 86. Naslund J, Haroutunian V, Mohs R,et al. Correlation between elevated levels of amyloid beta-peptide in the brain and cognitive decline.Jama 2000;283:1571–7 [DOI] [PubMed] [Google Scholar]
- 87. Kantarci K, Lowe V, Przybelski SA,et al. APOE modifies the association between Abeta load and cognition in cognitively normal older adults.Neurology 2012;78:232–40 [DOI] [PMC free article] [PubMed] [Google Scholar]
- 88. Svennerholm L, Gottfries CG. Membrane lipids, selectively diminished in Alzheimer brains, suggest synapse loss as a primary event in early-onset form (type I) and demyelination in late-onset form (type II).J Neurochem 1994;62:1039–47 [DOI] [PubMed] [Google Scholar]
- 89. Masliah E, Mallory M, Alford M,et al. Altered expression of synaptic proteins occurs early during progression of Alzheimer’s disease.Neurology 2001;56:127–9 [DOI] [PubMed] [Google Scholar]
- 90. Mattson MP. Pathways towards and away from Alzheimer’s disease.Nature 2004;430:631–9 [DOI] [PMC free article] [PubMed] [Google Scholar]
- 91. Scheff SW, Neltner JH, Nelson PT. Is synaptic loss a unique hallmark of Alzheimer’s disease?.Biochem Pharmacol 2014;88:517–28 [DOI] [PMC free article] [PubMed] [Google Scholar]
- 92. Heinonen O, Soininen H, Sorvari H,et al. Loss of synaptophysin-like immunoreactivity in the hippocampal formation is an early phenomenon in Alzheimer’s disease.Neuroscience 1995;64:375–84 [DOI] [PubMed] [Google Scholar]
- 93. Greber S, Lubec G, Cairns N,et al. Decreased levels of synaptosomal associated protein 25 in the brain of patients with Down syndrome and Alzheimer’s disease.Electrophoresis 1999;20:928–34 [DOI] [PubMed] [Google Scholar]
- 94. Furuya TK, Silva PN, Payao SL,et al. Analysis of SNAP25 mRNA expression and promoter DNA methylation in brain areas of Alzheimer’s Disease patients.Neuroscience 2012;220:41–6 [DOI] [PubMed] [Google Scholar]
- 95. Musunuri S, Wetterhall M, Ingelsson M,et al. Quantification of the brain proteome in Alzheimer’s disease using multiplexed mass spectrometry.J Proteome Res 2014;13:2056–68 [DOI] [PubMed] [Google Scholar]
- 96. Mostowy S, Cossart P. Septins: the fourth component of the cytoskeleton.Nat Rev Mol Cell Biol 2012;13:183–94 [DOI] [PubMed] [Google Scholar]
- 97. Kinoshita A, Kinoshita M, Akiyama H,et al. Identification of septins in neurofibrillary tangles in Alzheimer’s disease.Am J Pathol 1998;153:1551–60 [DOI] [PMC free article] [PubMed] [Google Scholar]
- 98. Takehashi M, Alioto T, Stedeford T,et al. Septin 3 gene polymorphism in Alzheimer’s disease.Gene Expr 2004;11:263–70 [DOI] [PMC free article] [PubMed] [Google Scholar]
- 99. Callahan LM, Vaules WA, Coleman PD. Progressive reduction of synaptophysin message in single neurons in Alzheimer disease.J Neuropathol Exp Neurol 2002;61:384–95 [DOI] [PubMed] [Google Scholar]
- 100. Masliah E, Terry RD, DeTeresa RM,et al. Immunohistochemical quantification of the synapse-related protein synaptophysin in Alzheimer disease.Neurosci Lett 1989;103:234–9 [DOI] [PubMed] [Google Scholar]
- 101. Herrmann N, Lanctot KL, Hogan DB. Pharmacological recommendations for the symptomatic treatment of dementia: the Canadian Consensus Conference on the Diagnosis and Treatment of Dementia 2012.Alzheimers Res Ther 2013;5:S5. [DOI] [PMC free article] [PubMed] [Google Scholar]
- 102. Perry EK, Tomlinson BE, Blessed G,et al. Correlation of cholinergic abnormalities with senile plaques and mental test scores in senile dementia.Br Med J 1978;2:1457–9 [DOI] [PMC free article] [PubMed] [Google Scholar]
- 103. Chen KH, Reese EA, Kim HW,et al. Disturbed neurotransmitter transporter expression in Alzheimer’s disease brain.J Alzheimers Dis 2011;26:755–66 [DOI] [PMC free article] [PubMed] [Google Scholar] [Retracted]
- 104. Kuhl DE, Minoshima S, Fessler JA,et al. In vivo mapping of cholinergic terminals in normal aging, Alzheimer’s disease, and Parkinson’s disease.Ann Neurol 1996;40:399–410 [DOI] [PubMed] [Google Scholar]
- 105. Mazere J, Prunier C, Barret O,et al. In vivo SPECT imaging of vesicular acetylcholine transporter using [(123)I]-IBVM in early Alzheimer’s disease.Neuroimage 2008;40:280–8 [DOI] [PubMed] [Google Scholar]
- 106. Potter PE, Rauschkolb PK, Pandya Y,et al. Pre- and post-synaptic cortical cholinergic deficits are proportional to amyloid plaque presence and density at preclinical stages of Alzheimer’s disease.Acta Neuropathol 2011;122:49–60 [DOI] [PMC free article] [PubMed] [Google Scholar]
- 107. Ikonomovic MD, Mufson EJ, Wuu J,et al. Cholinergic plasticity in hippocampus of individuals with mild cognitive impairment: correlation with Alzheimer’s neuropathology.J Alzheimers Dis 2003;5:39–48 [DOI] [PubMed] [Google Scholar]
- 108. Ikonomovic MD, Mufson EJ, Wuu J,et al. Reduction of choline acetyltransferase activity in primary visual cortex in mild to moderate Alzheimer’s disease.Arch Neurol 2005;62:425–30 [DOI] [PubMed] [Google Scholar]
- 109. Davis KL, Mohs RC, Marin D,et al. Cholinergic markers in elderly patients with early signs of Alzheimer disease.JAMA 1999;281:1401–6 [DOI] [PubMed] [Google Scholar]
- 110. DeKosky ST, Ikonomovic MD, Styren SD,et al. Upregulation of choline acetyltransferase activity in hippocampus and frontal cortex of elderly subjects with mild cognitive impairment.Ann Neurol 2002;51:145–55 [DOI] [PubMed] [Google Scholar]
- 111. Gilmor ML, Erickson JD, Varoqui H,et al. Preservation of nucleus basalis neurons containing choline acetyltransferase and the vesicular acetylcholine transporter in the elderly with mild cognitive impairment and early Alzheimer’s disease.J Comp Neurol 1999;411:693–704 [PubMed] [Google Scholar]
- 112. Ikonomovic MD, Abrahamson EE, Isanski BA,et al. Superior frontal cortex cholinergic axon density in mild cognitive impairment and early Alzheimer disease.Arch Neurol 2007;64:1312–7 [DOI] [PubMed] [Google Scholar]
- 113. Ikonomovic MD, Wecker L, Abrahamson EE,et al. Cortical alpha7 nicotinic acetylcholine receptor and beta-amyloid levels in early Alzheimer disease.Arch Neurol 2009;66:646–51 [DOI] [PMC free article] [PubMed] [Google Scholar]
- 114. Beach TG, Kuo YM, Spiegel K,et al. The cholinergic deficit coincides with Abeta deposition at the earliest histopathologic stages of Alzheimer disease.J Neuropathol Exp Neurol 2000;59:308–13 [DOI] [PubMed] [Google Scholar]
- 115. Geula C, Mesulam MM. Cortical cholinergic fibers in aging and Alzheimer’s disease: a morphometric study.Neuroscience 1989;33:469–81 [DOI] [PubMed] [Google Scholar]
- 116. Geula C, Nagykery N, Wu CK,et al. Loss of calbindin-D28K from aging human cholinergic basal forebrain: relation to plaques and tangles.J Neuropathol Exp Neurol 2003;62:605–16 [DOI] [PubMed] [Google Scholar]
- 117. Tiraboschi P, Hansen LA, Alford M,et al. The decline in synapses and cholinergic activity is asynchronous in Alzheimer’s disease.Neurology 2000;55:1278–83 [DOI] [PubMed] [Google Scholar]
- 118. Muth K, Schonmeyer R, Matura S,et al. Mild cognitive impairment in the elderly is associated with volume loss of the cholinergic basal forebrain region.Biol Psychiatry 2010;67:588–91 [DOI] [PubMed] [Google Scholar]
- 119. Sabri O, Kendziorra K, Wolf H,et al. Acetylcholine receptors in dementia and mild cognitive impairment.Eur J Nucl Med Mol Imaging 2008;35 (Suppl 1):S30–45 [DOI] [PubMed] [Google Scholar]
- 120. Rauramaa T, Pikkarainen M, Englund E,et al. TAR-DNA binding protein-43 and alterations in the hippocampus.J Neural Transm 2011;118:683–9 [DOI] [PubMed] [Google Scholar]
- 121. Ohta Y, Tremblay C, Schneider JA,et al. Interaction of transactive response DNA binding protein 43 with nuclear factor kappaB in mild cognitive impairment with episodic memory deficits.Acta Neuropathol Commun 2014;2:37. [DOI] [PMC free article] [PubMed] [Google Scholar]
- 122. Villeneuve S. Cause of suspected non-Alzheimer disease pathophysiology: if not tau pathology, then what?.JAMA Neurol 2016;73:1177–9 [DOI] [PubMed] [Google Scholar]
- 123. Mormino EC, Papp KV, Rentz DM,et al. Heterogeneity in suspected non-Alzheimer disease pathophysiology among clinically normal older individuals.JAMA Neurol 2016;73:1185–91 [DOI] [PMC free article] [PubMed] [Google Scholar]
- 124. Gordon BA, Blazey T, Su Y,et al. Longitudinal beta-amyloid deposition and hippocampal volume in preclinical alzheimer disease and suspected non-Alzheimer disease pathophysiology.JAMA Neurol 2016;73:1192–200 [DOI] [PMC free article] [PubMed] [Google Scholar]
- 125. Vos SJ, Gordon BA, Su Y,et al. NIA-AA staging of preclinical Alzheimer disease: discordance and concordance of CSF and imaging biomarkers.Neurobiol Aging 2016;44:1–8 [DOI] [PMC free article] [PubMed] [Google Scholar]
- 126. Caroli A, Prestia A, Galluzzi S,et al. Mild cognitive impairment with suspected nonamyloid pathology (SNAP): prediction of progression.Neurology 2015;84:508–15 [DOI] [PMC free article] [PubMed] [Google Scholar]
- 127. Petersen RC, Aisen P, Boeve BF,et al. Mild cognitive impairment due to Alzheimer disease in the community.Ann Neurol 2013;74:199–208 [DOI] [PMC free article] [PubMed] [Google Scholar]
- 128. Beach TG, Monsell SE, Phillips LE,et al. Accuracy of the clinical diagnosis of Alzheimer disease at National Institute on Aging Alzheimer Disease Centers, 2005–2010.J Neuropathol Exp Neurol 2012;71:266–73 [DOI] [PMC free article] [PubMed] [Google Scholar]
- 129. Bewick V, Cheek L, Ball J. Statistics review 7: correlation and regression.Crit Care 2003;7:451–9 [DOI] [PMC free article] [PubMed] [Google Scholar]
- 130. Selkoe DJ. Resolving controversies on the path to Alzheimer’s therapeutics.Nat Med 2011;17:1060–5 [DOI] [PubMed] [Google Scholar]
- 131. Carroll JC, Rosario ER. The potential use of hormone-based therapeutics for the treatment of Alzheimer’s disease.Curr Alzheimer Res 9:18–34 [DOI] [PubMed] [Google Scholar]
- 132. Golde TE. Disease modifying therapy for AD?.J Neurochem 2006;99:689–707 [DOI] [PubMed] [Google Scholar]
- 133. Bretteville A, Planel E. Tau aggregates: toxic, inert, or protective species?.J Alzheimers Dis 2008;14:431–6 [DOI] [PubMed] [Google Scholar]
- 134. Roberson ED, Mucke L. 100 years and counting: prospects for defeating Alzheimer’s disease.Science 2006;314:781–4 [DOI] [PMC free article] [PubMed] [Google Scholar]
- 135. Dunkel P, Chai CL, Sperlagh B,et al. Clinical utility of neuroprotective agents in neurodegenerative diseases: current status of drug development for Alzheimer’s, Parkinson’s and Huntington’s diseases, and amyotrophic lateral sclerosis.Expert Opin Investig Drugs 2012;21:1267–308 [DOI] [PubMed] [Google Scholar]
- 136. Golde TE, Schneider LS, Koo EH. Anti-abeta therapeutics in Alzheimer’s disease: the need for a paradigm shift.Neuron 2011;69:203–13 [DOI] [PMC free article] [PubMed] [Google Scholar]
- 137. Tayeb HO, Yang HD, Price BH,et al. Pharmacotherapies for Alzheimer’s disease: beyond cholinesterase inhibitors.Pharmacol Ther 2012;134:8–25 [DOI] [PubMed] [Google Scholar]
- 138. Perry G, Nunomura A, Raina AK,et al. Amyloid-beta junkies.Lancet 2000;355:757. [DOI] [PubMed] [Google Scholar]
- 139. Papademetris X, Jackowski MP,, Rajeevan N,et al. BioImage Suite: an integrated medical image analysis suite, Section of Bioimaging Sciences, Dept. of Diagnostic Radiology, Yale School of Medicine.
Associated Data
This section collects any data citations, data availability statements, or supplementary materials included in this article.