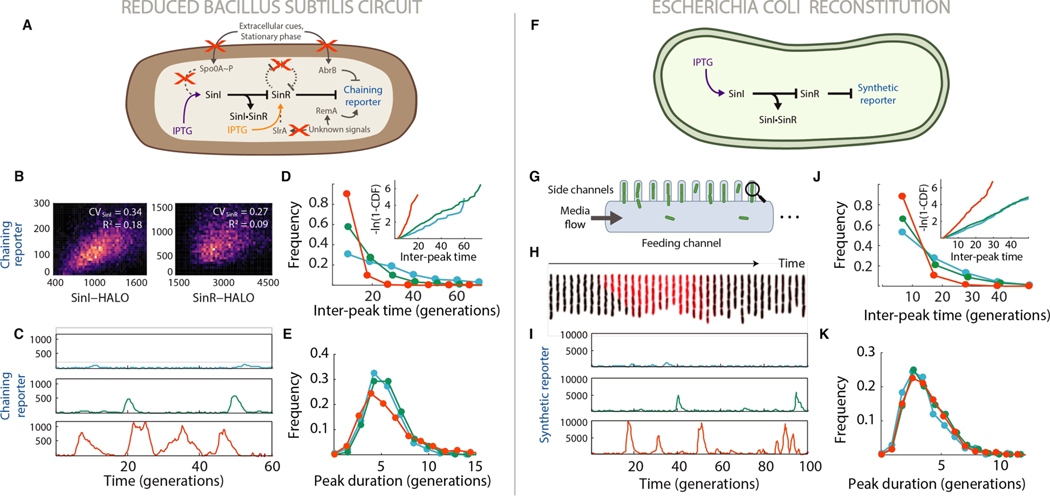
Fig. 2. Stochastic competition drives cell fate switching.
(A) Genetic logic of the reduced B. subtilis circuit. System output was monitored using a chaining reporter gene (PtapA-cfp) (B) Singlecell SinI-HALO (TMN-1227, ΔsinI ΔslrR ylnf/yloA::PsinI -sinI-HALO PtapA-cfp) and SinR-HALO (TMN-1229, ΔsinR ΔslrR ywrK::PsinR--sinR-HALO PtapA-cfp) expression distributions. (C) Example traces of chaining reporter expression in the reduced B. subtilis strain (TMN-1159, ΔsinI ΔslrR Pspank-sinI PtapA-cfp Phag-mKate2 hag233V) grown in 7.5 μM (blue), 10 μM (green) and 12.5 μM (red) IPTG. Measurements of Pspank promoter activity (Fig. S2) suggest that growth in 7.5 μM, 10 μM and 12.5 μM IPTG lead to relative SinI expression levels of 0.4, 0.7 and 1.0, respectively. D-E, Quantitative properties of the reduced B. subtilis system. Curve colors are matched with the data in panel C. (D) Distribution of inter-peak times. Inset: log-transformed cumulative distribution of inter-peak times. (E) Distributions of chaining reporter peak durations. (F) Genetic logic of the reconstituted circuit in E. coli. (G) Schematic of the mother machine device. Magnifying glass indicates that only ‘mother cells’ at the end of each cell channel were tracked. (H) Kymograph of the reconstitution strain (NDL-423, ΔclpXP PrpsOMod-sinR Plac-sinI PsynthR1-GFP) cells in a single lane of the device as they exhibit a pulse of SinR reporter expression (red). Frames were taken 8 minutes apart. (I) Traces of synthetic reporter expression in the reconstitution strain grown in 90 μM (blue), 100 μM (green) and 110 μM (red) IPTG. Measurements of Plac promoter activity (Fig. S2) suggest that growth in 90 μM, 100 μM and 110 μM IPTG lead to relative SinI expression levels of 0.6, 0.8 and 1.0, respectively. J-K, Quantitative properties of the reconstituted SinI-SinR system in E. coli. Curve colors are matched with the data in panel I. (J) Distribution of inter-peak times. Inset: log-transformed cumulative distributions of inter-peak times. (K) Distributions of synthetic reporter peak durations.

