Abstract
Background
Immune checkpoint inhibitors (ICIs) have been increasingly used in cancer treatment, and a subset of patients undergo pseudoprogression. Recognizing the incidence of pseudoprogression is critical for clinical practice.
Purpose
To evaluate by systematic review and meta-analysis the incidence of pseudoprogression in cancer treatment with ICIs, and compare the incidence according to response criteria, tumor types, and immunotherapeutic agents.
Materials and Methods
Medline and Embase were searched to identify relevant studies published before December 31, 2018. Clinical trials, post hoc analysis of clinical trials, and prospective studies on ICI treatment in patients with malignant solid tumors were included. Pooled incidence of pseudoprogression for all included studies, per definition of pseudoprogression, cancer type, and drug type, was obtained by random-effects models with inverse variance weighting model.
Results
Seventeen studies with 3402 patients were analyzed. The pooled incidence of pseudoprogression was 6.0% (95% confidence interval: 5.0%, 7.0%). The definition of pseudoprogression were divided into four categories: progressive disease followed by partial response (PR) or complete response (CR) but not stable disease (SD) with Response Evaluation Criteria in Solid Tumors (RECIST) 1.1 (six studies); progressive disease followed by SD or PR or CR with RECIST 1.1 (five studies); progressive disease followed by SD or PR or CR with RECIST 1.0 (three studies); and progressive disease followed by SD or PR or CR with immune-related response criteria (irRC) (three studies). Incidence of pseudoprogression varied from 4.5% to 8.0% per definition, ranged from 5.0% to 7.0% per cancer type, and was 5.6% with the monotherapy of programmed cell death-1 inhibitor.
Conclusion
The overall incidence of pseudoprogression was 6.0% and was less than 10% in subgroup analyses according to the definitions of pseudoprogression, cancer type, and immune checkpoint inhibitor type. Varying definitions across trials and studies indicates the need for uniform criteria of pseudoprogression for solid tumors.
© RSNA, 2020
Online supplemental material is available for this article.
See also the article by Dodd and MacDermott in this issue.
Summary
The overall incidence of pseudoprogression was 6% and less than 10% in subgroups according to the definition of pseudoprogression, cancer type, and drug type.
Key Results
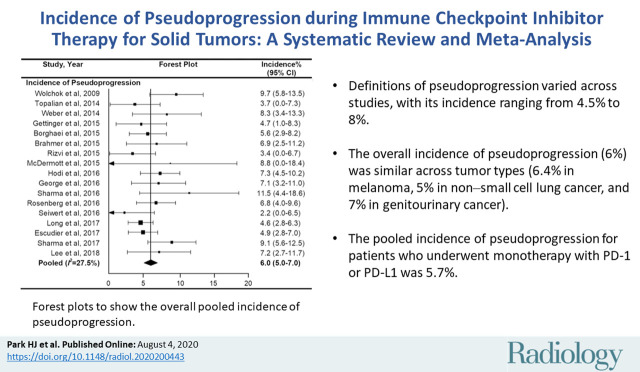
■ Definitions of pseudoprogression varied across studies, with its incidence ranging from 4.5% to 8% in the subgroups with different definitions of pseudoprogression.
■ The overall incidence of pseudoprogression (6%) was similar across tumor types (6.4% in melanoma, 5% in non–small cell lung cancer, and 7% in genitourinary cancer).
■ The pooled incidence of pseudoprogression for patients who underwent monotherapy with programmed cell death protein 1 or its ligand was 5.7%.
Introduction
In the era of cancer immunotherapy, the number of clinical trials for immunotherapeutic agents has been growing. Immune checkpoint inhibitors (ICIs) that target cytotoxic T-lymphocyte-associated antigen 4 (CTLA-4) and programmed cell death protein 1 (PD-1) or its ligand (PD-L1) have been studied in clinical trials and applied in clinical practice (1).
A subset of patients treated with ICI manifest an atypical pattern of tumor response either after an increase of tumor burden or appearance of new lesions, a phenomenon termed pseudoprogression, which is classified as progressive disease by conventional response criteria (2,3). This triggered efforts to develop criteria including immune-related response criteria (irRC) in 2009, immune-related Response Evaluation Criteria in Solid Tumors (RECIST; irRECIST) in 2013, and iRECIST in 2017 (2,4–6).
Along with increasing recognition of pseudoprogression and its importance, several studies evaluated its incidence and patterns (7–9). But a unifying definition of pseudoprogression is lacking. Although studies have raised the need for robust data on pseudoprogression (10,11), to our knowledge, there is no evidence-based systematic summary of definitions and incidence of pseudoprogression.
We performed a systematic review and meta-analysis of published clinical trial reports to determine the incidence of pseudoprogression during treatment with ICI and compared the incidence according to the response criteria, tumor types, and immunotherapeutic agents.
Materials and Methods
In our study, we adhered to the standard guidelines of Preferred Reporting Items for Systematic Reviews and Meta-analyses (12).
Literature Search
A comprehensive search of Medline and Embase was performed to identify relevant studies published before December 31, 2018. The following search terms were used: (cancer or tumor) AND (PD1 OR PD-1 OR PD-L1 OR CTLA4 OR CTLA-4 OR ipilimumab OR nivolumab OR pembrolizumab OR atezolizumab OR avelumab OR durvalumab) AND pseudoprogression. There was no limit of the start date or type of language; however, given a relatively new introduction of these agents, the oldest eligible study was published in 2009 and all articles were in English. To expand the search, the bibliographies of studies that remained after the selection process were screened for other potentially suitable studies.
Inclusion and Exclusion Criteria
Studies that satisfied all of the following criteria were included: population (ie, patients with malignant solid tumors treated with ICI), index test (ie, treatment response assessment by imaging with no limitation for imaging modality), comparison (ie, none), outcomes (ie, results in sufficient detail to evaluate the incidence of pseudoprogression), and study design (ie, clinical trials, post hoc analysis of clinical trials, and prospective studies).
The exclusion criteria were as follows: case reports and series with potential selection biases (eg, nonconsecutive series); review articles, editorials, letters, and conference proceedings; retrospective studies; studies that included patients who were administered other cancer therapy concurrently with ICI without available separated data regarding treatment regimen; studies including patients with primary brain tumor and hematologic malignancies; and studies with overlapping patients (ie, when ≥ two studies reported the same patients, the study with the longer follow-up time was selected).
Quality Assessment
In all included studies (2,13–28), the risk of bias and methodologic quality were evaluated by using the Cochrane Risk of Bias 2.0 (29) for randomized controlled clinical trials (13–15,20,28) and the Risk Of Bias In Nonrandomized Studies of Interventions (30) for nonrandomized studies (2,16–19,21–27).
Data Extraction
From the included studies, we extracted the following data into standardized forms: study characteristics (ie, authors, year of publication, study design, and sample size), demographic and clinical characteristics of the patients (ie, type of cancer, class of ICI, and follow-up period), and outcome characteristics (ie, the number of patients with pseudoprogression and the definitions of pseudoprogression).
Statistical Analysis
The pooled incidence of pseudoprogression was obtained by a random-effects model with an inverse-variance weighting model (31). Heterogeneity was evaluated by using Higgins inconsistency index (I2) test and Cochran Q test (32–35). I2 values greater than 50% indicated substantial heterogeneity (33). Publication bias was assessed by a funnel plot and Begg test. All reported P values are two sided, and P values less than .05 were considered to indicate statistical significance. To test the robustness of the results, a sensitivity analysis was performed by recalculating the pooled estimates after excluding each study.
The pooled incidence of pseudoprogression was obtained for each subgroup classified according to the definition of pseudoprogression, types of cancer (melanoma, non–small cell lung cancer, genitourinary cancers including renal cell carcinoma and urothelial cell carcinoma, and squamous cell cancer of head and neck), and the class of agents (CTLA-4, PD-1, and PD-L1). Univariable and multivariable meta-regression analyses were performed to assess association between study-level covariates and the pooled incidence of pseudoprogression. In the metaregression analysis, we used the Knapp and Hartung adjustment, which is typically used in mixed-effects meta-regression model to control the type 1 error rate of .05 for each analysis and reported multiplicity-adjusted P values and 95% confidence intervals (CIs) (36,37). All statistical analyses were performed by using the metafor package (in R version 3.6.3; R Foundation for Statistical Computing, Vienna, Austria) (31).
Results
Study Characteristics and Quality Assessment
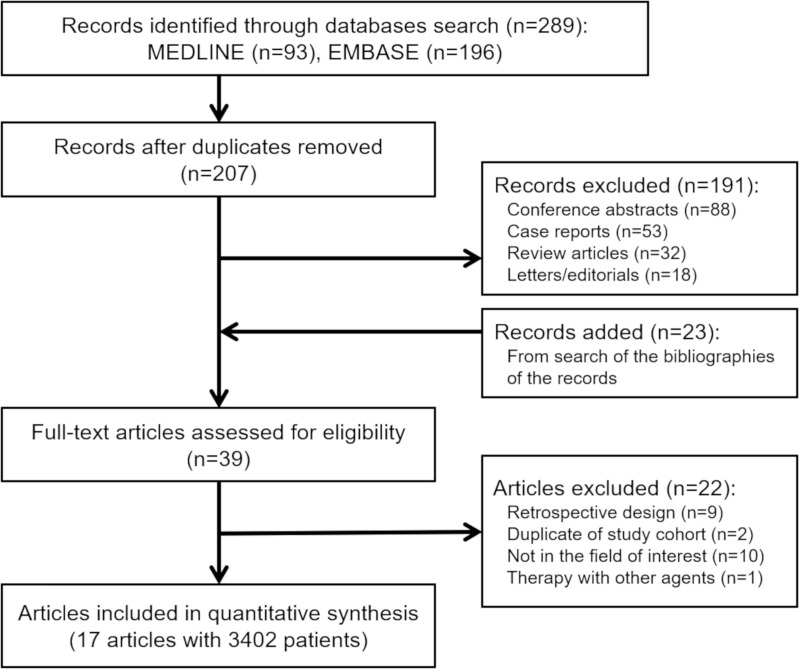
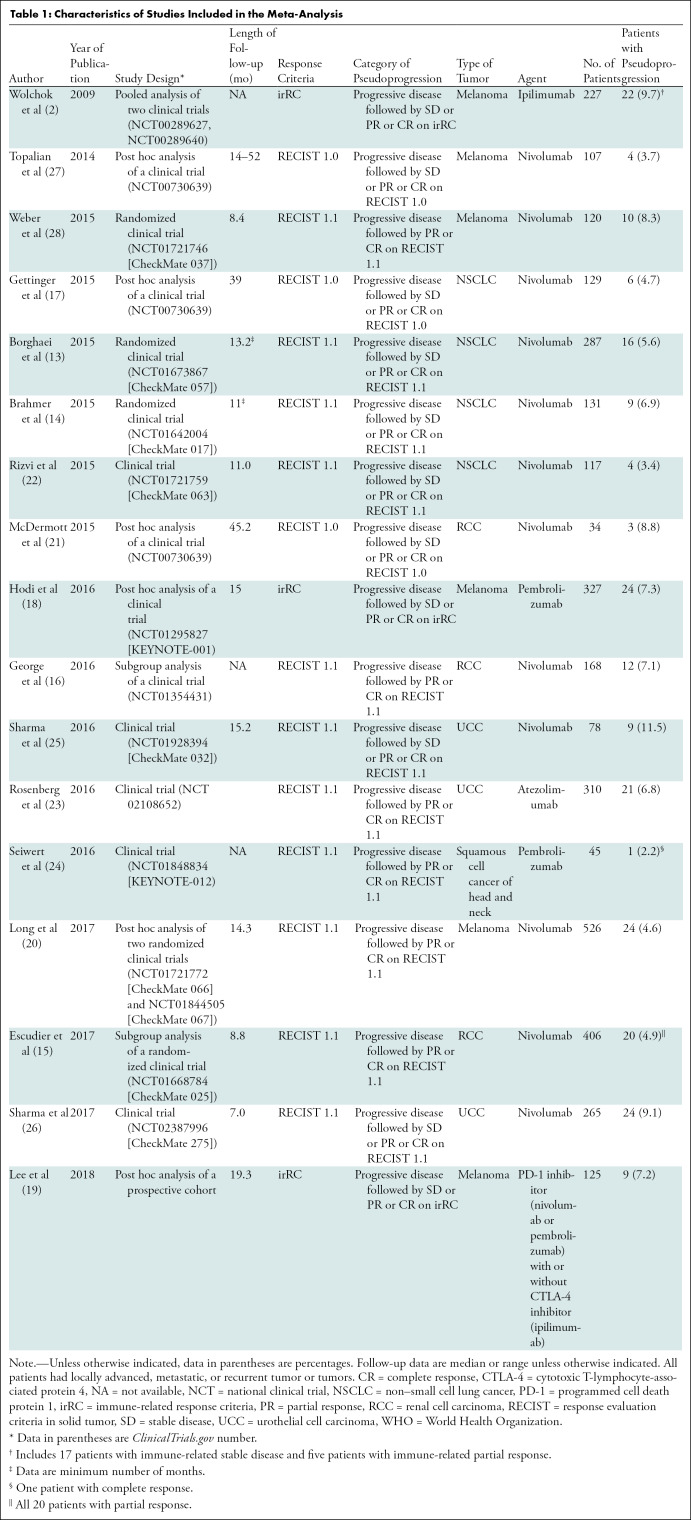
Our search process is shown in Figure 1. The basic characteristics of the 17 studies we included are summarized in Table 1; definitions of pseudoprogression in each study are detailed in Table E1 (online). There were eight clinical trials (13,14,22–26,28), five post hoc analyses of clinical trials (17,18,20,21,27), two subgroup analyses of clinical trials (15,16), one pooled analysis of clinical trials (2), and one post hoc analysis of a prospective cohort (19). Studies included patients with melanoma (n = 6), non–small cell lung cancer (n = 4), renal cell carcinoma (n = 3), urothelial cell carcinoma (n = 3), and squamous cell cancer of the head and neck (n = 1).
Figure 1:
Flow diagram of the study selection process.
Table 1:
Characteristics of Studies Included in the Meta-Analysis
In most studies, monotherapy with the following ICIs was performed: nivolumab (n = 12), pembrolizumab (n = 2), ipilimumab (n = 1), and atezolimumab (n = 1). In the study by Lee et al (19), either monotherapy with PD-1 inhibitor (nivolumab or pembrolizumab) or combination therapy of PD-1 inhibitor (nivolumab or pembrolizumab) and CTLA-4 inhibitor (ipilimumab) was used.
The definitions of pseudoprogression varied across studies (Table 1). According to the response assessment criteria and the degree of response after initial progression required to declare pseudoprogression, the definitions of pseudoprogression were divided into four categories: progressive disease followed by stable disease (SD) or partial response (PR) or complete response (CR) by using irRC (n = 3); progressive disease followed by PR or CR (but not SD) by using RECIST 1.1 (n = 6); progressive disease followed by SD or PR or CR by using RECIST 1.1 (n = 5); and progressive disease followed by SD or PR or CR by using RECIST 1.0 (n = 3).
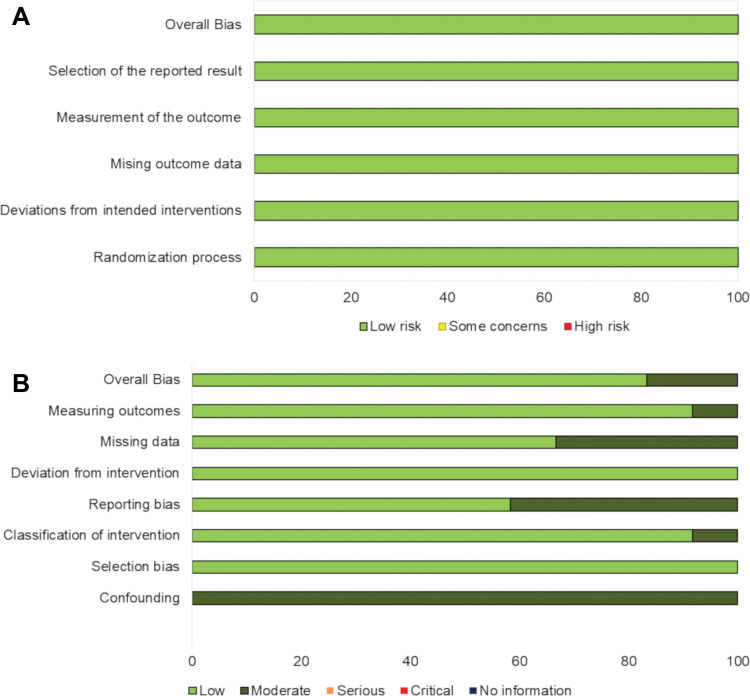
The range of publication dates of studies per definition substantially overlapped as follows: progressive disease followed by PR or CR with RECIST 1.1, 2015–2017; progressive disease followed by SD or PR or CR with RECIST 1.1, 2015–2017; progressive disease followed by SD or PR or CR with RECIST 1.0, 2014–2015; and progressive disease followed by SD or PR or CR on irRC, 2009–2018. Among studies that used irRC, the study by Wolchok et al (2) was published in 2009 and the others were published after 2014. Regarding the quality of the included studies, the risk of bias assessed by Cochrane Risk of Bias 2.0 tool showed low risk for the five randomized clinical trials. For 12 nonrandomized studies, the Risk of Bias in Nonrandomized Studies of Interventions showed low risk in 10 studies and moderate risk in two studies (Fig 2).
Figure 2:
Quality assessment for included studies in meta-analysis. A, Risk of bias 2.0 was used for five randomized controlled clinical trials and, B, Risk of Bias in Nonrandomized Studies of Interventions (ROBINS-I) was used for 12 nonrandomized studies.
Incidence of Pseudoprogression
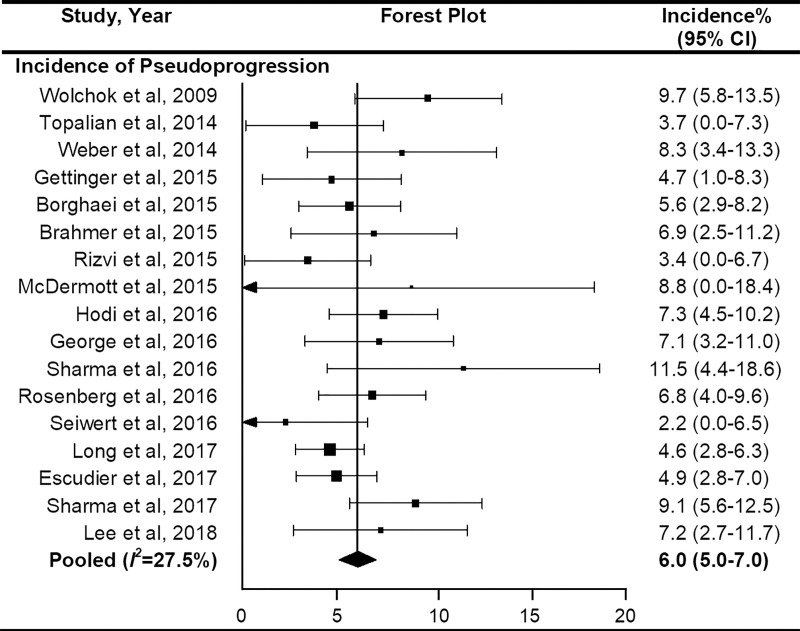
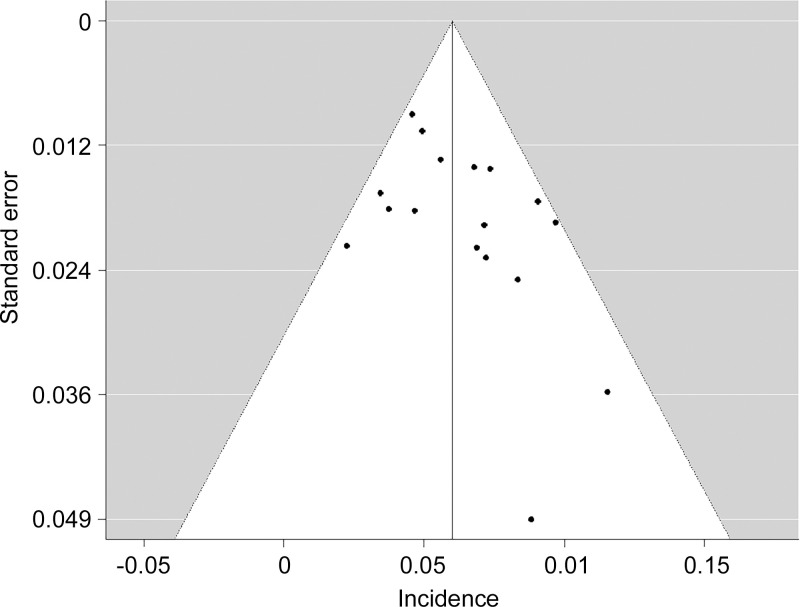
On the basis of the included studies (n = 17) with 3402 patients, the overall incidence of pseudoprogression was 6.0% (95% CI: 5.0%, 7.0%) (Fig 3). No significant heterogeneity was observed (I2 = 27.5%; P = .12). Sensitivity analysis revealed the robustness of recalculated pooled incidence of pseudoprogression after excluding each study ranging from 5.8% to 6.2%. There was no publication bias in the funnel plot (Fig 4) and Begg test (P = .15).
Figure 3:
Forest plots to show the overall pooled incidence of pseudoprogression. The pooled incidence of pseudoprogression was 6.0%. CI = confidence interval.
Figure 4:
Funnel plot for visual appraisal of the literature bias indicated no substantial publication bias. ⋅ indicates individual study.
Subgroup Analysis and Meta-Regression
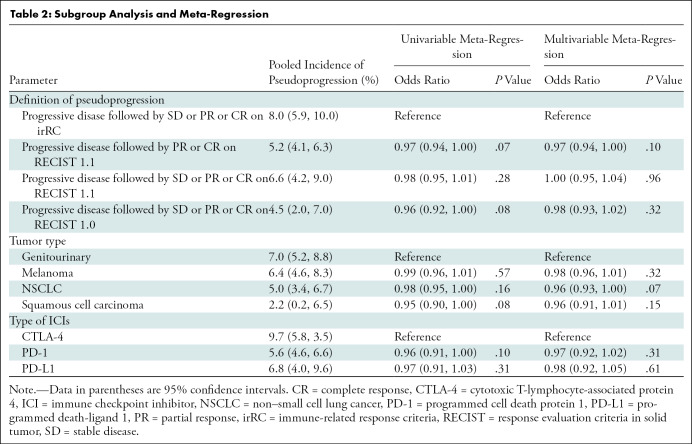
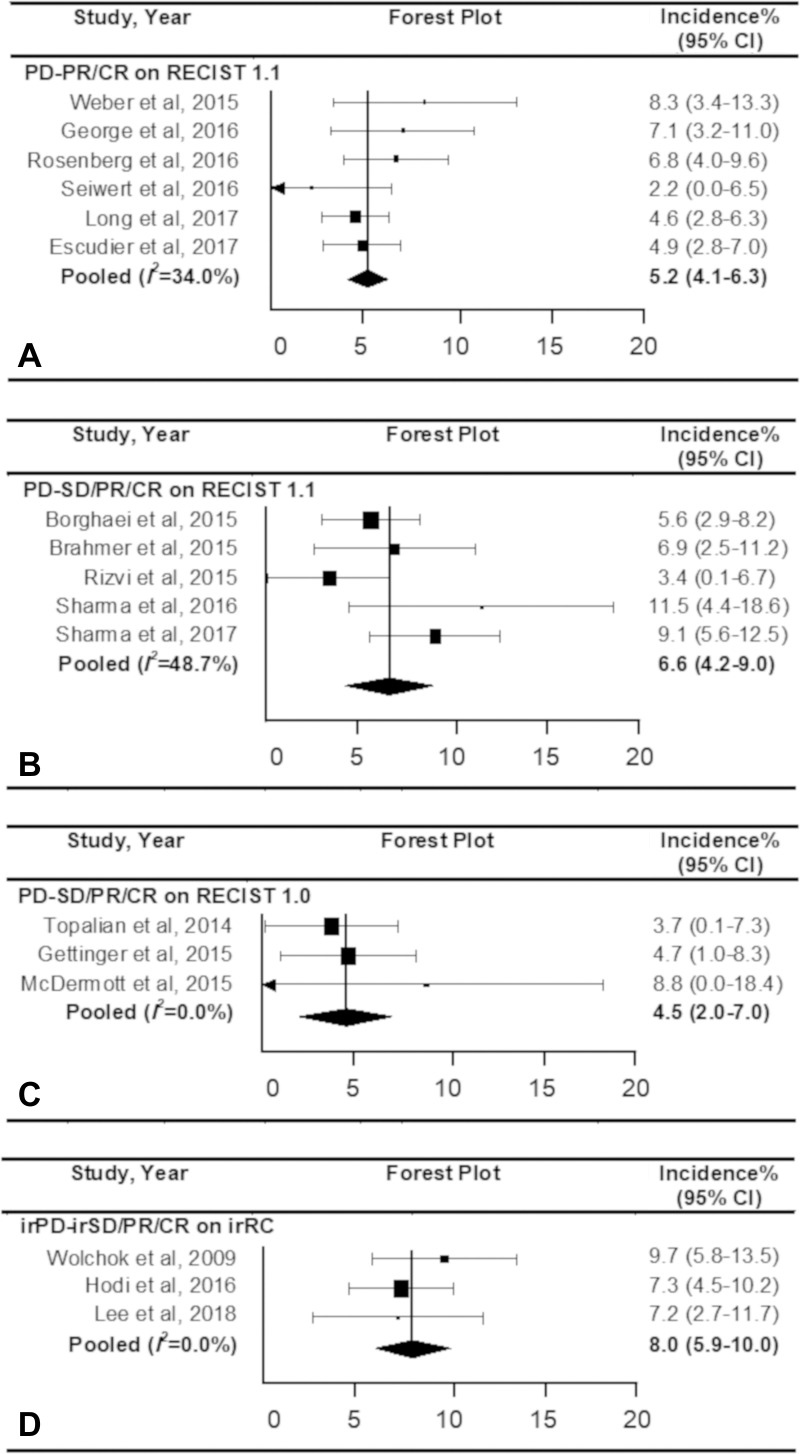
Table 2 lists the pooled incidences of pseudoprogression in the subgroups classified according to the definitions of pseudoprogression, tumor types, and types of ICIs. Regarding the definition of pseudoprogression, the studies with progressive disease followed by SD or PR or CR by using irRC showed the highest pooled incidence of 8.0% (95% CI: 5.9%, 10.0%). The pooled incidences were 5.2% (95% CI: 4.1%, 6.3%) for studies that used progressive disease followed by PR or CR (but not SD) with RECIST 1.1, 6.6% (95% CI: 4.2%, 9.0%) for studies that used progressive disease followed by SD or PR or CR on RECIST 1.1, and 4.5% (95% CI: 2.0%, 7.0%) for studies that used progressive disease followed by SD, PR, or CR on RECIST 1.0 (Fig 5). No significant heterogeneity was observed (I2 ≤ 48.7%; P ≥ .10). Representative examples of pseudoprogression are shown in Figures E1 and E2 (online).
Table 2:
Subgroup Analysis and Meta-Regression
Figure 5:
Forest plots show the pooled incidence of pseudoprogression according to the definition. The pooled incidence of pseudoprogression was, A, 5.2% according to progressive disease (PD) followed by partial response (PR) or complete response (CR) on response evaluation criteria in solid tumor (RECIST) 1.1, B, 6.6% according to progressive disease followed by stable disease (SD) or PR or CR on RECIST 1.1, C, 4.5% according to PD followed by SD or PR or CR on RECIST 1.0, and, D, 8.0% according to PD followed by SD or PR or CR. CI = confidence interval.
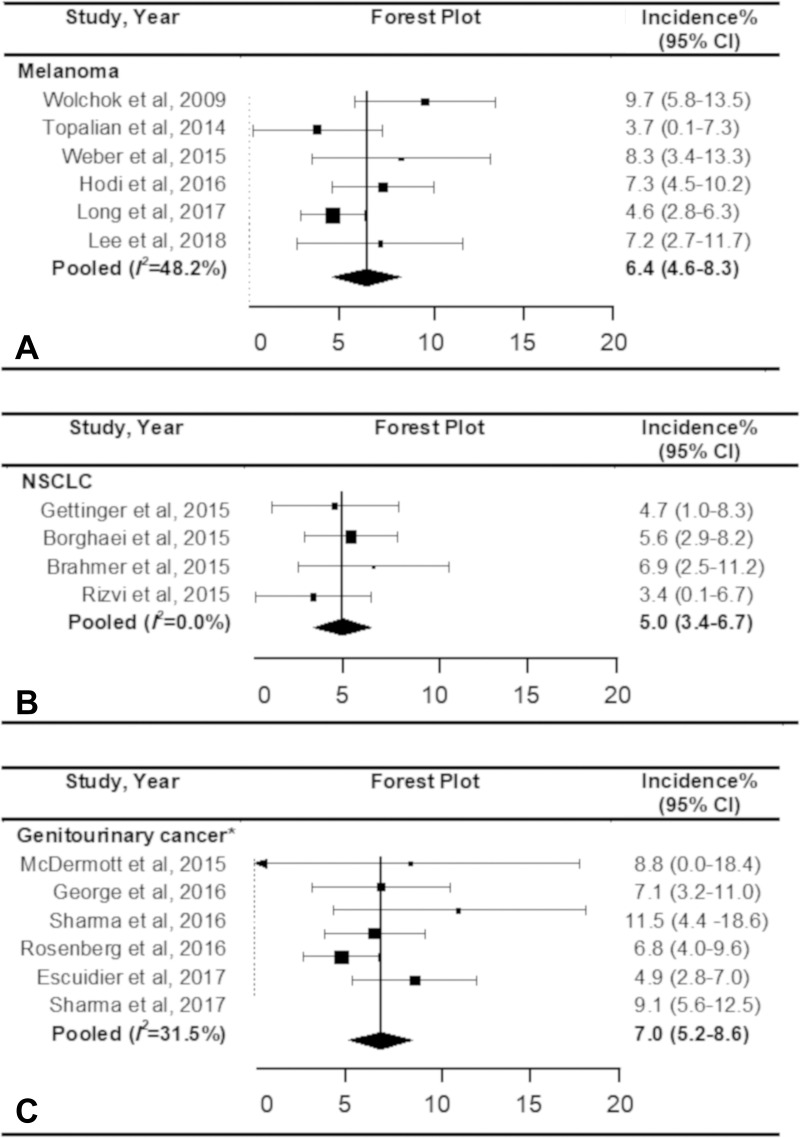
Regarding the tumor types, the pooled incidence of pseudoprogression was 6.4% (95% CI: 4.6%, 8.3%) in patients with melanoma, 5.0% (95% CI: 3.4%, 6.7%) in patients with non–small cell lung cancer, and 7.0% (95% CI: 5.2%, 8.6%) in patients with genitourinary cancer (renal cell carcinoma and urothelial cell carcinoma), without significant heterogeneity (I2 ≤ 48.2%; P ≥ .09) (Fig 6). There was only one study for squamous cell cancer of the head and neck (24), and the incidence of pseudoprogression was 2% (one of 45; 95% CI: 0%, 6%).
Figure 6:
Forest plots show the pooled incidence of pseudoprogression according to the type of cancer. The pooled incidence of pseudoprogression was, A, 6.4% for melanoma, B, 5.0% for non–small cell lung cancer (NSCLC), and, C, 7.0% for genitourinary cancer. * Included renal cell carcinoma and urothelial cell carcinoma. CI = confidence interval.
In 14 studies with PD-1 inhibitor monotherapy, the pooled incidence of pseudoprogression was 5.6% (95% CI: 4.6%, 6.6%), without significant heterogeneity (I2 = 18.2%; P = .18). The incidence was reported as 6.8% (21 of 310) in a study (23) that used PD-L1 inhibitor and 9.7% (22 of 227) in a study (2) that used CTLA-4 inhibitor. The pooled incidence of pseudoprogression in the 15 studies of PD-1 or PD-L1 inhibitor monotherapy was 5.7% (95% CI: 4.8%, 6.6%).
At univariable meta-regression analysis, no significant differences were observed for the pooled incidence of pseudoprogression for all subgroups (Table 2). In multivariable meta-regression with covariates of definition of pseudoprogression, tumor type, and class of ICI, no significant influencing factor on pseudoprogression was found.
Discussion
In this systematic review and meta-analysis, the overall incidence of pseudoprogression was 6.0% in clinical trial reports of patients with cancer undergoing immune checkpoint inhibitor treatment, ranging from 4.5% to 8.0% in subgroups with different response criteria and definitions of pseudoprogression. In all the subgroup analyses, the highest upper limit of 95% confidence intervals (CIs) of pooled incidence of pseudoprogression was 10.0% in the subgroup with immune-related response criteria, which defined pseudoprogression as progressive disease followed by stable disease or partial response or complete response (pooled incidence, 8.0%; 95% CI: 5.9%, 10.0%). This may imply that pseudoprogression occurred less than 10% in the majority of clinical settings.
The incidence was similar across tumor types. The reported incidence of pseudoprogression among patients treated with ICI was 10% or lower (5), ranging from 0.6% to 9.7% (5,8–10,38,39). Our result is within that range and consistent with the previous data in trial and nontrial settings.
Although the common concept of pseudoprogression is a response after an initial increase in tumor burden or appearance of lesions (5), previous studies (3) used different definitions of pseudoprogression and various response criteria. Our study demonstrated four major definitions of pseudoprogression used in the clinical trial reports. The incidence was similar among groups that applied RECIST-based approaches (4.5%–6.6%) but notably higher when irRC was used (8.0%). This is likely because of different measurement methods (ie, unidimensional measurements by RECIST and bidimensional measurement by irRC). Bidimensional measurements used in irRC and the World Health Organization response criteria have measurement variability (4) and higher misclassification rates for progressive disease compared with unidimensional measurements used in RECIST (40). The 25% increase in the products of two perpendicular diameters may be more sensitive to define progressive disease than the 20% increase in the longest diameters. This can lead to a lowered threshold to define progressive disease and pseudoprogression in irRC versus RECIST. On the basis of the scientific evidence of higher reproducibility of the unidimensional approach compared with the bidimensional approach in irRC, the definition of pseudoprogression should be standardized to use a RECIST-based scheme (4,6).
The degree of response after progression required to define pseudoprogression also varied among studies. Some required a response meeting the criteria for CR or PR, but others included patients with subsequent SD as pseudoprogressors (41). In the studies that used RECIST 1.1, the pooled incidence of pseudoprogression was higher in the studies that included patients with subsequent SD as pseudoprogressors (6.6%) than in studies that limited pseudoprogressors as having subsequent PR or CR (4.7%).
The incidence of pseudoprogression according to tumor types were similar with overlapping CIs for the three tumor types (6.4% in melanoma, 5.0% in non–small cell lung cancer, and 7.0% in genitourinary cancer), but the adjustment according to the types of immunotherapeutic agents was not performed because of the small number of studies in each group. When subgroups according to the agent types were analyzed, the pooled incidence in the studies of PD-1/PD-L1 inhibitor monotherapy was 5.7% (95% CI: 4.8%, 6.6%), whereas one study of melanoma that used a CTLA-4 inhibitor showed higher incidence of pseudoprogression (9.7%) (2). In studies of non–small cell lung cancer, all patients were treated with PD-1 inhibitor and showed a small variation of the incidence of pseudoprogression (range, 3.4%–6.9%), which is consistent with the retrospective study by Ferrara et al (38) that reported the incidence of 4.7%. The incidence in genitourinary cancers was 7.0% (range, 4.9%–11.5%), and the study that reported the highest incidence, 11.5% (25), included patients who showed progressive disease followed by SD by using RECIST 1.1.
Another important issue of pseudoprogression is the time range regarding when it is observed during therapy. Specifically, when pseudoprogression occurs and when tumor reduction occurs after pseudoprogression are clinically important issues. Unfortunately, the relevant data were scarce in the studies we included. Included studies were clinical trials or prospective studies, so tumor response was assessed at a predefined time window. The time frame for progression confirmation was 12 weeks in a subset of the included studies (2,15,16,18–20,23,25,28), similar to Immunotherapy Response Assessment in Neuro-oncology (42), whereas in others studies it was 8 weeks or shorter (13,14,17,22,24,27). The currently used response assessment criteria set the time interval as 4 weeks (in irRC) or 4–8 weeks (in iRECIST) to confirm progression. These short time frames risk excluding patients with pseudoprogression too early from the immunotherapy (8,9,41).
Our study had limitations. First, we included only clinical trials and prospective studies that were identified by using the term pseudoprogression and reported the detailed data of pseudoprogression. Studies that did not have patients with pseudoprogression were not included, which may result in an apparent increase of pseudoprogression incidence. Although we did not exclude studies reporting the incidence of pseudoprogression of 0%, all eligible studies meeting the criteria had at least one patient with pseudoprogression. Second, we did not extract the time frame of pseudoprogression because that information was not fully presented in the included studies. It is an inborn limitation of systematic review. Though we have included all the immune checkpoint blockade agents approved by the U.S. Food and Drug Administration at the time of the study, agents may become available and add further knowledge in the near future, given the rapid advancement of immuno-oncology. The results of our study will provide a basis for future studies when sufficient newer data become available.
In spite of the limitations, the comprehensive review and analyses of the existing data in our study provide a basis to develop unifying criteria for this now well-known phenomenon of pseudoprogression. It is clear that the RECIST-based scheme should be used for the assessment, given the higher reproducibility of the measurements and its universal use in oncology clinical trials in the past 2 decades. However, the currently available criteria do not provide the details of definitions of pseudoprogression in terms of the degree of response after initial progression and the duration of subsequent response. Most investigators would consider that the observation of PR or CR after initial progression is sufficient to define pseudoprogression. Two-thirds of the eligible studies in our meta-analyses also included progressive disease followed by SD as a part of their definitions of pseudoprogression, indicating that durable stable disease is recognized as a pattern of response to ICIs in the immuno-oncology community. When including progressive disease followed by SD as pseudoprogression, the minimum duration of SD should be determined, which is similar to the long-standing and well-accepted concept of minimum duration of SD when assigning SD as the best overall response by RECIST (43,44). The minimum duration of SD, though it varies among tumor types and study designs, often falls in the range of 6–12 weeks in many solid tumors and can be proposed as a reference value for this purpose. This issue of duration of response and stable disease also emphasizes the importance of analyzing the tumor burden dynamics over time during therapy, as indicated by several recent studies of immune-related response (8,9,45).
In conclusion, the overall incidence of pseudoprogression was 6.0% in the published trial reports that reported the phenomenon. The incidence was less than 10% in a subgroup of studies categorized according to the response criteria and definitions of pseudoprogression, immune checkpoint inhibitor regimen, and tumor types. Varying definitions of pseudoprogression in the literature show the need for establishing uniform criteria of pseudoprogression for solid tumors and its time frame for progression during therapy. The use of a scheme on the basis of Response Evaluation Criteria in Solid Tumors and the definition of the minimum duration of stable disease following initial progression are the key steps toward this goal.
SUPPLEMENTAL TABLES
SUPPLEMENTAL FIGURES
Disclosures of Conflicts of Interest: H.J.P. disclosed no relevant relationships. K.W.K. Activities related to the present article: disclosed no relevant relationships. Activities not related to the present article: disclosed grants from the Korea Health Technology research and development. Other relationships: disclosed no relevant relationships. J.P. disclosed no relevant relationships. C.H.S. disclosed no relevant relationships. S.Y. disclosed no relevant relationships. H.H. Activities related to the present article: disclosed no relevant relationships. Activities not related to the present article: disclosed money paid to author for consultancy from Mitsubishi Chemical and Canon Medical System; disclosed money to author’s institution for grants from Canon Medical System and Konica Minolta. Other relationships: disclosed no relevant relationships. M.N. Activities related to the present article: disclosed no relevant relationships. Activities not related to the present article: disclosed money paid to author for consultancies from AstraZeneca and Daiichi Sankyo; disclosed grants from Merck, Canon, AstraZeneca, and Daiichi Sankyo; disclosed honorarium from Roche. Other relationships: disclosed no relevant relationships.
K.W.K. supported by the National Research Foundation of Korea (2017R1A2B3011475); S.Y. supported by the Korea Health Industry Development Institute (HI18C2383); H.H. and M.N. supported by the National Cancer Institute at the National Institutes of Health (R01CA203636, U01CA209414)
Abbreviations:
- CI
- confidence interval
- CR
- complete response
- CTLA-4
- cytotoxic T-lymphocyte-associated antigen 4
- ICI
- immune checkpoint inhibitor
- irRECIST
- immune-related RECIST
- PD-1
- programmed cell death protein 1
- PD- L1
- PD-1 ligand
- PR
- partial response
- irRC
- immune-related response criteria
- RECIST
- Response Evaluation Criteria in Solid Tumors
- SD
- stable disease
References
- 1.Borcoman E, Kanjanapan Y, Champiat S, et al. Novel patterns of response under immunotherapy. Ann Oncol 2019;30(3):385–396. [DOI] [PubMed] [Google Scholar]
- 2.Wolchok JD, Hoos A, O’Day S, et al. Guidelines for the evaluation of immune therapy activity in solid tumors: immune-related response criteria. Clin Cancer Res 2009;15(23):7412–7420. [DOI] [PubMed] [Google Scholar]
- 3.Nishino M. Immune-related response evaluations during immune-checkpoint inhibitor therapy: establishing a “common language” for the new arena of cancer treatment. J Immunother Cancer 2016;4(1):30. [DOI] [PMC free article] [PubMed] [Google Scholar]
- 4.Nishino M, Giobbie-Hurder A, Gargano M, Suda M, Ramaiya NH, Hodi FS. Developing a common language for tumor response to immunotherapy: immune-related response criteria using unidimensional measurements. Clin Cancer Res 2013;19(14):3936–3943. [DOI] [PMC free article] [PubMed] [Google Scholar]
- 5.Nishino M, Hatabu H, Hodi FS. Imaging of Cancer Immunotherapy: Current Approaches and Future Directions. Radiology 2019;290(1):9–22. [DOI] [PMC free article] [PubMed] [Google Scholar]
- 6.Seymour L, Bogaerts J, Perrone A, et al. iRECIST: guidelines for response criteria for use in trials testing immunotherapeutics. Lancet Oncol 2017;18(3):e143–e152. [DOI] [PMC free article] [PubMed] [Google Scholar]
- 7.Katz SI, Hammer M, Bagley SJ, et al. Radiologic Pseudoprogression during Anti-PD-1 Therapy for Advanced Non-Small Cell Lung Cancer. J Thorac Oncol 2018;13(7):978–986. [DOI] [PubMed] [Google Scholar]
- 8.Nishino M, Dahlberg SE, Adeni AE, et al. Tumor Response Dynamics of Advanced Non-small Cell Lung Cancer Patients Treated with PD-1 Inhibitors: Imaging Markers for Treatment Outcome. Clin Cancer Res 2017;23(19):5737–5744. [DOI] [PMC free article] [PubMed] [Google Scholar]
- 9.Nishino M, Giobbie-Hurder A, Manos MP, et al. Immune-Related Tumor Response Dynamics in Melanoma Patients Treated with Pembrolizumab: Identifying Markers for Clinical Outcome and Treatment Decisions. Clin Cancer Res 2017;23(16):4671–4679. [DOI] [PMC free article] [PubMed] [Google Scholar]
- 10.Chiou VL, Burotto M. Pseudoprogression and Immune-Related Response in Solid Tumors. J Clin Oncol 2015;33(31):3541–3543. [DOI] [PMC free article] [PubMed] [Google Scholar]
- 11.Nishino M. Pseudoprogression and Measurement Variability. J Clin Oncol 2016;34(28):3480–3481. [DOI] [PubMed] [Google Scholar]
- 12.Moher D, Liberati A, Tetzlaff J, Altman DG; PRISMA Group . Preferred reporting items for systematic reviews and meta-analyses: the PRISMA statement. Int J Surg 2010;8(5):336–341. [DOI] [PubMed] [Google Scholar]
- 13.Borghaei H, Paz-Ares L, Horn L, et al. Nivolumab versus Docetaxel in Advanced Nonsquamous Non-Small-Cell Lung Cancer. N Engl J Med 2015;373(17):1627–1639. [DOI] [PMC free article] [PubMed] [Google Scholar]
- 14.Brahmer J, Reckamp KL, Baas P, et al. Nivolumab versus Docetaxel in Advanced Squamous-Cell Non-Small-Cell Lung Cancer. N Engl J Med 2015;373(2):123–135. [DOI] [PMC free article] [PubMed] [Google Scholar]
- 15.Escudier B, Motzer RJ, Sharma P, et al. Treatment Beyond Progression in Patients with Advanced Renal Cell Carcinoma Treated with Nivolumab in CheckMate 025. Eur Urol 2017;72(3):368–376. [DOI] [PubMed] [Google Scholar]
- 16.George S, Motzer RJ, Hammers HJ, et al. Safety and Efficacy of Nivolumab in Patients With Metastatic Renal Cell Carcinoma Treated Beyond Progression: A Subgroup Analysis of a Randomized Clinical Trial. JAMA Oncol 2016;2(9):1179–1186. [DOI] [PMC free article] [PubMed] [Google Scholar]
- 17.Gettinger SN, Horn L, Gandhi L, et al. Overall Survival and Long-Term Safety of Nivolumab (Anti-Programmed Death 1 Antibody, BMS-936558, ONO-4538) in Patients With Previously Treated Advanced Non-Small-Cell Lung Cancer. J Clin Oncol 2015;33(18):2004–2012. [DOI] [PMC free article] [PubMed] [Google Scholar]
- 18.Hodi FS, Hwu WJ, Kefford R, et al. Evaluation of Immune-Related Response Criteria and RECIST v1.1 in Patients With Advanced Melanoma Treated With Pembrolizumab. J Clin Oncol 2016;34(13):1510–1517. [DOI] [PMC free article] [PubMed] [Google Scholar]
- 19.Lee JH, Long GV, Menzies AM, et al. Association Between Circulating Tumor DNA and Pseudoprogression in Patients With Metastatic Melanoma Treated With Anti-Programmed Cell Death 1 Antibodies. JAMA Oncol 2018;4(5):717–721. [DOI] [PMC free article] [PubMed] [Google Scholar]
- 20.Long GV, Weber JS, Larkin J, et al. Nivolumab for Patients With Advanced Melanoma Treated Beyond Progression: Analysis of 2 Phase 3 Clinical Trials. JAMA Oncol 2017;3(11):1511–1519. [DOI] [PMC free article] [PubMed] [Google Scholar]
- 21.McDermott DF, Drake CG, Sznol M, et al. Survival, Durable Response, and Long-Term Safety in Patients With Previously Treated Advanced Renal Cell Carcinoma Receiving Nivolumab. J Clin Oncol 2015;33(18):2013–2020. [DOI] [PMC free article] [PubMed] [Google Scholar]
- 22.Rizvi NA, Mazières J, Planchard D, et al. Activity and safety of nivolumab, an anti-PD-1 immune checkpoint inhibitor, for patients with advanced, refractory squamous non-small-cell lung cancer (CheckMate 063): a phase 2, single-arm trial. Lancet Oncol 2015;16(3):257–265. [DOI] [PMC free article] [PubMed] [Google Scholar]
- 23.Rosenberg JE, Hoffman-Censits J, Powles T, et al. Atezolizumab in patients with locally advanced and metastatic urothelial carcinoma who have progressed following treatment with platinum-based chemotherapy: a single-arm, multicentre, phase 2 trial. Lancet 2016;387(10031):1909–1920. [DOI] [PMC free article] [PubMed] [Google Scholar]
- 24.Seiwert TY, Burtness B, Mehra R, et al. Safety and clinical activity of pembrolizumab for treatment of recurrent or metastatic squamous cell carcinoma of the head and neck (KEYNOTE-012): an open-label, multicentre, phase 1b trial. Lancet Oncol 2016;17(7):956–965. [DOI] [PubMed] [Google Scholar]
- 25.Sharma P, Callahan MK, Bono P, et al. Nivolumab monotherapy in recurrent metastatic urothelial carcinoma (CheckMate 032): a multicentre, open-label, two-stage, multi-arm, phase 1/2 trial. Lancet Oncol 2016;17(11):1590–1598. [DOI] [PMC free article] [PubMed] [Google Scholar]
- 26.Sharma P, Retz M, Siefker-Radtke A, et al. Nivolumab in metastatic urothelial carcinoma after platinum therapy (CheckMate 275): a multicentre, single-arm, phase 2 trial. Lancet Oncol 2017;18(3):312–322. [DOI] [PubMed] [Google Scholar]
- 27.Topalian SL, Sznol M, McDermott DF, et al. Survival, durable tumor remission, and long-term safety in patients with advanced melanoma receiving nivolumab. J Clin Oncol 2014;32(10):1020–1030. [DOI] [PMC free article] [PubMed] [Google Scholar]
- 28.Weber JS, D’Angelo SP, Minor D, et al. Nivolumab versus chemotherapy in patients with advanced melanoma who progressed after anti-CTLA-4 treatment (CheckMate 037): a randomised, controlled, open-label, phase 3 trial. Lancet Oncol 2015;16(4):375–384. [DOI] [PubMed] [Google Scholar]
- 29.Higgins J, Savović J, Page M, Sterne J. Revised Cochrane risk-of-bias tool for randomized trials (RoB 2). https://www.riskofbias.info/welcome/rob-2-0-tool/current-version-of-rob-2. Published 2019. Accessed June 16, 2019.
- 30.Sterne JA, Hernán MA, Reeves BC, et al. ROBINS-I: a tool for assessing risk of bias in non-randomised studies of interventions. BMJ 2016;355:i4919. [DOI] [PMC free article] [PubMed] [Google Scholar]
- 31.Viechtbauer W. Conducting meta-analyses in R with the metafor package. J Stat Softw 2010;36(3):1–48. [Google Scholar]
- 32.Higgins JPT, Altman DG, Gøtzsche PC, et al. The Cochrane Collaboration’s tool for assessing risk of bias in randomised trials. BMJ 2011;343:d5928. [DOI] [PMC free article] [PubMed] [Google Scholar]
- 33.Higgins JPT, Thompson SG, Deeks JJ, Altman DG. Measuring inconsistency in meta-analyses. BMJ 2003;327(7414):557–560. [DOI] [PMC free article] [PubMed] [Google Scholar]
- 34.Kim KW, Lee J, Choi SH, Huh J, Park SH. Systematic Review and Meta-Analysis of Studies Evaluating Diagnostic Test Accuracy: A Practical Review for Clinical Researchers-Part I. General Guidance and Tips. Korean J Radiol 2015;16(6):1175–1187. [DOI] [PMC free article] [PubMed] [Google Scholar]
- 35.Lee J, Kim KW, Choi SH, Huh J, Park SH. Systematic Review and Meta-Analysis of Studies Evaluating Diagnostic Test Accuracy: A Practical Review for Clinical Researchers-Part II. Statistical Methods of Meta-Analysis. Korean J Radiol 2015;16(6):1188–1196. [DOI] [PMC free article] [PubMed] [Google Scholar]
- 36.Higgins JP, Thompson SG. Controlling the risk of spurious findings from meta-regression. Stat Med 2004;23(11):1663–1682. [DOI] [PubMed] [Google Scholar]
- 37.Knapp G, Hartung J. Improved tests for a random effects meta-regression with a single covariate. Stat Med 2003;22(17):2693–2710. [DOI] [PubMed] [Google Scholar]
- 38.Ferrara R, Mezquita L, Texier M, et al. Hyperprogressive Disease in Patients With Advanced Non-Small Cell Lung Cancer Treated With PD-1/PD-L1 Inhibitors or With Single-Agent Chemotherapy. JAMA Oncol 2018;4(11):1543–1552. [DOI] [PMC free article] [PubMed] [Google Scholar]
- 39.Tazdait M, Mezquita L, Lahmar J, et al. Patterns of responses in metastatic NSCLC during PD-1 or PDL-1 inhibitor therapy: Comparison of RECIST 1.1, irRECIST and iRECIST criteria. Eur J Cancer 2018;88:38–47. [DOI] [PubMed] [Google Scholar]
- 40.Erasmus JJ, Gladish GW, Broemeling L, et al. Interobserver and intraobserver variability in measurement of non-small-cell carcinoma lung lesions: implications for assessment of tumor response. J Clin Oncol 2003;21(13):2574–2582. [DOI] [PubMed] [Google Scholar]
- 41.Nishino M, Ramaiya NH, Hatabu H, Hodi FS. Monitoring immune-checkpoint blockade: response evaluation and biomarker development. Nat Rev Clin Oncol 2017;14(11):655–668. [DOI] [PMC free article] [PubMed] [Google Scholar]
- 42.Okada H, Weller M, Huang R, et al. Immunotherapy response assessment in neuro-oncology: a report of the RANO working group. Lancet Oncol 2015;16(15):e534–e542. [DOI] [PMC free article] [PubMed] [Google Scholar]
- 43.Therasse P, Arbuck SG, Eisenhauer EA, et al. New guidelines to evaluate the response to treatment in solid tumors. European Organization for Research and Treatment of Cancer, National Cancer Institute of the United States, National Cancer Institute of Canada. J Natl Cancer Inst 2000;92(3):205–216. [DOI] [PubMed] [Google Scholar]
- 44.Eisenhauer EA, Therasse P, Bogaerts J, et al. New response evaluation criteria in solid tumours: revised RECIST guideline (version 1.1). Eur J Cancer 2009;45(2):228–247. [DOI] [PubMed] [Google Scholar]
- 45.Champiat S, Dercle L, Ammari S, et al. Hyperprogressive Disease Is a New Pattern of Progression in Cancer Patients Treated by Anti-PD-1/PD-L1. Clin Cancer Res 2017;23(8):1920–1928. [DOI] [PubMed] [Google Scholar]
Associated Data
This section collects any data citations, data availability statements, or supplementary materials included in this article.


