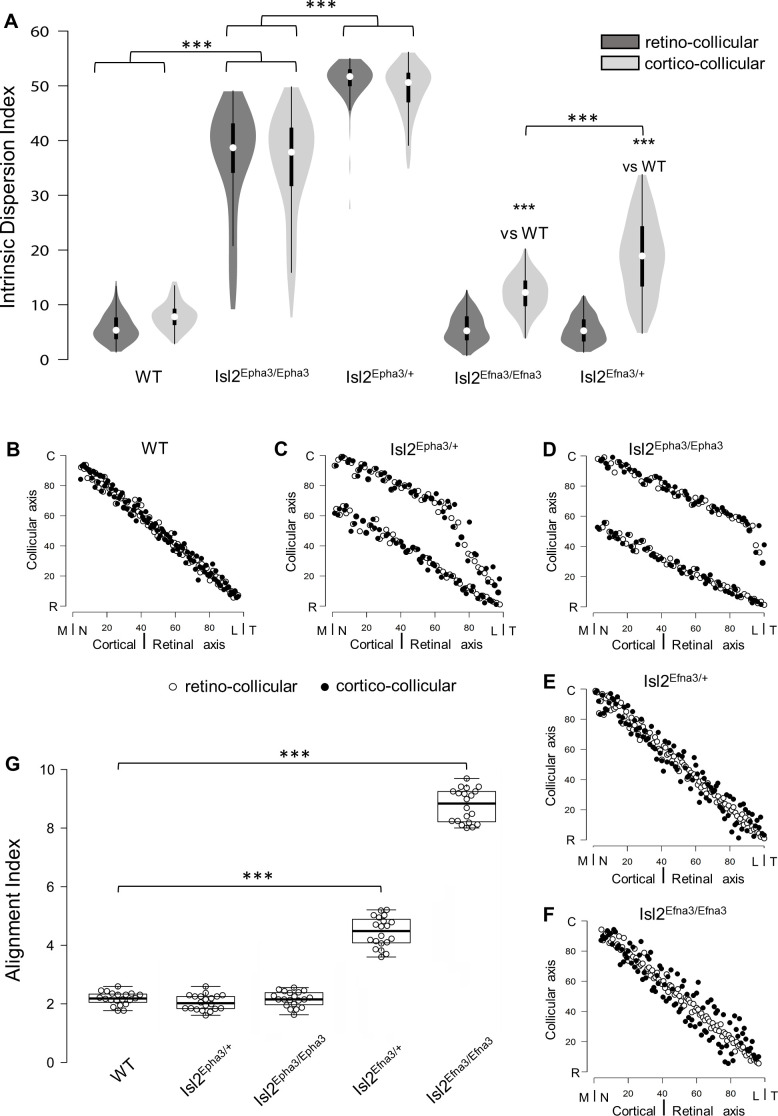
Figure 4. Intrinsic dispersion index (IDI) and alignment index (AI) in Isl2-Epha3KI and Isl2-Efna3KI animal models.
(A) Violin plot representation of the median IDIs (from n = 10 simulated maps, each composed of 100 projections) in WT, Isl2-Epha3KI and Isl2-Efna3KI animal models. Mann-Whitney test: WT IDIretino vs. Isl2Epha3/+ IDIretino, z-score = 12.08, effect r = 0.85, p=6E-55; WT IDIcortico vs. Isl2Epha3/+ IDIcortico, z-score = 12.04, effect r = 0.85, p=8E-52; Isl2Epha3/+ IDIretino vs Isl2Epha3/Epha3 IDIretino, z-score = 11.25, effect r = 0.80, p=2E-39; Isl2Epha3/+ IDIcortico vs Isl2Epha3/Epha3 IDIcortico, z-score = 10.53, effect r = 0.74, p=1E-32; WT IDIcortico vs Isl2Efna3/+ IDIcortico, z-score = 8.30, effect r = 0.59, p=1E-18; WT IDIcortico vs Isl2Efna3/Efna3 IDIcortico, z-score = 10.37, effect r = 0.73, p=3E-31; Isl2Efna3/+ IDIcortico vs Isl2Efna3/Efna3 IDIcortico, z-score = 6.93, effect r = 0.49, p=6E-13; ***p<0.001. (B, C, D, E, F) Representation and superimposition of simulated RC (retino-collicular) (white dots) and CC (cortico-collicular) (black dots) maps in WT (B), Isl2Epha3/+ (C), Isl2Epha3/Epha3 (D), Isl2Efna3/+ (E) and Isl2Efna3/Efna3 (F) animals (representative of n = 10 runs). (G) Box plot representation of median AI (from n = 20 simulated RC/CC maps) in WT, Isl2Epha3/+, Isl2Epha3/Epha3, Isl2Efna3/+ and Isl2Efna3/Efna3 animals. Mann-Whitney test: AI WT vs. AI Isl2Epha3/+, z-score = 1.62, effect r = 0.26 p=0.10; AI WT vs. AI Isl2Epha3/Epha3, z-score = 0.11, effect r = 0.02, p=0.90; AI WT vs AI Isl2Efna3/+, z-score = 5.40, effect r = 0.85, p=1.45E-11; AI WT vs AI Isl2Efna3/Efna3, z-score = 5.40, effect r = 0.85, p=1.45E-11. ***p<0.001. Abbreviations: IDI, intrinsic dispersion index; AI, alignment index; WT, wild-type; N, nasal; T, temporal; R, rostral; C, caudal; M, medial; L, lateral.

