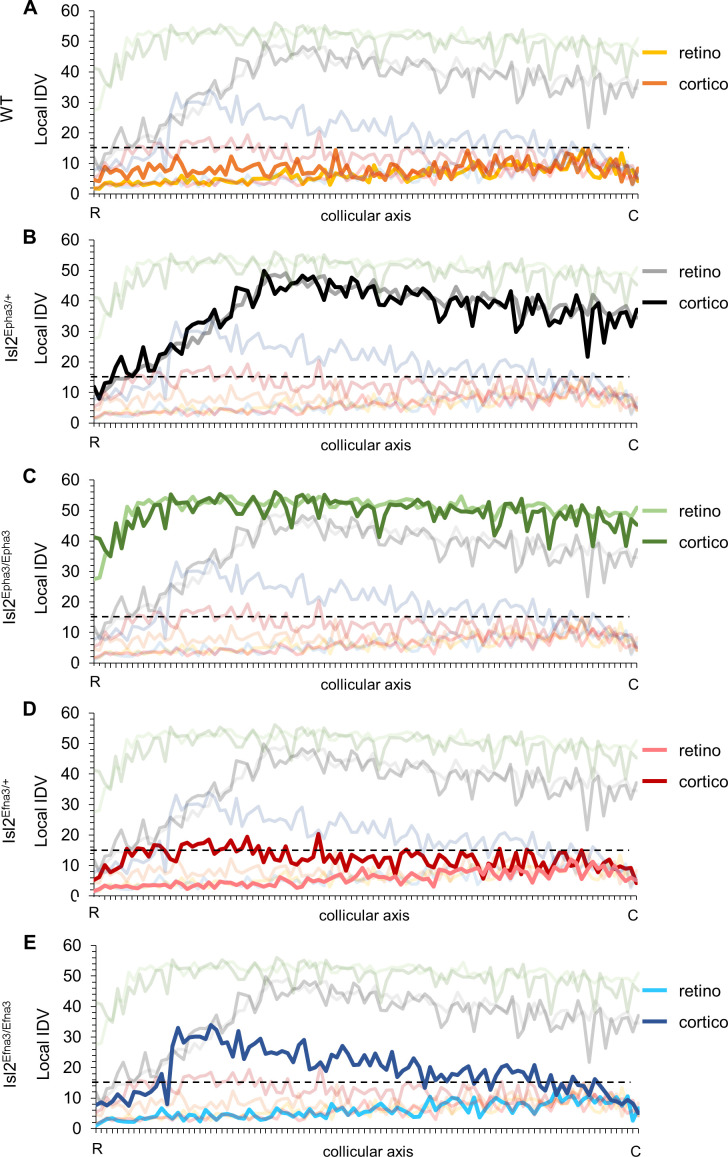
Figure 5. Local intrinsic dispersion variation (local IDV) in WT, Isl2-Epha3KI and Isl2-Efna3KI animal models.
(A, B, C, D, E) Representation of the local IDV values for both retinal (light colors) and cortical (dark colors) projections along the rostral R (0%) – caudal C (100%) axis of the SC in WT (A), Isl2Epha3/+ Isl2Epha3/+ (B), Isl2Epha3/Epha3 (C), Isl2Efna3/+ (D) and Isl2Efna3/Efna3 (E) animals (representative of n = 10 runs). Dashed line represents the threshold above which maps are duplicated. Abbreviations: IDV, intrinsic dispersion variation; WT, wild-type; R, rostral; C, caudal.

