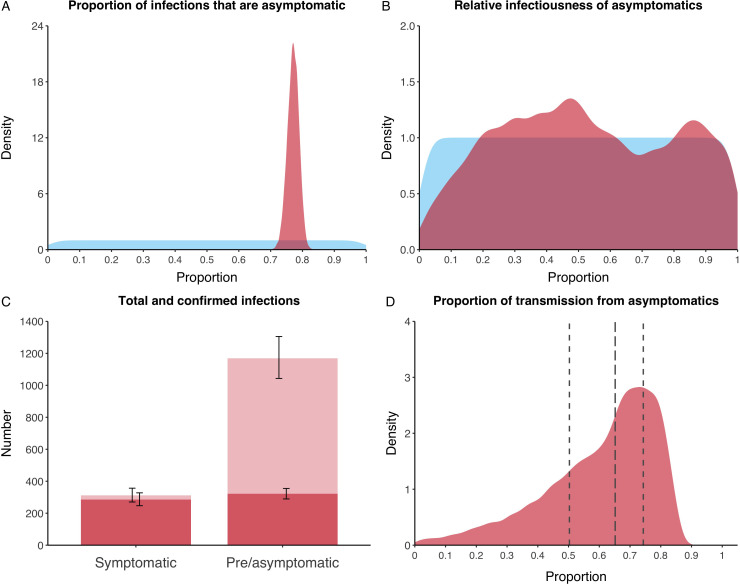
Appendix 2—figure 29. Proportion of infections that are asymptomatic and their contribution to transmission.
(A) Prior (blue) and posterior (red) probability distribution for the proportion progressing to asymptomatic infections. (B) Prior (blue) and posterior (red) probability distribution for the relative infectiousness of asymptomatic infections. (C) Number of pre- and asymptomatic infections and symptomatic cases detected (dark red) and not detected (light red) during the outbreak. Error bars indicate 95% posterior intervals. (D) Posterior probability distribution for proportion of transmission that is from asymptomatic individuals. Dashed and dotted lines show median and interquartile range respectively.

