

Abstract
The potassium channel Kv1.3, involved in several important pathologies, is the target of a family of psoralen-based drugs whose mechanism of action is not fully understood. Here we provide evidence for a physical interaction of the mitochondria-located Kv1.3 (mtKv1.3) and Complex I of the respiratory chain and show that this proximity underlies the death-inducing ability of psoralenic Kv1.3 inhibitors. The effects of PAP-1-MHEG (PAP-1, a Kv1.3 inhibitor, with six monomeric ethylene glycol units attached to the phenyl ring of PAP-1), a more soluble novel derivative of PAP-1 and of its various portions on mitochondrial physiology indicate that the psoralenic moiety of PAP-1 bound to mtKv1.3 facilitates the diversion of electrons from Complex I to molecular oxygen. The resulting massive production of toxic Reactive Oxygen Species leads to death of cancer cells expressing Kv1.3. In vivo, PAP-1-MHEG significantly decreased melanoma volume. In summary, PAP-1-MHEG offers insights into the mechanisms of cytotoxicity of this family of compounds and may represent a valuable clinical tool.
Keywords: Kv1.3 potassium channel, Psoralenic compounds, Mitochondria, Complex I, Reactive oxygen species, Melanoma
Graphical abstract
Highlights
-
•
The mitochondrial channel mitoKv1.3 is a promising pharmacological target.
-
•
MitoKv1.3 interacts with Complex I of the respiratory chain.
-
•
Psoralenic inhibitors of Kv1.3 facilitate the diversion of e− from complex I to O2.
-
•
A novel psoralenic Kv1.3 inhibitor with increased solubility reduces melanoma volume.
1. Introduction
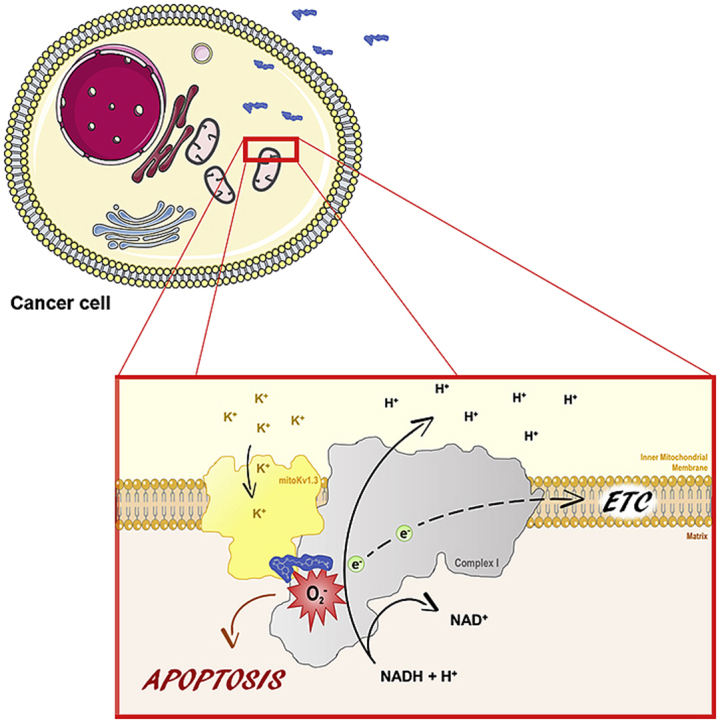
The voltage-dependent potassium channel Kv1.3 of the shaker family [1] displays a wide tissue expression with prevalence in the nervous and immune systems. Since alterations of function/expression of Kv1.3 have been related to several human pathologies, this channel is emerging as an important therapeutic target (e.g. Refs. [[40], [18], [37]]). In leukocytes, where the repertoire of K+ channels is limited, Kv1.3 fine-tunes the activation and proliferation of these cells and regulates the immune response [3,5], making Kv1.3 a good pharmacological target for autoimmune and chronic inflammatory diseases [6]. Moreover, Kv1.3 has been related to non-insulin-dependent type II diabetes mellitus, obesity and cancer, since it regulates insulin sensitivity, cell proliferation and apoptosis [2]. In particular, in the context of cancer and autoimmune diseases a drug acting on the plasmamembrane Kv1.3 is expected to exert beneficial effects by reducing proliferation of the pathological cells (see e.g. Ref. [7]). Importantly, Kv1.3 displays multiple localization within the cells [8], and mitochondria-targeted Kv1.3 inhibitors can trigger apoptosis of cancer cells by acting on the mitochondrial population of this channel (mtKv1.3) [9,10]. MtKv1.3 inhibition determines a transient hyperpolarization of the inner mitochondrial membrane (IMM), production of reactive oxygen species (ROS), induction of the permeability transition, consequent depolarization, release of cytochrome c and activation of caspases [11]. The production of ROS has been so far considered to be a consequence of the initial hyperpolarization and of the permeability transition. Cancer cells are particularly susceptible to oxidative stress because of the altered redox state they maintain [[45], [35], [22]].
While specific toxin inhibitors [15] such as Stichodactyla toxin (Shk) and Margatoxin (MgTx) (but see Ref. [16]) with high therapeutic potential are well known [17], much effort has been devoted to the identification of non-peptide small molecules that specifically inhibit Kv1.3. The toxins cannot penetrate cells, thus membrane-permeant drugs are needed if the target is the mitochondrial population of the channel. Currently, the most potent and selective membrane-permeant Kv1.3 inhibitor available is PAP-1 (5-(4-phenoxybutoxy)psoralen) [18] (Fig. 1a), a psoralenic compound, which blocks the channel with an IC50 of 2 nM and binds to the C-type inactivated state. PAP-1 is 23-fold more selective for Kv1.3 than for Kv1.5 and shows a 33- to 125-fold selectivity over other Kv1-family channels [18]. PAP-1 was shown to decrease proliferation of isolated effector memory T cells at 100 nM concentration18, to prevent type-1 diabetes development in autoimmune diabetes-prone rats (at 50 mg/kg daily for 70 days) [6], to suppress delayed-type hypersensitivity [18] and to act against psoriasis [19]. PAP-1 did not display any signs of acute toxicity in vitro or in vivo and does not exhibit phototoxicity [18]. Regarding the mechanism of action of PAP-1, Zimin and colleagues [20] used experimental and computational approaches – the latter based on the known structure of the Kv1.2 channel [21] – to identify a cooperative action by the two major parts of the molecule. The phenoxybutoxy side-chain of PAP-1 inserts into the lipophilic interphase between transmembrane segments S5 and S6 of the channel: lack of the phenyl ring seems to disrupt these hydrophobic interactions and prevents inhibition [22]. The coumarin moiety interacts instead with a second site, touching the P-loop and obstructing the channel conduit. Jorgensen and colleagues, using molecular dynamics simulations and, again, the structure of Kv1.2, have come to compatible conclusions and have also identified four other secondary sites to which PAP-1, or portions of it, bind significantly [23]. Two of these (Sites named I and III in Ref. [23]) are at polypeptide loops protruding from the membrane on opposite sides.
Fig. 1.

PAP-1-MHEG, a PAP-1 derivative with improved solubility, blocks cell proliferation and triggers apoptosis by inhibiting Kv1.3 in vitro and ex vivo in leukemia and melanoma cell lines. a) PAP-1 derivatives and their . chemical structures. b) Inhibitory effect of PAP-1 MHEG on three Kv channels expressed in CHO cells. Values are reported as means ± SEM (n = 4). c) Whole-cell Kv1.3 current traces recorded in a Jurkat lymphocyte. Currents were elicited by pulses to +70 mV (from a holding potential of −50 mV) before and after addition of PAP-1-MHEG. d) Growth curves of the cell proliferation assay. Human Jurkat leukemic T cells were chronically treated or not with the indicated concentrations of PAP-1 MHEG, and counted daily over a period of 4 days. Cells maintained in serum-free medium to block their proliferation were used as control. Values are reported as means of viable cells ± SEM (n = 3). e) Induction of apoptosis of B cells derived from CLL patients (n = 14) and from healthy donors (n = 5) by PAP-1 or PAP-1-MHEG, with or without CSH, after treatment for 24 h. 4 μM CSH was used as MDR inhibitor where indicated. Values are means ± SEM. f) Death of B-CLL cells co-cultured for 6 days with mesenchymal stromal cells (MSCs) to mimic the tumor microenvironment. Apoptosis was assessed by counting Annexin-V-positive cells by FACS. For all panels statistical significance (ANOVA or Student's t-test) was determined (* = p < 0.05; ** = p < 0.01; *** = p < 0.001). g) Jurkat cells were transfected with either control (scrambled) siRNA or siRNA against Kv1.3. Forty-eight hours after transfection, the cells were treated as indicated for 24 h in the presence of 4 μM CSH. Cell death was assessed by Annexin-V staining using flow cytometric analysis. Staurosporine (1 μM) was used as positive control. Data are shown as mean values of percentages of Annexin V-positive cells ± SEM (n = 3). h) Apoptotic cell death was assessed in Kv1.3-less K562 leukemic cells as in e). Percentages of apoptotic cells are plotted in the figure as means ± SEM (n = 3). i) Viability MTS assays were performed on melanoma B16F10 cells. Cells were treated or not with the indicated concentrations of PAP-1MHEG for 24 h in DMEM. Staurosporine was used as positive control of cell death. Data are reported as means of percentages ± SEM of MTS absorbance measured at 490 nm (absorbance of the untreated reference sample set as 100% in each set) (n = 8). j) Apoptosis of B16F10 cells treated with PAP-1+ CSH and PAP-1-MHEG (without CSH). k). Representative images showing apoptotic cell death after 24 h treatment of B16F10 cells as indicated. Quantification is shown on the right. Before treatment, cells were transfected with Alexa 555-labeled siRNA targeting Kv1.3 or control siRNA (scrambled). Apoptosis was assayed by Annexin-V-FITC binding using fluorescence microscopy (n = 4). Bars: 50 μm. l) Representative images of human primary skin fibroblasts treated with the indicated compounds for 24 h and then labeled with Annexin-V-Alexa568. Apoptotic cells were detected by fluorescence microscopy (n = 3). Bars: 75 μm.
PAP-1 is currently in phase Ib trial clinical trial against psoriasis but could be useful against other autoimmune diseases and tumors as well. However, an important shortcoming of this molecule is its low solubility in aqueous media. We therefore set out with the goal of improving this aspect by adding an ethyleneglycol chain to the molecule. Since our active principle is a “small” organic molecule (PAP-1), using relatively short methoxy-oligoethylene glycol (MOEG) chains to modify its properties seems preferable to attaching macromolecules. Our group has previously utilized MOEGs to form prodrugs of the natural polyphenol Resveratrol [24] endowed with enhanced water solubility and protection from first-pass metabolism after oral administration. The compounds could freely permeate biomembranes, thus suggesting that their psoralenic analogs might as well. In addition to improvements in handling and administration, we therefore expected the derivatives described in this paper to be able to reach a tumor mass more readily than the less soluble parent compounds, and to be furthermore capable of readily entering cells reaching the mitochondrial membrane to act on mtKv1.3.
2. Results
2.1. Design, synthesis and solubility of PEGylated PAP-1 (PAP-1-MHEG)
For the above-mentioned reasons, we limited the length of the chain to six (or four) monomeric ethylene glycol units and attached it to the distal phenyl ring of PAP-1 (Fig. 1a). The synthesis of PAP-1-MHEG (IUPAC name: 4-(4-(4-(2,5,8,11,14,17-hexaoxanonadecan-19-yloxy)phenoxy)butoxy)-7H-furo[3,2-g]chromen-7-one) and of the other compounds used is described in the Materials and Methods section. As control for our experiments, we used either PAP-1, or PAP-OH (IUPAC name: 4-(4-(4-hydroxyphenoxy)butoxy)-7H-furo[3,2-g]benzopiren-7-one), the major active metabolite of PAP-1 forming in vivo [22]. PAP-1 is insoluble in water, while it can reach a concentration of 140 mM in pure DMSO. For PAP-OH we measured a low solubility of 0.6 ± 0.1 μM in aqueous solution (DMEM), while that of PAP-1-MHEG increased to 30 ± 3 μM i.e. 50-fold. Similar values were obtained in PBS+0.1% DMSO, the condition used for administration of the drugs in vitro and in vivo.
2.2. Inhibition of Kv1.3 activity by PAP-1-MHEG
Given the steric hindrance of the MHEG moiety, we first tested in patch clamp experiments whether PAP-1-MHEG is still able to inhibit Kv1.3 activity and whether it maintains a certain selectivity towards Kv1.3 over Kv1.1 and Kv1.5 (Fig. 1b). Channel activity was assessed for these Kv members stably expressed in mammalian chinese hamster ovary (CHO) cells. EC50 values determined using the peak currents at + 50 mV in the whole-cell configuration were 5.5 ± 0.1 μM for Kv1.1, 0.35 ± 0.03 μM for Kv1.3 and 1.1 ± 0.1 μM for Kv1.5. Thus, the EC50 values for Kv1.1 and for Kv1.5 were 16- and 3.2-fold higher, respectively, than for Kv1.3. We also confirmed that PAP-1-MHEG inhibits Kv1.3 in Jurkat cells, where Kv1.3 is the only voltage-gated potassium channel expressed (Fig. 1c). Altogether these data suggest that the chemical modification increases solubility, and although decreases affinity for the channel (which still remains in the sub-μM range) it maintains some degree of selectivity towards Kv1.3.
2.3. In vitro effects of PAP-1-MHEG on cell proliferation and survival
We then tested whether PAP-1-MHEG was able to reduce cell proliferation, as previously shown to occur for PAP-1 [25], in leukemic Jurkat T lymphocytes (Fig. 1d). A clear dose-dependent decrease in total cell number per well was observed after 4 days of incubation with PAP-1-MHEG. Given the strong reduction in cell number, we studied a potential effect of this molecule on cell survival, and found that at higher concentrations the compound was able to induce apoptosis within 24 h, even more efficiently than PAP-1 and even in the absence of Cyclosporin H (CSH), an inhibitor of the multidrug-resistance pumps (MDRi) (PAP-1 has to be co-administered with CSH in order to trigger cell death [9]). Annexin V binding-based apoptosis assays were performed after the cells had been incubated for 24 h with the indicated concentrations of PAP-1 and its derivative PAP-1-MHEG. Given the high expression of Kv1.3 in B-CLL cancer cells [26], we first tested PAP-1-MHEG-induced cell death in primary pathological cells from patients, as well as in B lymphocytes from healthy subjects. Fig. 1e shows that 10 μM PAP-1-MHEG induced death of almost 60% of the pathological cells, while healthy B cells were resistant even to 20 μM PAP-1-MHEG. In addition, the apoptosis-inducing effect of 20 μM PAP-1-MHEG applied alone (without MDR inhibitors) remained over 60% when B-CLL cells were co-cultured with mesenchymal stromal cells (Fig. 1f), known to mimic the tumor microenvironment and exert anti-apoptotic effects [27]. In contrast, 20 μM PAP-1 even together with CSH induced apoptosis in only 40% of the pathological cells under the same condition. To prove specificity of action, we performed experiments using Jurkat cells in which Kv1.3 expression was abolished using siRNA-technology as previously described [11] (Fig. 1g), and K562 leukemic B cells endogenously lacking Kv1.3 [28] (Fig. 1h). In both systems, the absence of Kv1.3 prevented the apoptosis-inducing effect of PAP-1-MHEG. Further, the studies with these cells confirmed the dependence of staurosporine-induced death on the expression of Kv1.3 in these cells [11]. The above results were confirmed also in B16F10 melanoma cells (Fig. 1i–k) which have a high expression of Kv1.3 [9]. PAP-1-MHEG was twice more efficient in inducing apoptosis as PAP-1 (Fig. 1j) and apoptosis occurred in a Kv1.3 expression-dependent manner (Fig. 1 k). Very importantly, the drugs did not have pro-apoptotic effects on healthy human primary fibroblasts (Fig. 1l) and healthy B lymphocytes (Fig. 1e). In summary, these results show that in the absence of Kv1.3 PAP-1 and PAP-1-MHEG have little effect under all conditions tested, indicating that these drugs induce cell death via Kv1.3. PAP-1-MHEG was able to trigger apoptosis more efficiently than PAP-1 in different cell types showing high expression of Kv1.3, even in the absence of CSH and in the presence of mesenchymal stromal cells.
2.4. Molecular mechanism of apoptosis induced by PAP-1-MHEG
We have previously characterized the physiological effects of the inhibition of mtKv1.3 either by Bax [11] or by PAP-1, Psora-4 and clofazimine, three high-affinity inhibitors of Kv1.3 [9,29], as well as by two mitochondriotropic inhibitors in which a positively charged triphenylphosphonium was linked to PAP-1 [10]. Thus, we checked whether similarly to these compounds, PAP-1-MHEG triggered ROS release and loss of mitochondrial membrane potential to induce apoptosis. As expected, in both melanoma cells (2a, 2b) and in ex vivo B cells from CLL patients (2c, 2d) we observed mitochondrial depolarization that correlated with ROS release. However, in contrast to the effects of PAP-1 and the mitochondriotropic drugs (PAPTP and PCARBTP), PAP-1-MHEG drastically reduced basal respiration in intact cells in a dose-dependent manner (EC50 8.0 ± 3.4 μM), as assessed by extracellular flux analyser (Fig. 2e). This reduction was paralleled by a decrease in mitochondrial ATP content (as measured in the presence of the glycolysis inhibitor 2-deoxyglucose, 2-DG), again in a dose-dependent manner (Fig. 2f). We have recently reported that a decrease in ATP synthesis at the level of mitochondria reduced Wnt signalling via downregulation of SERCA activity followed by ER stress [30]. Accordingly, PAP-1-MHEG reduced Wnt signalling (Fig. 2g), further confirming the general idea that mitochondrial fitness regulates cell proliferation also by acting on Wnt signalling.
Fig. 2.

PAP-1-MHEG acts on mitochondria, affecting energetic homeostasis. a) Dissipation of the mitochondrial membrane potential as reported by TMR fluorescence. Representative images (n = 3 separate experiments) of B16F10 cells. FCCP was used as positive control. b) Mitochondrial ROS production as reported by the development of MitoSOX fluorescence. Representative images (n = 3 separate experiments). Antimycin A was used as positive control. c-d) as in a and b, B-CLL cells. The plots show averages ± SEM (n ≥ 3 separate experiments). e) Effect of PAP-1-MHEG on the Oxygen Consumption Rate (OCR) of B16F10 cells. Values were normalized with respect to basal respiration recorded before compound addition. Mean values ± SEM from six experiments are shown. f) ATP content of B16F10 cells after the addition of the indicated compounds. Medium glucose was replaced with 2-deoxyglucose (2DG) to inhibit glycolysis. Oligomycin was used as positive control. Values are reported as percentage of luciferase signal with respect to the untreated sample (“ref”). Data are presented as means ± SEM (n = 5). g) Canonical Wnt signaling activity based on TCF-LEF-dependent transcription was assayed in HEK293 cells. Wnt signaling was enhanced using 3 μM CHIR99021 (CHIR). Cells were then treated for 8 h with 0.1% DMSO, as negative control, or with PAP-1-MHEG as indicated in the figure. The luciferase signal was normalized with respect to the signal given by β-gal, which was co-transfected using the TOPflash plasmid. The values are reported as the percentage of luciferase signal with respect to the negative control (“ref”). Values are means ± SEM (n = 5). h) Activity of respiratory chain complex I, III, and V was assessed in vitro in isolated mouse liver mitochondria upon addition of PAP-1-MHEG. DMSO was used as negative control. Means ± SEM of 5 independent experiments are shown and data are expressed as percentage of the DMSO-treated samples. i) Respiratory chain complex I activity was measured as in h. Where indicated, isolated mitochondria were pre-incubated with the peptide toxin MgTx, to block the Kv1.3 channel before the addition of PAP-1-MHEG. Means ± SEM of 3 independent experiments are shown and data are expressed as percentage of the DMSO-treated samples. For all the panels statistical significance (ANOVA or Student's t-test) was determined (* = p < 0.05; ** = p < 0.01; *** = p < 0.001).
Given the strong reduction in respiration and in ATP content, we checked for possible effects of PAP-1-MHEG on respiratory chain complexes. In contrast to PAP-1 and PAPTP [10], PAP-1-MHEG caused a strong, dose-dependent inhibition of complex I (Fig. 2h), possibly contributing to the reduction in ATP content that may take place also because of the strong depolarization due to the opening of the permeability transition pore. Complex III and V activities were unaffected even at 20 μM PAP-1-MHEG. These data, along with data showing specificity of action via Kv1.3 (Fig. 1j and k), altogether suggested that complex I activity might be blocked in conjunction with mtKv1.3 inhibition by PAP-1-MHEG. To obtain experimental evidence in favour of this hypothesis, the mitochondrial fractions used to measure complex I activity were pre-incubated with Margatoxin (MgTx), which by itself did not have any effect on complex I activity. Following pre-incubation of the mitochondrial fraction from mouse liver with MgTx, the effect of PAP-1-MHEG on complex I was significantly reduced (Fig. 2i). The hypothesis emerging from these experiments is that physical vicinity of the channel with complex I may be necessary for inhibition of the latter by PAP-1-MHEG. The drug might, e.g., insert at an interaction surface between mtKv1.3 and Complex I.
2.5. Dissection of the molecular action of PAP-1-MHEG moieties on Kv1.3 channel activity, complex I function and cell survival
To better understand the pharmacology of PAP-1-MHEG, we examined the effect of the individual domains of the molecule on Kv1.3 and on complex I activity. To this end, we tested the compounds shown in Fig. 3a, namely 1) PAP-1, the “parent” compound (Fig. 1a); 2) the psoralenic ring system (5-MOP, 5-methoxypsoralen); 3) PAP-1-MHEG minus the psoralenic ring system (POP-MHEG); 4) the methoxy-hexaethylene glycol chain (MHEG); 5) in addition, we synthesized also the mitochondriotropic version of MHEG (MHEG-TPP) by adding a triphenylphosphonium to promote its accumulation in mitochondria. In order to understand whether the precise length of the MOEG chain was relevant for the observed effects, we synthesized PAP-1-MTEG, the analog of PAP-1-MHEG with four ethylene glycol units (see Materials and Methods).
Fig. 3.

PAP-1-MHEG induces apoptosis and inhibits respiratory chain complex I. a) Chemical structures of the molecules synthesized and characterized in the present study. b) Whole-cell patch clamp experiments were performed on Jurkat cells. Kv1.3 potassium currents were measured before and after the addition of 1 μM of each indicated compound. Means ± SEM of three independent experiments are shown. c) Viability MTS assays in B16F10 cells. Values are means ± SEM with respect to the untreated sample (n = 4). d) Apoptosis of B16F10 cells assayed using Annexin-V. Cells were treated or not with 20 μM of the indicated compounds for 24 h. 2 μM staurosporine was used as positive control. Shown are the means ± SEM of percentages of Annexin-V-positive cells with respect to control (untreated) (n = 4). e-f) OCR was measured in B16F10 cells. As in e, all compounds were tested at 20 μM. Panel f plots OCR values upon addition of POP-MHEG at different concentrations. Values were normalized with respect to basal respiration recorded before addition of each compound. Mean values ± SEM from 5 experiments are shown. g) Quantitative analysis of OCR values (n = 5). h-j)Activity of respiratory chain complex I (h) was measured in vitro in isolated mouse liver mitochondria after the addition of the indicated compounds at 20 μM. DMSO (0.1%) was used as negative control. Mean ± SEM of 3–5 independent experiments are shown and data are expressed as percentage of the control. See also Supplementary Fig. 1a-c. i) Dose-dependent effects of PAP-1 MTEG on complex I activity, measured as in 3h. Values are expressed as means of percentages of controls (0.1% DMSO) ± SEM (n = 7). j) Isolated mitochondria were pre-incubated or not with the peptidic toxin MgTx (500 nM), to block mtKv1.3 before the addition of POP-MHEG. Respiratory chain complex I activity was then measured. Means ± SEM of 3 independent experiments are shown. The data are expressed as percentage of controls (0.1% DMSO).
First, the effect of different molecules on Kv1.3 channel activity was tested by patch clamping Jurkat lymphocytes (Fig. 1b and Table 1). In each experiment, the remaining current was blocked by PAP-1, confirming that the current was due to Kv1.3. The channel has been shown to be completely inhibited by 100 nM PAP-1 [18], in contrast to 5-MOP that was reported to inhibit Kv1.3 with and EC50 of 100 μM [18,31]. MHEG and MHEG-TPP did not inhibit Kv1.3 at all (Fig. 3b and not shown), while POP-MHEG reduced Kv1.3 current by approximately 70% at 1 μM concentration. These data indicate that the phenoxyalkyl ring in PAP-1 is sufficient to inhibit the channel, although with relatively low affinity. The findings are in broad agreement with the proposed mechanism of action of PAP-1 (see introduction).
Table 1.
Cellular effects of the various compounds used in this study. The indicated signs correspond to the following changes with respect to the untreated samples: (−) 0–15% effect; (+) 15–30% effect; (++) 30–50% effect; (+++) 50–100% effect.
| Kv1.3 inhibition | Cell death | Respiration |
ROS production | IMM depolarization | ||
|---|---|---|---|---|---|---|
| Decrease in basal respiration | Complex I inhibition | |||||
| +++ | ++ | + | + | +++ | ++ | |
| – | – | – | – | n.d. | n.d. | |
| +++ | +++ | +++ | +++ | +++ | +++ | |
| +++ | – | +++ | +++ | + | + | |
| – | – | + | – | + | – | |
| – | – | – | – | – | – | |
PAP-1-MHEG and PAP-1-MTEG exerted a dose-dependent effect on the readout of the MTT assay (Fig. 3c) and induced apoptosis (Fig. 3d) in B16F10 cells (see also Table 1). Since in intact cells in general a higher concentration of drug is needed to exert a biological effect than in patch clamp experiments (eg. Ref. [5,18]), we applied formally 20 μM concentrations (Fig. 3d). 5-MOP, that does not inhibit the channel, did not induce significant apoptosis. Our data are in agreement with a recent report showing that 5-MOP at 50 μM after 48 h decreases cell viability of A549 cells by 20% [32]. .Even though POP-MHEG inhibited the channel, it did not reduce cell viability and induce apoptosis to a significant extent, while PAP-1-MHEG and PAP-1-MTEG were very effective (Fig. 3c and d).
To understand whether the cell viability decrease and induction of cell death was related to the ability of the above compounds to inhibit respiration, the drugs were tested on intact cells (Fig. 3e). While PAP-1-MHEG and PAP-1-MTEG caused a drastic reduction of respiration (Fig. 3e), the other drugs did not trigger significant changes. Exception to this was POP-MHEG, that caused a dose-dependent decrease of respiration (Fig. 3f). In particular, all three molecules drastically reduced stimulated respiration, ATP-linked and maximal respiration as well as reserve capacity (Fig. 3g). Interaction of these molecules with complex I, III and V was then tested on isolated mitochondrial fractions, revealing that in accordance with the observed reduced respiration, PAP-1-MHEG, PAP-1-MTEG and POP-MHEG decreased complex I function (EC50 for PAP1 MHEG: 6.0 ± 2.5 μM; PAP-1-MTEG: 10.2 ± 3.1 μM; EC50 for POP-MHEG: 8.9 ± 2.6 μM) (Fig. 2, Fig. 3h and Supplementary Figure 1a). Complex III and V were unaffected (Supplementary Fig. 1b and 1c). These results suggest that the oligoethyleneglycol side-chain is a key element for inhibition of complex I. To further confirm this hypothesis, we synthesized, as a control, PAP-1-MHEG without the psoralenic ring system and the methoxy-hexaethylene glycol chain (POP–OMe) that indeed had no inhibitory effect on complex I and on respiration and did not affect cell survival (Supplementary Fig. 1c and d). On the other hand, no strict correlation seems to exist between the ability of these agents to block complex I (and respiration) and cell death since POP-MHEG, which blocked respiration and complex I as well as the channel, had little effect on cell survival (Table 1). It is interesting to note that, similarly to PAP-1-MHEG, the effect of POP-MHEG on complex I was mediated by its action on Kv1.3, as shown by the rescue with MgTx (Fig. 3j).
We then asked the reason for the different effects of PAP-1-MHEG and POP-MHEG on cell death, even though they both inhibit complex I very efficiently. First, we assessed whether inhibition of complex I is sufficient to reduce cell viability in B16F10 cells. 100 nM rotenone, a classical complex I inhibitor completely abolished mitochondrial ATP synthesis measured in cells where glycolysis was inhibited by 2-DG (Fig. 4a) but the same concentration did not significantly reduce cell survival in the absence of 2-DG (Fig. 4b). Thus, inhibition of complex I itself is not sufficient to trigger cell death. Second, we measured ROS release upon incubation of the cells with the above-mentioned molecules using Mitosox fluorescence as readout (Fig. 4c and Supplementary Fig. 1f), revealing that PAP-1-MHEG increases the Mitosox signal twice as much as POP-MHEG (over 40 min) and as Rotenone (Supplementary Fig. 1g), while 5-MOP and MHEG-TPP have only modest effects (Fig. 4d). Please note that the difference between PAP-1-MHEG and POP-MHEG consists in the absence of the coumarinic ring in the latter. These experiments thus indicate that this domain in PAP-1 actively contributes to production of reactive oxygen species. Finally, changes of mitochondrial membrane potential were assessed following administration of our drugs. PAP-1-MHEG was the only molecule that caused a rapid and complete depolarization (Fig. 4e and f and Supplementary Figure 1h), while POP-MHEG induced only a partial loss of membrane potential, even though it inhibited respiration. Inhibition of respiration itself does not need to be accompanied by depolarization as the ATPase hydrolyzing ATP produced by glycolysis can maintain the membrane potential.
Fig. 4.

PAP-1-MHEG-derived small molecules as tool to study the possible interactions between mtKv1.3 and respiratory chain complex I. a) 100 nM Rotenone abolishes mitochondrial ATP production. ATP content was measured as in Fig. 2f. (n = 3). b) 100 nM Rotenone does not affect MTS readout in B16F10 cells (n = 3). Experiments were performed by incubating the cells for 24 h in the presence of the indicated concentrations of rotenone. 2-DG was not included in this experiment, as block of both glycolysis and of the respiration caused cell death after 24 h (the ATP level was measured after 6 h). c) Mitosox signal as a function of time (n = 3). All molecules were applied at 20 μM concentration. See also supplementary Fig. 1f. d) Quantification of experiments shown in Fig. 3c. Antimycin A concentration was 2 μM. e) TMRM signal as a function of time (n = 3). All molecules were applied at 20 μM concentration. See also Supplementary Fig. 1g. f) Quantification of experiments shown in Fig. 3e. Where indicated, in all panels, statistical significance (ANOVA or Student's t-test) was determined (* = p < 0.05; ** = p < 0.01; *** = p < 0.001). g) HEK 293 cells were transfected with HA-YFP-Kv1.3 (expected molecular weight: 90 kDa). Upper panel: Total cell lysates (input: starting material) were subjected to HA immunoprecipitation (IP+). IP-, absence of anti-HA antibody. Samples were immunoblotted against different proteins as indicated. Lower panel: as above, but starting material (input) was immunoprecipitated with Complex I Immunocapture beads (IP+). IP- agarose beads only. The precipitates were blotted with the indicated antibodies. In both panels 20 μg of input and 20 μl of the IP + or IP- samples have been loaded.
The above experiments further suggest that the active molecules somehow bridge Kv1.3 to complex I, and this can occur only if the two proteins/complexes are physically associated. To test this idea, we performed co-immunoprecipitation (Fig. 4g) showing that Kv1.3 and complex I can indeed interact. In particular, mitochondria isolated from HEK293 cells expressing HA-tagged Kv1.3 was pulled down and tested for the presence of the complex I subunit NDUFS1 and vice-versa, mitochondria expressing HA-tagged Kv1.3 was immunoprecipitated with complex I components and blotted with anti-HA antibody to reveal the presence of Kv1.3 (Fig. 4g). Interaction between complex I components and mitoKv1.3 was further indicated by Western blot of non-denaturing BN-PAGE-separated proteins from mouse liver mitochondria. Migration of Kv1.3 and NDUFA9, a complex I subunit, took place in the same complex (Supplementary Figure 1i). In addition, a BN-PAGE followed by SDS-PAGE as second dimension and Western blot, performed on mitochondria isolated from B16F10 cells (Supplementary Figure 1j), further confirmed our hypothesis, as Kv1.3 and NDUFS3 migrated with the expected molecular weight in the same complex.
2.6. In vivo effects of PAP-1-MHEG
Given our observation that PAP-1-MHEG is able to decrease proliferation and induce apoptosis of cancer cells, we tested this drug in vivo in an orthotopic melanoma mouse tumor model, to provide a proof of principle experiment demonstrating the usefulness of PAP-1-MHEG against a malignant tumor. First, the pharmacokinetic profile of PAP-1-MHEG was assessed by HPLC analysis in various tissues following intraperitoneal injection of 10 nmol/gbw drug into the mice. Interestingly, in contrast to PAPTP and PAP-OH [10], and similarly to PAP-1 [6], PAP-1-MHEG was found to cross the blood brain barrier. However, after 120 min, the drug was almost completely cleared from the tissues (Fig. 5a). Thus, the pharmacokinetic profile of PAP-1-MHEG was satisfactory and prompted us to test its effect in vivo on tumor development. Before injecting B16F10 cells into the animals, we tested the sensitivity of the cells to PAP-1-MHEG applied together with the multidrug resistance pump (MDR) inhibitors cyclosporine H (CSH) or clofazimine in order to decrease eventual export of PAP-1-MHEG from the cells by MDR. Clofazimine is used in the clinic and does not show side effects [33] (Fig. 5b). A very low concentration of either drug improved the effect of PAP-1-MHEG in vitro by approximately 25% (Fig. 5b), therefore PAP-1-MHEG was injected together with a low dose of clofazimine (2 nmol/g, that is not effective alone in reducing tumor volume (Supplementary Figure 2a), into the mice. PAP-1-MHEG (10 nmol/gbw) was injected intraperitoneally on days 5, 7, 9, and 11 after tumor cell inoculation. This treatment caused a more than 50% reduction of the tumor volume assessed on day 16, in contrast to PAP-1, even though the latter was administered at a two-fold higher dosage (Fig. 5c). PAP-1-MHEG (10 nmol/gbw) exerted a slightly smaller effect when injected alone, without clofazimine (Supplementary Figure 2a). Similarly to PAPTP, PAP-1-MHEG did not significantly alter the total number of cells in the blood (Fig. 5d) or the immune equilibrium in the thymus, spleen, inguinal lymph node and blood (Fig. 5e). Also, the treatment did not cause histological alterations in healthy tissues (Supplementary Figure 2b).
Fig. 5.

PAP-1-MHEG reduces melanoma tumor volume in vivo without affecting healthy tissues. a) PAP-1 MHEG was measured in the indicated organs 30, 60 and 120 min after intraperitoneal injection (n = 3, means + SEM). b) MTS assays on B16F10 cells. Cells were treated with PAP-1-MHEG alone or in combination with two MDRis: CSH at 4 μM, and clofazimine at the non toxic by itself dosage of 0.5 μM. Values are means ± SEM with respect to the untreated sample labeled as “ref” (n = 4). Evaluation of statistical significance (one-way ANOVA) was performed (* = p < 0.05; ** = p < 0.01; *** = p < 0.001). c) Tumor volume in mice treated with PAP-1 (20 nmol/gbw) (n = 3), or PAP-1-MHEG (10 nmol/gbw) + clofazimine (2 nmol/gbw) (n = 10) or with DMSO as control (untreated mice, n = 16). Statistical significance was assessed using Student's t-test (*** = p < 0.001). Tumors were removed 16 days after inoculation. See also Supplementary Fig. 2a. d) Total blood cell count at the end of the experiment shown in Fig. 5c. e) Different immune cell subpopulations were identified by flow cytometry using antibodies against the indicated marker antigens (mean ± SD, n = 3 each). PAP-1-MHEG treatment does not alter the immune cell sub-populations within the tumor. Samples were stained for the following sub-populations of immune cells: T helper (CD3, CD4) or cytotoxic T cells (CD3, CD8), B cells (CD19, MHCII), Treg (CD4, CD25, FoxP3), M1/M2 macrophages (CD11b, F4/80, CD204), neutrophils (CD11b, CD11c, Ly6G). The different cell subpopulations were quantified by FACS analysis. The means ± S.D. of four independent studies are reported. Results are shown as percentage of the different populations in relation to the mean value of the untreated in thymus, inguinal lymph node (iLN), blood and spleen. See also Supplementary Fig. 2b. f) Cartoon of the interaction between mtKv1.3 and Complex I. Please note the possible physical vicinity of the Q module of complex I (in grey, PDB 5LDW) to the predicted binding site III on the Kv channel (in yellow, PDB 2A79) for PAP-1.
3. Discussion
In the present study we describe the synthesis and characterization of a new Kv1.3 inhibitor with significantly increased solubility compared to PAP-1. The peculiar characteristic of this soluble derivative, namely its ability to block activity of complex I of the respiratory chain, prompted us to investigate whether this feature might be due to a physical vicinity of mtKv1.3 to complex I. We provide multiple lines of evidence in favour of this hypothesis, both using classical biochemical techniques and by dissecting the molecular action of individual domains of PAP-1-MHEG on channel inhibition, cell death and bioenergetic parameters. In particular, by investigating the effects of these molecules on mitochondrial membrane potential, ROS production, respiration and complex I activity, we propose a novel paradigm regarding the mechanism of action of PAP-1 on cell survival: our data suggest that the psoralenic moiety of PAP-1 allows redox cycling that is necessary for sustained ROS production and induction of death. Since 5-MOP itself (that does not efficiently block Kv1.3) does not induce significant generation of ROS, apparently the redox-active structures in PAP-1 and likely also in the mitochondrial derivatives PAPTP and PCARBTP must be appropriately positioned close to complex I, through binding to mtKv1.3. As shown by POP-MHEG, mtKv1.3 inhibition does trigger ROS production by itself, confirming our previous conclusion, but the level of oxidative stress seems not to be sufficient alone to induce complete depolarization (likely due to PTP opening) and cell death. Our data indicate that interaction between mtKv1.3 and complex I crucially aids the diversion of unpaired electrons from complex I to molecular oxygen via the coumarinic ring of PAP-1 to boost further ROS production (Fig. 5f). Although the exact sites of PAP-1-MHEG binding to mtKv1.3 and to Complex I remain to be determined, a few considerations can be made based on studies dealing with the binding of Psora-4 (PAP-1 is a Psora-4 derivative) to Kv channels [34] and of PAP-1 to Kv1.2 [20,23]. In particular, in addition to the side-pocket site and the inner pore sites, Jorgensen and colleagues identified other probable PAP-1 binding sites in Kv1.2 (a channel with high homology to Kv1.3), site III being located on the cytoplasmic domain while site I on the extracellular domain. In molecular dynamics simulations, occupancy of site III was observed for both the psoralen ring system and the phenoxy branch, while site I only interacted with psoralen. It is possible therefore that a PAP-1-MHEG molecule bound to site III interacts with the recently characterized electron transfer-catalyzing components of complex I [35,36]. According to previous studies [11], mtKv1.3 is oriented in the IMM with site I and III facing the intermembrane space and the matrix, respectively. The Q module of complex I in which ubiquinone reduction takes place contains the 49-kDa (NDUFS2), 30-kDa (NDUFS3), PSST (NDUFS7) and TYKYI (NDUFS8) subunits and is located, similarly to NDUFS1, in the protruding arm of complex I facing the mitochondrial matrix. Please note that in our experiments NDUFS3 co-migrates with Kv1.3 at least in part and NDUFS1 co-immunoprecipitates with the channel. However, the actual interaction surface between Kv1.3 and the respiratory chain complex remains to be determined. Fig. 5f shows a hypothetical arrangement. Since Complex I activity is blocked by the methoxy-oligoethylene glycol (MOEG) domain of PAP-1-MHEG, one plausible explanation is that the MOEG moiety interferes with electron transport and the redox cycle of ubiquinone that is a stepwise process proceeding via semiquinone. This interaction in turn would aid the diversion of unpaired electrons from complex I to molecular oxygen via the coumarinic ring system of PAP-1. Indeed, coumarins and their derivatives can undergo a one-electron reduction to form a radical–anion intermediate and are characterized by a more negative standard electrochemical potential than O2 (e.g. Ref. [37]). Our data suggest that the coumarinic ring can exert such a function in PAP-1 and in the mitochondriotropic derivatives PAPTP and PCARBTP (the latter releases PAP-OH at the site of action, i.e. mitochondria) as well, since in all these cases the molecules are tightly bound to the channel that is adjacent to complex I. Please note that the mitochondriotropic MHEG-TPP does not block complex I activity, suggesting that a correct positioning of the MHEG moiety in PAP-1-MHEG, bound to mtKv1.3, is necessary for complex I activity block to occur. Furthermore, even 20 μM MHEG-TPP did not induce depolarization or affect ROS production and respiration, indicating that the TPP+ moiety itself is likely not responsible for the toxic effect of mitochondriotropic drugs in general, including the mtKv1.3 inhibitors PAPTP and PCARBTP. It has been reported that alkyl-TPP compounds can affect mitochondrial proton leak and respiration in a manner dependent on alkyl chain length: heptyl-TPP was effective, while propyl-TPP was not [38]. In our case even 20 μM MHEG-TPP was without effect. Since PAP-1 modified with the MHEG domain reaches mitochondria and TPP+ is known to accumulate in this organelle, the lack of effects of MHEG-TPP probably cannot be ascribed to a lack of targeting of the molecule to mitochondria.
Coupling to a respiratory chain complex (Complex IV) has been reported also for the mitochondrial counterpart of the calcium-dependent potassium channel KCa1.1 [39]. In addition, complex II (succinate dehydrogenase) is proposed to interact with and regulate the mitochondrial ATP-dependent K+ channel [40] whose molecular identity has been defined only recently [41]. Such functional coupling has been suggested to constitute localized signalling loops within the IMM, but molecular details remain to be clarified. Interaction of mtKv1.3 with Complex I is also expected to have a functional role, possibly modulating respiration and all events downstream of respiration. A logical extension of these experiments would be to assess by mass spectrometry (MS) the composition of the bands giving rise to immunoreactivity in native gels, however channel proteins in general are very difficult to reveal by MS due to their very low abundance and high hydrophobicity (e.g. Ref. [42]).
Our work also provides further evidence, given the ability of POP-MHEG to block the channel, that inhibition of Kv1.3 is mainly associated with the alkyl-O-phenyl portion of the molecules, in agreement with the conclusions by Zimin et al. [20] and Jorgensen et al [23]. However, the presence of the MOEG moiety linked to this part of the molecule decreased the affinity of PAP-1-MHEG towards Kv1.3. This is not surprising, as modification of the structure of PAP-1 has previously been shown to affect its activity. For example, para-substituted PAP-OH inhibits Kv1.3 with an EC50 of 7 nM, while the meta-substituted derivative has an EC50 of 140 nM [22]. In addition, introduction of the MOEG moiety almost completely abolished the ability of PAP-1 to discriminate between Kv1.3 and Kv1.5, while it still allowed some selectivity towards Kv1.1. This behaviour resembles that of Psora-4, the original starting point for the synthesis of PAP-1 [18]. The selectivity of PAP-1 for Kv1.3 over other Kv1 channels has been attributed to its preferential affinity for the C-type inactivated state, since removal of C-type inactivation abolished the ability of PAP-1 to distinguish between Kv1.3 and Kv1.5 and decreased PAP-1 potency [20]. While molecular details of this selective action of PAP-1 are not fully known, the possibility that the MOEG moiety may interfere with binding of PAP-1 to the C-type inactivated state cannot be excluded. Since mitochondrial Kv1.1 [11] and Kv1.5 [43] are also able to mediate apoptosis, PAP-1-MHEG might be exploited for cancers where Kv1.5 is highly overexpressed [44].
Our work shows that the action of the drug on the mitochondrial Kv1.3 channel is the main determinant of its effect on cell survival, as indicated by the results obtained in cells not expressing Kv1.3 or with reduced expression of Kv1.3 due to transfection with siRNA. An inspection of Table 1 indicates that mitochondrial depolarization is a key event associated with cell death induced by PAP-1 and derivatives. We have previously shown that depolarization is precipitated by activation of the permeability transition pore [9]; whose opening is triggered by strong oxidative stress (e.g. Ref. [45]). POP-MHEG did not trigger massive production of ROS (since it does not have the psoralenic moiety), and therefore it also did not cause a drastic loss of membrane potential, which is due to the ROS-elicited permeability transition. Thus, using POP-MHEG, we were able to modulate ROS release, while still inhibiting mtKv1.3, confirming that indeed the onset of the PT is a function of the intensity of oxidative stress (see Table 1). The data furthermore indicate that the coumarinic ring of PAP-1 and of its derivatives is acting as a “ROS-generator”. In turn, ROS production might further inhibit Kv1.3 [46,47]. It is worthwhile to mention that PAP-1-MHEG and POP-MHEG might be exploited to trigger complete or partial depolarization and differential ROS production in other contexts as well, for example in the induction of mitophagy, often activated with uncouplers (e.g. Ref. [48]).
The ability of PAP-1 to induce death of cancer cells even in vivo was significantly enhanced by turning it into PAP-1-MHEG. As expected, the presence of an oligomeric ethylene glycol chain increases solubility, improves pharmacokinetics and does not prevent cell entry. Thus, PAP-1-MHEG can reach in situ mitochondria, although it is not designed to concentrate there, in contrast to PAPTP. This difference might well account for the lower effect of the soluble variant of PAP-1 compared to PAPTP [10]. Nonetheless, its effect was restricted to pathological cells and did not cause appreciable side effects, likely due to the same reasons proposed for PAPTP (i.e. high expression of Kv1.3 in tumors and more elevated ROS level than in healthy cells). We tested the tumor-reducing effect of PAP-1-MHEG as a proof of principle, but it must be emphasized that this molecule might be beneficial in various pathological contexts related to altered Kv1.3 expression/function.
4. Conclusions
In summary, in the present study we provide a novel insight into the mechanism of action of psoralen derivatives acting on mtKv1.3, by revealing an unexpected association of the mitochondrial channel with complex I of the respiratory chain. Further studies will hopefully clarify how the physical vicinity of various potassium channels in the inner mitochondrial membrane to distinct respiratory chain complexes fine tunes mitochondrial bioenergetics and fitness.
5. Materials and Methods
5.1. Human studies
| Name and Dilution | Clone | Company |
|---|---|---|
| TruStain fcX (anti-mouse CD16/32) 1:100 | Clone 93 | Biolegend |
| CD3-PE 1:500 | Clone 17A2 | BD Bioscience |
| CD4-Fitc 1:1000 | Clone GK1.5 | eBioscience |
| CD8a-APC 1: 500 | Clone 53–6.7 | eBioscience |
| CD19-PE 1: 1000 | Clone eBio1D3 | eBioscience |
| MHCII I-Ab APC 1: 500 | Clone AF6-120.1 | eBioscience |
| F4/80 Alexa Fluor488 1: 500 | Clone BM8 | eBioscience |
| CD11b Biotin 1: 2000 | Clone m1/70 | eBioscience |
| PE-Streptavidin 1: 2000 | BD Bioscience | |
| APC-Streptavidin 1: 2000 | BD Bioscience |
For the human studies a written informed consent was obtained from all patients, prior to sample collection, according to the Declaration of Helsinki. The ethical approval for our study was obtained from the local ethic committee ‘‘Regione Veneto on chronic lymphocytic leukemia’’. The CLL patient group was formed by equal numbers of 50 to 70-years-old male and female subjects. Isolated B cells from 5 healthy subjects (50 to 70 years) and from 14 B-CLL patients were analyzed and mesenchymal stromal cells (MSC) were from 4 CLL patients.
5.2. Animal studies
Animal experiments and care complied with the institutional guidelines and were approved by Italian authorities (both the local Ethic Committee OPBA (Organismo preposto al benessere animale) at the University of Padova and the Italian Ministry for Health (CEASA number 54/2011)) as well as the Animal Care and Use Committee of the Bezirksregierung Dϋsseldorf (AZ 84–02.04.2015.A374), Germany. Experiments were carried out with the supervision of the Central Veterinary Service of the Universities of Padova (in compliance with Italian Law DL 116/92, embodying UE directive 86/609) and of Duisburg-Essen. Two-to-six-months-old male or female C57BL/6 J mice weighing 18–26 g were obtained from Harlan and used for the orthotopic in vivo melanoma model as well as for the pharmacokinetics.
5.3. Chemistry
Starting materials and solvents were reagent grade chemicals purchased from Aldrich, Sigma-Aldrich, TCI, Fluka, Riedel-de Haen (Seelze, German), Prolabo (Fonyenay sous Bois, France), Carbosynth (Compton, Berckshire, UK), and were used as received. 1H NMR and 13C NMR spectra were recorded with a Bruker AC 250F spectrometer operating at 250 MHz for 1H NMR and 62.9 MHz for 13C NMR, or with a Bruker 300 UltraShield spectrometer operating at 300/75 MHz, or with a Bruker 500 UltraShield spectrometer operating at 500/126 MHz. Chemical shifts (d) are given in ppm, and the residual solvent signal was used as internal standard. TLCs were run on silica gel supported on plastic (Macherey-Nagel Polygram_SIL G/UV254, silica thickness 0.2 mm) and were visualized by UV detection. Flash chromatography was performed on silica gel (Macherey-Nagel 60, 230–400 mesh) under compressed air pressure. HPLC/ESI-MS analyses and mass spectra were performed with a 1100 Series Agilent Technologies system, equipped with a binary pump (G1312A) and an MSD SL Trap mass spectrometer (G2445D SL) with ESI source. ESI-MS spectra were obtained from solutions in acetonitrile, eluting with acetonitrile containing 0.1% formic acid. HPLC/ESI-MS analysis was used to confirm the purity (>95%) of isolated intermediates and products. PAP-OH [10], Ts-MTEG [24], Ts-MHEG [24], PAP-1 [18] and POP-OH [49], were prepared according to adapted literature procedures. The spectroscopic data for these compounds was consistent with the literature.
5.4. Synthesis
PAP-1-MTEG, i.e. (4-(4-(4-(2,5,8,11-tetraoxatridecan-13-yloxy)phenoxy)butoxy)-7H-furo[3,2-g] benzopiren-7-one), and PAP-1-MHEG, i.e. 4-(4-(4-(2,5,8,11,14,17-hexaoxanonadecan-19-yloxy)phenoxy)butoxy)-7H-furo[3,2-g]chromen-7-one, were obtained by reacting PAP-OH, i.e. (4-(4-(4-hydroxyphenoxy)butoxy)-7H-furo[3,2-g]benzopiren-7-one, with p-toluensulfonate derivatives of oligoethylene glycol monomethyl ether (Ts-MOEG) containing 4 or 6 units of ethylene glycol respectively, i.e. 2,5,8,11-tetraoxatridecan-13-yl 4-methylbenzenesulfonate (Ts-MTEG) and 2,5,8,11,14,17-hexaoxanonadecan-19-yl 4-methylbenzenesulfonate (Ts-MHEG), as illustrated in Scheme 1.
Scheme 1.

General synthetic scheme for the synthesis of PAP-1-MTEG and PAP-1-MHEG. See text for details.
4-(4-(4-(2,5,8,11-tetraoxatridecan-13-yloxy)phenoxy)butoxy)-7H-furo[3,2-g] benzopiren-7-one (PAP-1-MTEG): PAP-OH (185 mg, 0.50 mmol, 1.0 eq.) was dissolved in DMF (15 ml) with Cs2CO3 (328 mg, 1.1 mmol, 2.0 eq.) and Ts-MTEG (282 mg, 0.75 mmol, 1.5 eq.) was added to the mixture. The solution was stirred and heated at 50 °C in darkness overnight under nitrogen. The following day EtOAc (100 ml) was added to the solution and the mixture was washed with 0.5 M HCl (5 x 70 ml). The organic phase was dried with MgSO4 and filtered. The solvent was removed under vacuum and the crude product was purified by flash chromatography using DCM/acetone (70:30) as eluent to afford PAP-1-MTEG as a colorless oil in 94% yield (261 mg, 0.47 mmol). 1H NMR (300 MHz, CDCl3) δ = 8.12 (d, J = 9.8 Hz, 1H), 7.88–7.70 (m, 1H), 7.57 (d, J = 2.4 Hz, 1H), 7.38–7.24 (m, 1H), 7.11 (s, 1H), 6.95 (dd, J = 2.4, 1.0 Hz, 1H), 6.88–6.72 (m, 1H), 6.23 (d, J = 9.8 Hz, 1H), 4.53 (t, J = 6.0 Hz, 2H), 4.20–4.11 (m, 2H), 4.10–4.04 (m, 2H), 4.01 (t, J = 5.8 Hz, 2H), 3.87–3.78 (m, 2H), 3.77–3.44 (m, 12H), 3.36 (s, 3H), 2.44 (s, 3H) ppm. 13C NMR (75 MHz, CDCl3) δ = 162.92, 160.02, 154.47, 147.90, 142.10, 139.92, 134.76, 132.59, 130.72, 130.45, 128.61, 118.50, 118.13, 118.07, 116.28, 115.36, 113.06, 96.60, 94.39, 74.22, 73.62, 72.28, 70.95, 70.56, 70.36, 61.63, 59.76, 24.16, 22.47 ppm. ESI+-MS (ion trap): m/z: 557, [M+H]+.
4-(4-(4-(2,5,8,11,14,17-hexaoxanonadecan-19-yloxy)phenoxy)butoxy)-7H-furo[3,2-g]chromen-7-one (PAP-1-MHEG): PAP-OH (200 mg, 0.54 mmol, 1.0 eq.) was dissolved in DMF (25 ml) with Cs2CO3 (352 mg, 1.1 mmol, 2.0 eq.) and Ts-MHEG (365 mg, 0.81 mmol, 1.5 eq.) was added to the mixture. Subsequent procedures were as detailed for PAP-1-MTEG. The crude product was purified first by flash chromatography using DCM/acetone (70:30, Rf = 0.5) as eluent and then using preparative HPLC to afford PAP-1-MHEG as a colorless oil in 93% yield (327 mg, 0.51 mmol). 1H NMR (300 MHz, CDCl3) δ = 8.09 (d, J = 9.8 Hz, 1H), 7.55 (d, J = 2.4 Hz, 1H), 7.07 (s, 1H), 6.92 (d, J = 2.3 Hz, 1H), 6.86–6.73 (m, 4H), 6.20 (d, J = 9.8 Hz, 1H), 4.50 (t, J = 5.9 Hz, 2H), 4.09–4.02 (m, 2H), 3.99 (t, J = 5.7 Hz, 2H), 3.86–3.75 (m, 2H), 3.74–3.56 (m, 18H), 3.52 (dd, J = 5.6, 3.3 Hz, 2H), 3.34 (s, 3H), 2.18–1.85 (m, 4H) ppm. 13C NMR (75 MHz, CD2Cl2) δ = 161.24, 158.28, 153.11, 153.09, 152.70, 148.94, 144.86, 139.34, 115.69, 115.34, 113.18, 112.49, 106.67, 105.18, 95.60, 93.80, 77.58, 77.16, 76.74, 72.57, 71.93, 70.80, 70.62, 70.58, 70.49, 69.87, 68.12, 67.89, 59.02, 26.99, 26.00 ppm. ESI-MS (ion trap): m/z 645 [M+H]+.
MHEG-TPP, i.e. (2,5,8,11,14,17-hexaoxanonadecan-19-yl)triphenylphosphonium p-toluenesulfonate, was obtained by reacting Ts-MHEG with triphenylphosphine, as illustrated in Scheme 2.
Scheme 2.

Synthesis of MHEG-TPP. See text for details.
(2,5,8,11,14,17-hexaoxanonadecan-19-yl)triphenylphosphonium p-toluenesulfonate (MHEG-TPP): PPh3 (5.0 g, 19.06 mmol, 8.6 eq.) was added to Ts-MHEG (100 mg, 0.22 mmol, 1 eq.) and the resulting neat mixture was stirred at 100 °C for 3.5 h CHCl3 (5 ml) was then added and the resulting solution was directly processed by flash silica gel column chromatography (mobile phase CHCl3 to eluate the excess of PPh3, then CHCl3/MeOH 85:15) to obtain MHEG-TPP (135 mg, 0.19 mmol, 88% yield). 1H NMR (300 MHz, CDCl3) δ = 7.76–7.43 (m, 17H), 6.93 (d, J = 7.9 Hz, 2H), 3.95–3.61 (m, 4H), 3.57–3.47 (m, 10H), 3.45–3.37 (m, 4H), 3.31–3.20 (m, 5H), 3.20–3.08 (m, 4H), 2.18 (s, 3H). 13C NMR (75 MHz, CDCl3) δ = 144.44, 138.37, 134.55, 134.51, 133.96, 133.82, 130.04, 129.87, 128.20, 126.04, 119.45, 118.29, 71.80, 70.45, 70.43, 70.40, 70.39, 70.36, 70.23, 70.19, 69.82, 63.76 (d, J = 7.6 Hz), 58.92, 24.52 (d, J = 53.3 Hz), 21.21. ESI-MS (ion trap): m/z 541 [M-TsO]+.
POP-MHEG, i.e. 19-(4-(pentyloxy)phenoxy)-2,5,8,11,14,17-hexaoxanonadecane, was obtained by reacting POP-OH with Ts-MHEG, as illustrated in Scheme 3.
Scheme 3.

Synthesis of POP-MHEG. See text for details.
19-(4-(pentyloxy)phenoxy)-2,5,8,11,14,17-hexaoxanonadecane (POP-MHEG): POP-OH (300 mg, 1.66 mmol, 1 eq.) was dissolved in DMF (25 ml) with Cs2CO3 (1.17 g, 3.32 mmol, 2 eq.) and TS-MHEG (1.12 g, 2.49 mmol, 1.5 eq.) was added to the mixture. The solution was stirred and heated at 50 °C in darkness overnight under nitrogen. The following day, EtOAc (100 ml) was added to the solution and the mixture was extracted with 0.5 M HCl/Brine 1:1 (5 x 70 ml). The aqueous phase was discarded and the organic phase was dried with MgSO4 and filtered. The solvent was evaporated under vacuum and the crude product was purified by flash chromatography using DCM/acetone (70:30) as eluent to afford POP-MHEG as a colorless oil in 91% yield (693 mg, 1.51 mmol). 1H NMR (400 MHz, Chloroform-d) δ 6.86–6.71 (m, 4H), 4.08–3.97 (m, 2H), 3.85 (t, J = 6.6 Hz, 2H), 3.81–3.74 (m, 2H), 3.70–3.56 (m, 18H), 3.55–3.47 (m, 2H), 3.33 (s, 3H), 1.87–1.52 (m, 2H), 1.49–1.18 (m, 4H), 0.89 (t, J = 7.1 Hz, 3H). 13C NMR (101 MHz, CDCl3) δ 153.45, 152.80, 115.58, 115.31, 71.90, 70.76, 70.59, 70.55, 70.47, 69.83, 68.54, 68.07, 58.97, 29.06, 28.20, 22.45, 14.02. ESI-MS (ion trap): m/z 459 [M+H]+.
POP-OMe, i.e. 1-methoxy-4-(pentyloxy)benzene, was obtained by reacting 4-methoxyphenol (4-MP) with 1-iodopentane, as illustrated in Scheme 4.
Scheme 4.

Synthesis of POP-OMe. See text for details.
1-methoxy-4-(pentyloxy)benzene (POP–OMe): 4-methoxyphenol (1.17 g, 9.43 mmol, 1.0 eq), 1-iodopentane (2.24 g, 11.3 mmol, 1.2 eq) and K2CO3 (1.56 g, 11.3 mmol, 1.2 eq) were suspended in DMF (10 ml) and stirred at 60 °C overnight. Ethyl acetate (100 ml) was then added and the mixture was washed with H2O/Brine 1:1 (4 x 100 ml). The organic layer was dried over Na2SO4, filtered and the solvent was removed under reduced pressure. The crude product was purified by flash chromatography using petroleum ether/ethyl acetate 95:5 as eluent to afford 1-methoxy-4-pentoxybenzene as a colorless solid (1.45 g, 7.45 mmol, 79% yield). 1H NMR (400 MHz, CDCl3) δ 6.90–6.83 (m, 4H), 3.93 (t, 2H), 3.78 (s, 3H), 1.85–1.75 (m, 2H), 1.53–1.37 (m, 4H), 0.98 (t, 3H). 13C NMR (101 MHz, CDCl3) δ 153.7, 153.4, 115.4, 114.6, 68.6, 55.7, 29.2, 28.3, 22.6, 14.1. ESI-MS (ion trap): m/z 195 [M+H]+.
Solubility determinations. For each compound, four distinct suspensions were prepared by diluting 50 mM stock solutions in DMSO (1:1000, 0.1% final DMSO) in DMEM without Phenol Red and FBS. The suspensions were then centrifuged at 12000g, room temperature, for 30 and then for 75 min, and the clear supernatants were analyzed by HPLC/UV. The chromatographic peak area was used to determine the concentration of the compound in the supernatants, based on calibration curves built using solutions in DMSO. Since there were no significant differences between the values obtained from the four different samples, and the difference in centrifugation times also had no detectable effect, the average ± s.d. of these data was taken to represent the solubility of the compound.
Hydrolysis experiments. The stability of PAP-1-MTEG and PAP-1-MHEG was tested in aqueous solution and in rat blood following the protocols described in Ref. [10]. Both compounds were stable for up to 4 h at 37 °C.
HPLC/UV analyses were carried out as described in Ref. [10].
5.5. Cell culturing
B16F10 cells (ATCC) were grown in Minimum Essential Media (MEM, Thermo Fisher Scientific) supplemented with 10 mM HEPES buffer (pH 7.4, Life Techologies), 10% (v/v) fetal bovine serum (FBS, BioSpa S.p.A.), 100 U/ml penicillin and 100 U/ml streptomycin (Life Technologies), 1% non-essential amino acids (100X solution; Thermo Fisher Scientific). Lymphocytes (Jurkat and B cells) were grown in RPMI-1640 (Thermo Fisher Scientific), supplemented with 10% (v/v) fetal bovine serum (FBS, BioSpa S.p.A.), 10 mM HEPES buffer (pH 7.4, Life Techologies), 100 U/ml penicillin and 100 U/ml streptomycin (Life Technologies), 1% non-essential amino acids (100X solution; Life Technologies). HEK293 and CHO cells were grown in DMEM (Thermo Fisher Scientific), supplemented with 10% (v/v) fetal bovine serum (FBS, BioSpa S.p.A.), 10 mM HEPES buffer (pH 7.4, Life Techologies), 100 U/ml penicillin and 100 U/ml streptomycin (Life Technologies), 1% non-essential amino acids (100X solution; Life Technologies). All cells were maintained at 37 °C and 5% CO2.
5.6. Electrophysiology
The effects of the compounds of interest on current conduction by Kv channels was assessed by whole-cell patch-clamp experiments performed on Jurkat cells as described in Ref. [11]. Briefly, whole-cell currents were recorded with an EPC-7 amplifier (List, Darmstadt, Germany; filter, 500 Hz; sampling rate, 5 kHz) on Jurkat cells cultured in RPMI. Leak currents were not subtracted. The bath solution was composed of 160 mM NaCl, 5 mM KCl, 2.5 mM CaCl2, 1 mM MgCl2, and 10 mM HEPES (pH 7.3). The intracellular solution contained 150 mM KCl, 1 mM CaCl2, 2 mM MgCl2, 10 mM EGTA, and 10 mM HEPES (pH 7.3). Intracellular voltages are reported, and outward currents are plotted upward. Leak was not subtracted.
In another set of experiments, performed by Chantest Ltd, UK, EC50 values were determined in whole-cell patch clamp experiments. Kv1.1, Kv1.3 and Kv1.5 were stably expressed in CHO cells. The peak whole-cell currents measured at +50 mV were comparable for all three channels (n ≥ 180 for each channel type). Since the single channel conductance is similar for the three channels the expression levels for each channel was comparable. EC50 values were obtained by fitting of the dose-response curves (n = 5). In these experiments whole-cell peak current values following application of voltage pulses to +50 mV from a holding potential of −50 mV were measured and used to determine the concentration at which one-half of the current measured under control conditions was obtained.
5.7. Determination of cell proliferation
Jurkat cells were seeded at a concentration of 1×10⁵ cells/ml in a 12-well plate in 1.5 ml of the growth medium supplemented with the various compounds. We used serum-free medium to inhibit cell proliferation. The counts were performed daily using a LUNA-II™ Automated Cell Counter, after Trypan Blue staining.
5.8. Isolation of B lymphocyte from human blood and mesenchymal stromal cell cultures
Peripheral blood mononuclear cells (PBMCs) from the patients were isolated by density-gradient centrifugation using the Ficoll-Hypaque (F/H) technique (Amersham Biosciences; Buckinghamshire, UK) as previously described [29]. The samples were checked for purity by flow cytometry; if the percentage of cells other than CD19+ B cells exceeded 5%, the purification procedure was repeated. For healthy donors, non-manipulated peripheral blood B cells were isolated from the PBMCs by negative selection using the RosetteSep isolation kit for B cells (STEMCELL Technologies; Vancouver, Canada). To obtain distinct populations of B- and T-cells we used the separation method of sheep red blood cells (SRBC) [50]. Mesenchymal stromal cells (MSCs) were isolated from iliac crest bone marrow (BM) aspirate of CLL patients under local anaesthesia and diluted 1:3 in Phosphate Buffered Saline (PBS) (Euroclone; Milan, Italy) [50]. For MSC culture, BM mononuclear cells (BMMCs) were isolated as stated above and plated at a density of 1000 cells/cm2 in DMEM (Euroclone) with 1 mg/ml glucose, l-glutamine, 10% heat-inactivated FBS and 100 U/ml Penicillin, 100 mg/ml Streptomycin (Life Technologies; Paisley, UK). BMMC suspensions were incubated at 37 °C in humidified atmosphere containing 5% CO2 and allowed to attach for 7 days; at this time-point, the non-adherent fraction was discarded and adherent cells were fed every week with fresh medium. These cells were maintained until confluence, then they were removed by treatment with Accutase (Sigma-Aldrich; Milan, Italy), centrifuged and diluted 1:3 for subsequent expansion in 25 cm2 flasks or cryopreserved for future use. 2x10⁶ purified human primary B-CLL cells or healthy B cells were seeded onto a confluent MSC layer and treated as indicated in the figure legends. After treatments, MSC cell death was analyzed after labeling for 20 min with Annexin V (at 37 °C) by fluorescent microscopy, using a Leica DMI4000 microscope (Leica Microsystem, Wetzlar, Germany) in the case of MSC [26] or by flow cytometry (FACS Canto II, BD BioSciences) in the case of CLL or healthy B cells growing in suspension [29].
5.9. Cell viability and cell death assays
For cell growth/viability (MTS) assays, B16F10 cells were seeded at a density of 7.5×10³ cells/well in standard 96-well plates and allowed to grow in MEM (100 μl) for 24 h. The growth medium was then replaced in the dark with FBS-free medium containing the desired compound. The final concentration of DMSO was 0.1% or lower in all cases (including controls). A non-toxic concentration of Cyclosporine H (CSH) (4 μM) was used as MDRi. After incubation for 24 h, CellTiter 96® AQUEOUS One solution (Promega, Italy) was added to each well as indicated by the supplier. Absorbance was measured at 490 nm to detect formazan formation using an Infinite® 200 PRO 96-well plate reader (Tecan Life Sciences).
For cell death assays of non-adherent cells, such as Jurkat, B-CLL cells and B cells, a Becton Dickinson FACS Canto II flow cytometer was used. The cells were incubated with the indicated substances for 24 h, washed in HBSS, and resuspended at 3×10⁵ cells/ml in a serum- and Phenol Red-free DMEM, or in some experiments in HBSS. DMSO concentration was <0.1% in all cases. A 200 μl portion of each incubation sample was then placed in a test tube and annexin-V-FLUOS (Roche) (1 ml/sample) was added. Flow cytometry analysis was carried out after a further 20 min labelling period at 37 °C in the dark. Data were processed by quadrant statistics using BD VISTA software. Cell death of adherent cells was measured by fluorescence microscopy. 0.02×10⁵ cells/ml were seeded in a 24-well plate and treated for 24 h, as indicated, in 1 ml of DMEM without Phenol Red and FBS. Following incubation, 1 μl/well of annexin-V-FLUOS (Roche) was added and cells were incubated for 20 min in the dark at 37 °C. Cells were then analyzed using a Leica DMI 4000 fluorescence microscope (Leica Microsystem, Wetzlar, Germany). To determine the percentage of apoptotic B- and T-cells from the same B-CLL patient or from healthy subjects, the following antibodies were used: Annexin V-alexa 568 (Roche), and anti-CCR7 fluorescein isothiocyanate (FITC; CCR7-FITC: FAB197F) (R&D System, Minneapolis, MN, USA), anti-CD3 phycoerythrin-cyanin 7 (PE-Cy7; CD3-PEcy7: 557851) and anti-CD19 allophycocyanin (APC; CD19-APC: 555415) (Becton Dickinson, Franklin Lakes, NJ, USA) [50].
5.10. Downregulation of Kv1.3 expression by siRNA
8×10⁴ B16F10 cells/well were seeded into a 12-well plate in 1 ml of the growth medium. After 24 h, cells were transiently transfected with 2 μg siRNA/well using Lipofectamine 2000, as suggested by the supplier. The sequences for the siRNA targeting human Kv1.3 were coupled to Alexa Fluor 555 (Hs_KCNA3_1 Flexi tube siRNA for Kv1.3 and All-Star negative control siRNA as scramble/control; Qiagen). Jurkat cells were transfected by electroporation as described earlier [10]. After 48 h from transfection, cells were treated for 24 h with the various compounds as indicated. Cell death, evaluated by the binding of FITC-labeled Annexin V, as well as the successful transfection with Alexa555-coupled siRNA were determined using a DMI 4000 Leica fluorescence microscope or FACS analysis.
5.11. ROS production and membrane potential
Adherent B16F10 cells were seeded at a density of 5×10⁴ cells/well on coverslips in a 12-well plate in 1 ml of MEM medium. After 24 h, to observe variations in mitochondrial membrane potential cells were incubated with 20 nM TMRM (Thermo Fisher Scientific) in HBSS for 20 min at 37 °C in the dark. Then the medium was changed to 5 nM TMRM in HBSS and the coverslip was placed under the objective. Compounds were added as indicated in the figure and the decrease in TMRM fluorescence was monitored at different time points. The uncoupler FCCP was used as positive control. To evaluate mitochondrial ROS production, cells were incubated with 1 μM MitoSOX (Thermo Fisher Scientific) in HBSS for 20 min at 37 °C in the dark. The incubation medium was then replaced with HBSS to perform the experiment. The increase in MitoSOX fluorescence was measured at the indicated time points after the addition of the desired compounds. Antimycin A was used as the positive control. Images were acquired using a confocal Leica DMI 6000 fluorescence microscope (Leica Microsystem, Wetzlar, Germany). Similar experiments were perfomed using both B-CLL and healthy B-cells. After incubation with 1 μM MitoSOX or 20 nM TMRM in HBSS for 20 min at 37 °C in the dark, mitochondrial ROS production or mitochondrial membrane potential, respectively, were determined measuring the median of the fluorescence distribution curve (Gaussian) obtained with a FACS Canto II (BD Bioscience).
5.12. Determination of ATP
ATP was measured in B16F10 cells using the ATPlite Luminescence ATP Detection Assay System (Perkin Elmer). Cells were seeded into white 96-well view plates at a density of 1×10⁴ cells/well. The following day, cells were pre-incubated with a medium containing 5.5 mM 2-deoxy-d-glucose (2-DG) to inhibit glycolysis. Treatments were performed in the same 2-DG containing medium. Oligomycin was used as positive control. 6 h after starting the treatment, the assay was performed according to manufacturer's instructions using the EnVision 2105 Multimode Plate Reader (Perkin Elmer).
5.13. Oxygen consumption assay
Respiration was measured using an XF24 Extracellular Flux Analyzer (Seahorse, Bioscience), which measures the oxygen consumption rate (OCR). B16F10 cells were seeded at 3.5×10⁴ cells/well in 100 μl of MEM and incubated for 24 h at 37 °C in humidified atmosphere with 5% CO2. The medium was then replaced with 670 μl/well of high-glucose DMEM without serum and sodium bicarbonate and supplemented with 1 mM sodium pyruvate and 4 mM l-glutamine. The oxygen consumption rate (OCR) was measured at preset time intervals upon the preprogrammed additions of the following compounds: oligomycin to 2 μg/ml, FCCP to 300 nM, Antimycin A to 1 μM final concentrations. All chemicals were added in 70 μl of DMEM. At the end of each experiment cells were observed at the microscope to examine their morphology and to exclude wells with massive cell detachment.
5.14. Activity of respiratory chain complexes
The activity of mitochondrial respiratory chain complexes and ATP synthase was assayed in vitro using mouse liver mitochondria membrane fractions. Changes in absorbance were monitored at 37 °C using an Agilent Technologies Cary 100 UV–Vis spectrophotometer.
Briefly, to test complex I activity, 50 μg/ml of mouse liver mitochondria were incubated with 10 μM alamethicin, 3 mg/ml bovine serum albumin (BSA), 10 mM Tris–HCl (pH 8.0), 2.5 mM NaN3 and 65 μM coenzyme Q1 (CoQ1). 100 μM NADH was added to start NADH oxidation by complex I. Complex I activity continued to be monitored following changes in absorbance at 340 nm after the addition of the different compounds to be tested. 2 μM rotenone was added to stop the reaction, in order to identify complex I-independent NADH oxidation.
To assay complex III activity, 10 mg/ml of mitochondria were incubated in 50 mM potassium phosphate buffer, pH 7.5, 10 μM alamethicin, 3 mg/ml BSA, 2.5 mM NaN3, 2 μM rotenone, 0,025% TWEEN, and 75 μM oxidized cytochrome c. The reaction was started adding 75 μM of reduced decylubiquinol; changes in absorbance were monitored at 550 nm. At the end of the experiment, 2 μg/ml antimycin was added for assessment of complex III-independent activity.
ATP-ase activity was measured by coupling the production of ADP to the oxidation of NADH via the pyruvate kinase and lactate dehydrogenase reaction (coupled assay). 20 μg/ml of isolated mitochondria were added to the reaction mixture (pH 7.6) composed of 250 mM sucrose, 10 mM Tris–HCl, 200 μM EGTA–Tris, 1 mM NaH2PO4, 6 mM MgCl2, 2 μM rotenone, 10 μM alamethicin, 3 mg/ml BSA, 1 mM phosphoenol-pyruvate (PEP), 0.1 mM NADH, pyruvate kinase (PK; 20 units/ml), lactate dehydrogenase (LDH; 50 units/ml). The addition of 500 μM ATP started the reaction and the absorbance was measured at 340 nm. 1 μg/ml oligomycin A was added to block the reaction and to evaluate FOF1-ATPase-independent ATP hydrolysis.
In all cases the activities of the complexes were evaluated from the slope of the absorbance vs. time plot. Complex-independent activity was subtracted from the raw data, and the slopes of the resulting plots were expressed as % of the control (addition of DMSO).
5.15. Coimmunoprecipitation studies
HEK293 cells were seeded in 150 mm2 dishes and grown to 70% confluence. Cells were transiently transfected using the calcium-phosphate procedure using 88 μg of total pEYFP-Kv1.3-HA plasmid, kindly provided by Prof. A. Felipe, for each dish. 24 h after transfection, cells were washed with cold PBS and collected using a cell scraper. Mitochondria were isolated following the procedure described in Ref. [51].
To immunoprecipitate Kv1.3, we conjugated 3 μg of anti-HA (Sigma Aldrich, H3663) with 30 μl magnetic beads (invitrogen, 10004D) for 1 h at RT. 1 mg of isolated mitochondria were incubated in 200 μl of 10 mM Tris/Cl pH 7.5; 150 mM NaCl; 0.5 mM EDTA; 0.5% NP-40, and 1x protease inhibitors (Sigma Aldrich) for 30 min at 4 °C; the insoluble material was cleared by centrifugation for 30 min, and the supernatants were incubated overnight at 4 °C with either HA-conjugated or non-conjugated beads. After the incubation, beads were collected using a magnet and then washed three times for 5 min each to remove non-specifically bound proteins using a wash buffer containing 10 mM Tris/Cl pH 7.5; 150 mM NaCl; 0.5 mM EDTA.
To immunoprecipitate Complex I, 1 mg of isolated mitochondria were re-suspended in 200 μl of PBS, 1% DDM, 1x protease inhibitors for 30 min at 4 °C. Following, insoluble material was cleared by centrifugation for 30 min, and the supernatants were incubated overnight at 4 °C with either Complex I Immunocapture beads (Abcam, ab109711), or not-conjugated agarose beads (Roche, 11719408001). After incubation with the lysed mitochondria, Immunocapture beads were collected by centrifugation and washed three times with PBS, 0.25% DDM.
In both cases, bound proteins were eluted using SDS-containing sampling buffer. Eluted samples were heated at 95 °C for 5 min and then resolved by SDS-page electrophoresis followed by immunoblotting.
PVDF membranes were incubated with the following antibody: anti-HA (Sigma Aldrich, H3663, 1:1000), anti-NDUFS1 (Abcam, ab169540, 1:1000), anti-NDUFA9 (Abcam, ab14713, 1:1000).
5.16. Blue native gel electrophoresis (BNGE) & BN-SDS gel electrophoresis (BN-SDSGE)
B16F10 cells were seeded in a 500 cm2 dish and allowed to grow up to 80% of confluence, washed with PBS and collected using a cell scraper. Mitochondria were isolated using a published protocol [51]. 200 μg of mitochondria were resuspended in 50 μl of Solubilization Buffer, composed of Native sample buffer (Life Technologies), 4% digitonin (Life Technologies), protease inhibitors (Sigma Aldrich). The mixture was kept in ice for 10 min and then centrifugated for 30 min at 17000×g. Coomassie G-250 was then added to supernatants which were stored at −20 °C until use. Protein complexes in the samples were separated by blue native gel electrophoresis (BNGE) on a precast native Bis-Tris 3–12% gel (Life Technologies) as described in Glytsou et al [52]. Proteins were then transferred onto a PVDF membrane using a NuPAGE Transfer Buffer (Life Technologies). Membranes were blocked in skim milk (Sigma-Aldrich), 5% in Tris-buffered saline (TBS: 10 mM Tris, 150 mM NaCl, pH 7.4) for 1 h at RT and washed in TBS. Membranes were incubated overnight at 4 °C with the following primary antibodies: anti-Kv1.3 (1:200 in TBS, rabbit polyclonal, Alomone Labs APC-101); anti-NDUFA9 (1:1000 in 5% skim milk, mouse monoclonal, Abcam ab14713). After washing, the membranes were developed using corresponding anti-rabbit or anti-mouse secondary antibodies conjugated to horseradish peroxidase (HRP; dilution 1:10000 in TTBS; rabbit: KPL 074–1516; mouse: Sigma-Aldrich A4416). Chemiluminescence was detected with a ChemiDoc Touch Imaging System (BioRad) after incubation with the EuroCloneLiteAblot Plus luminol mix.
Two-dimensional (2D) blue native-SDS gel electrophoresis (BN-SDSGE) was performed by excising the lane obtained from the first BNGE and incubating it in sequence with the reducing solution (10 min), alkylating solution (7 min), and quenching solution (12 min) following manufacturing instructions (Life technologies, Invitrogen) to facilitate dissociation of the complexes. The lane was then equilibrated into the NuPAGE MES running buffer (Life Technologies; used also for the following electrophoretic run), loaded into a NuPAGE Bis-Tris 4–12% ZOOM gel (Life Technologies) and run under denaturing conditions. PageRuler Plus Prestained Protein Ladder (Life Technologies) was used as molecular weight standard. Proteins were transferred onto a PVDF membrane which was saturated using skim milk and incubated overnight at 4 °C with the primary antibodies: anti-Kv1.3 as above; anti-NDUFS3 (1:1000 in 5% skim milk, mouse monoclonal, Abcam ab110246). The developing procedure was as described for the BNGE.
5.17. Luciferase reporter assay
Luciferase assays were performed in HEK293 as described in Ref. [30]. Briefly, cells were transfected with β-catenin/TCF-responsive reporter TOP-FLASH (M50 Super 8x TOPFlash, Addgene, Cat#12456), together with CMV-β-gal [30] to normalize for transfection efficiency with CPRG (Roche). DNA content was kept uniform by using pBlueScript II SK (Addgene, Cat#212205).
Cells were plated in 24-well plates at a density of 5×10⁴ cells/well. After 24 h luciferase reporter plasmid was transiently transfected using TransIT®-LT1 Transfection Reagent (Mirus). 48 h after transfection, cells were left untreated or treated with the compounds for 8 h and then harvested in Luc lysis buffer (25 mM Tris pH 7.8, 2.5 mM EDTA, 10% glycerol, 1% NP-40, 2 mM DTT). Luciferase activity was determined in a Tecan plate luminometer with freshly reconstituted assay reagent (0.5 mM D-Luciferin, 20 mM tricine, 1 mM (MgCO3)-4 mM Mg(OH)2, 2.7 mM MgSO4, 0.1 mM EDTA, 33 mM DTT, 0.27 mM CoA, 0.53 mM ATP).
5.18. Pharmacokinetic analysis
Tissue distribution of various compounds was assayed in C57BL/6 J mice. PAP-1-MHEG (10 nmol/g) and clofazimine (2 nmol/g) were injected i.p. into healthy adult mice. 30, 60 and 120 min after the treatment mice were sacrificed, tissues were collected, 100 mg were weighed, PBS (1 vol) was added, and the mixture containing tissue cut into small pieces was homogenized using an electric pestle. The samples were vortexed (2 min) and then stabilized and extracted adding 0.43 M acetic acid, 100 μM 5-MOP as internal reference, acetone (v/v/v: 0.1, 0.1, 10), vortexed (2 min), sonicated (2 min), and centrifuged (12 000 g, 7 min, 4 °C); the supernatant was collected, concentrated, and finally analyzed via HPLC-UV according to a previously established protocol [10].
5.19. In vivo experiments and immunohistochemistry
For in vivo experiments, B16F10 cells were grown to sub-confluence in a MEM medium. The cells were detached with cell dissociation solution (Becton Dickinson, Heidelberg, Germany), washed twice in PBS and subcutaneously injected into the right flank of C57BL/6 J mice to induce melanoma formation (50 000 cells) [10]. I.p. administration of DMSO (for control mice), PAP-1 or PAP-1-MHEG at the indicated dosages was initiated on post-inoculation day 5 and repeated at days 7, 9 and 11. The solutions to be injected were prepared by diluting the concentrated stock solutions of the compounds in DMSO into physiological saline buffer (final DMSO concentration was 0.1%). Tumors were removed 13 or 16 days after inoculation and the tumor volumes were determined as the product of length, width and height.
Immunohistochemistry was performed as described in Ref. [9]. Mice were sacrificed and immediately perfused at low pressure via the right heart ventricle with 0.9% NaCl for 2 min followed by 4% paraformaldehyde for 10 min. Organs, including the brain, heart, liver, kidney and spleen, were then removed and further fixed in 4% paraformaldehyde for 36 h. Tissues were serially dehydrated and embedded in paraffin for sectioning at a thickness of 7 μm. The sections were then dewaxed, rehydrated and incubated for 4 min in 0.1 M citrate buffer (pH 6.0) in a microwave oven operating at 350 W. These sections were stained for 2 min with hematoxylin and washed with water prior to being mounted in Mowiol and examined using a Leica TCS-SP2 microscope (Leica Microsystem, Wetzlar, Germany). TUNEL assay was performed as detailed in Ref. [10].
5.20. Determination of immune cell subpopulations
At the end of in vivo experiments, 16 days after tumor cell injection and regular treatment with PAP-1 or PAP-1-MHEG, as described above, blood, thymus, spleen and iLNs were collected. The total cell number in blood was determined using a Burker chamber. The other organs were mechanically dissociated to separate cells and also in this case total cell number was counted. Following, 1x10⁶ cells for each condition were labeled using the antibodies as indicated in Fig. 4e for 15 min at 4 °C in the dark. Labeled cells were then analyzed by flow cytometry.
Samples were measured with a FACSCalibur (BD) instrument and analyzed using a BD CellQuest Pro software. Results are shown as the x-fold change of the different populations in relation to the mean value of the untreated. The antibodies used are listed in the following table.
5.21. Quantification and statistical analysis
Statistical significance of the difference between each couple (control and compound/vehicle) was assessed by paired t-test or by means of one-way ANOVA analysis with Dunnett's post-test. Statistical significance of the difference between untreated and treated groups was then assessed for each parameter by means of two-way ANOVA analysis. Statistical analysis was performed using GraphPad Prism software. Statistical details can be found in figure legends and in all presented data n ≥ 3.
Declaration of competing interest
The authors declare that they have no known competing financial interests or personal relationships that could have appeared to influence the work reported in this paper.
Acknowledgment
The authors are grateful to the Italian association for cancer research (AIRC) grants (IG 2017 20286 to I.S. and MFAG 2020 23271 to L.L.), to the Sander Foundation # 2019.115.1 to E.G. and for an EMBO for a short-term fellowship (ASTF 233–2014) to L.L. I.S. is also grateful for support from the Italian Association for Multiple Sclerosis (Grant 2018/R/20).
Footnotes
Supplementary data to this article can be found online at https://doi.org/10.1016/j.redox.2020.101705.
Author contribution
RP, LL, AMattarei, MA, KAB, RM, GR, AC, LB, SP, SK, AManago, AR performed experiments; GS, MES, LT, EG, CP, MZ, LL, IS supervised the work; IS, MZ, EG, LT, CP, AMatterei, ME, AS conceived experimental design and discussed results; RP, CP, AMattarei, MZ and IS wrote the manuscript.
Appendix A. Supplementary data
The following is the Supplementary data to this article:
References
- 1.Azam P., Sankaranarayanan A., Homerick D., Griffey S., Wulff H. Targeting effector memory T cells with the small molecule Kv1.3 blocker PAP-1 suppresses allergic contact dermatitis. J. Invest. Dermatol. 2007;127:1419–1429. doi: 10.1038/sj.jid.5700717. [DOI] [PMC free article] [PubMed] [Google Scholar]
- 2.Bartok A., Toth A., Somodi S., Szanto T.G., Hajdu P., Panyi G., Varga Z. Margatoxin is a non-selective inhibitor of human Kv1.3 K+ channels. Toxicon. 2014;87:6–16. doi: 10.1016/j.toxicon.2014.05.002. [DOI] [PubMed] [Google Scholar]
- 3.Bednarczyk P., Wieckowski M.R., Broszkiewicz M., Skowronek K., Siemen D., Szewczyk A. Putative structural and functional coupling of the mitochondrial BK channel to the respiratory chain. PloS One. 2013;8 doi: 10.1371/journal.pone.0068125. [DOI] [PMC free article] [PubMed] [Google Scholar]
- 4.Beeton C., Wulff H., Standifer N.E., Azam P., Mullen K.M., Pennington M.W., Kolski-Andreaco A., Wei E., Grino A., Counts D.R., Wang P.H., Leehealey C.J., B S.A., Sankaranarayanan A., Homerick D., Roeck W.W., Tehranzadeh J., Stanhope K.L., Zimin P., Havel P.J., Griffey S., Knaus H.G., Nepom G.T., Gutman G.A., Calabresi P.A., Chandy K.G. Kv1.3 channels are a therapeutic target for T cell-mediated autoimmune diseases. Proc. Natl. Acad. Sci. U. S. A. 2006;103:17414–17419. doi: 10.1073/pnas.0605136103. [DOI] [PMC free article] [PubMed] [Google Scholar]
- 5.Beraud E., Chandy K.G. Therapeutic potential of peptide toxins that target ion channels. Inflamm. Allergy - Drug Targets. 2011;10:322–342. doi: 10.2174/187152811797200696. [DOI] [PubMed] [Google Scholar]
- 6.Bodendiek S.B., Mahieux C., Hansel W., Wulff H. 4-Phenoxybutoxy-substituted heterocycles--a structure-activity relationship study of blockers of the lymphocyte potassium channel Kv1.3. Eur. J. Med. Chem. 2009;44:1838–1852. doi: 10.1016/j.ejmech.2008.10.033. [DOI] [PMC free article] [PubMed] [Google Scholar]
- 7.Bowling J.L., Skolfield M.C., Riley W.A., Nolin A.P., Wolf L.C., Nelson D.E. Temporal integration of mitochondrial stress signals by the PINK1:Parkin pathway. BMC Mol Cell Biol. 2019;20:33. doi: 10.1186/s12860-019-0220-5. [DOI] [PMC free article] [PubMed] [Google Scholar]
- 8.Burger J.A., Gribben J.G. The microenvironment in chronic lymphocytic leukemia (CLL) and other B cell malignancies: insight into disease biology and new targeted therapies. Semin. Canc. Biol. 2014;24:71–81. doi: 10.1016/j.semcancer.2013.08.011. [DOI] [PubMed] [Google Scholar]
- 9.Cabrera-Orefice A., Yoga E.G., Wirth C., Siegmund K., Zwicker K., Guerrero-Castillo S., Zickermann V., Hunte C., Brandt U. Locking loop movement in the ubiquinone pocket of complex I disengages the proton pumps. Nat. Commun. 2018;9:4500. doi: 10.1038/s41467-018-06955-y. [DOI] [PMC free article] [PubMed] [Google Scholar]
- 10.Cahalan M.D., Chandy K.G. The functional network of ion channels in T lymphocytes. Immunol. Rev. 2009;231:59–87. doi: 10.1111/j.1600-065X.2009.00816.x. [DOI] [PMC free article] [PubMed] [Google Scholar]
- 11.Carraretto L., Teardo E., Checchetto V., Finazzi G., Uozumi N., Szabo I. Ion channels in plant bioenergetic organelles, chloroplasts and mitochondria: from molecular identification to function. Mol. Plant. 2016;9:371–395. doi: 10.1016/j.molp.2015.12.004. [DOI] [PubMed] [Google Scholar]
- 12.Checchetto V., Teardo E., Carraretto L., Leanza L., Szabo I. Physiology of intracellular potassium channels: a unifying role as mediators of counterion fluxes? Biochim. Biophys. Acta. 2016 doi: 10.1016/j.bbabio.2016.03.011. [DOI] [PubMed] [Google Scholar]
- 13.Chiang S.R., Lin C.S., Lin H.H., Shieh P.C., Kao S.H. Bergapten induces G1 arrest of nonsmall cell lung cancer cells, associated with the p53mediated cascade. Mol. Med. Rep. 2019;19:1972–1978. doi: 10.3892/mmr.2019.9810. [DOI] [PubMed] [Google Scholar]
- 14.Cholo M.C., Steel H.C., Fourie P.B., Germishuizen W.A., Anderson R. Clofazimine: current status and future prospects. J. Antimicrob. Chemother. 2012;67:290–298. doi: 10.1093/jac/dkr444. [DOI] [PubMed] [Google Scholar]
- 15.Comes N., Bielanska J., Vallejo-Gracia A., Serrano-Albarras A., Marruecos L., Gomez D., Soler C., Condom E., Ramon Y.C.S., Hernandez-Losa J., Ferreres J.C., Felipe A. The voltage-dependent K(+) channels Kv1.3 and Kv1.5 in human cancer. Front. Physiol. 2013;4:283. doi: 10.3389/fphys.2013.00283. [DOI] [PMC free article] [PubMed] [Google Scholar]
- 16.Costa R., Peruzzo R., Bachmann M., Monta G.D., Vicario M., Santinon G., Mattarei A., Moro E., Quintana-Cabrera R., Scorrano L., Zeviani M., Vallese F., Zoratti M., Paradisi C., Argenton F., Brini M., Cali T., Dupont S., Szabo I., Leanza L. Impaired mitochondrial ATP production downregulates Wnt signaling via ER stress induction. Cell Rep. 2019;28:1949–1960. doi: 10.1016/j.celrep.2019.07.050. [DOI] [PubMed] [Google Scholar]
- 17.Duprat F., Guillemare E., Romey G., Fink M., Lesage F., Lazdunski M., Honore E. Susceptibility of cloned K+ channels to reactive oxygen species. Proc. Natl. Acad. Sci. U. S. A. 1995;92:11796–11800. doi: 10.1073/pnas.92.25.11796. [DOI] [PMC free article] [PubMed] [Google Scholar]
- 18.Feske S., Wulff H., Skolnik E.Y. Ion channels in innate and adaptive immunity. Annu. Rev. Immunol. 2015;33:291–353. doi: 10.1146/annurev-immunol-032414-112212. [DOI] [PMC free article] [PubMed] [Google Scholar]
- 19.Frezza C., Cipolat S., Scorrano L. Organelle isolation: functional mitochondria from mouse liver, muscle and cultured fibroblasts. Nat. Protoc. 2007;2:287–295. doi: 10.1038/nprot.2006.478. [DOI] [PubMed] [Google Scholar]
- 20.Frezzato F., Trimarco V., Martini V., Gattazzo C., Ave E., Visentin A., Cabrelle A., Olivieri V., Zambello R., Facco M., Zonta F., Cristiani A., Brunati A.M., Moro S., Semenzato G., Trentin L. Leukaemic cells from chronic lymphocytic leukaemia patients undergo apoptosis following microtubule depolymerization and Lyn inhibition by nocodazole. Br. J. Haematol. 2014;165:659–672. doi: 10.1111/bjh.12815. [DOI] [PubMed] [Google Scholar]
- 21.Glytsou C., Calvo E., Cogliati S., Mehrotra A., Anastasia I., Rigoni G., Raimondi A., Shintani N., Loureiro M., Vazquez J., Pellegrini L., Enriquez J.A., Scorrano L., Soriano M.E. Optic atrophy 1 is epistatic to the core MICOS component MIC60 in mitochondrial cristae shape control. Cell Rep. 2016;17:3024–3034. doi: 10.1016/j.celrep.2016.11.049. [DOI] [PMC free article] [PubMed] [Google Scholar]
- 22.Gorrini C., Harris I.S., Mak T.W. Modulation of oxidative stress as an anticancer strategy. Nat. Rev. Drug Discov. 2013;12:931–947. doi: 10.1038/nrd4002. [DOI] [PubMed] [Google Scholar]
- 23.Gutman G.A., Chandy K.G., Grissmer S., Lazdunski M., Mckinnon D., Pardo L.A., Robertson G.A., Rudy B., Sanguinetti M.C., Stuhmer W., Wang X. International Union of Pharmacology. LIII. Nomenclature and molecular relationships of voltage-gated potassium channels. Pharmacol. Rev. 2005;57:473–508. doi: 10.1124/pr.57.4.10. [DOI] [PubMed] [Google Scholar]
- 24.Hao B., Chen Z.W., Zhou X.J., Zimin P.I., Miljanich G.P., Wulff H., Wang Y.X. Identification of phase-I metabolites and chronic toxicity study of the Kv1.3 blocker PAP-1 (5-(4-phenoxybutoxy)psoralen) in the rat. Xenobiotica. 2011;41:198–211. doi: 10.3109/00498254.2010.532886. [DOI] [PMC free article] [PubMed] [Google Scholar]
- 25.Jang S.H., Choi S.Y., Ryu P.D., Lee S.Y. Anti-proliferative effect of Kv1.3 blockers in A549 human lung adenocarcinoma in vitro and in vivo. Eur. J. Pharmacol. 2011;651:26–32. doi: 10.1016/j.ejphar.2010.10.066. [DOI] [PubMed] [Google Scholar]
- 26.Jorgensen C., Darre L., Vanommeslaeghe K., Omoto K., Pryde D., Domene C. In silico identification of PAP-1 binding sites in the Kv1.2 potassium channel. Mol. Pharm. 2015;12:1299–1307. doi: 10.1021/acs.molpharmaceut.5b00023. [DOI] [PubMed] [Google Scholar]
- 27.Kundu-Raychaudhuri S., Chen Y.J., Wulff H., Raychaudhuri S.P. Kv1.3 in psoriatic disease: PAP-1, a small molecule inhibitor of Kv1.3 is effective in the SCID mouse psoriasis--xenograft model. J. Autoimmun. 2014;55:63–72. doi: 10.1016/j.jaut.2014.07.003. [DOI] [PMC free article] [PubMed] [Google Scholar]
- 28.Leanza L., Henry B., Sassi N., Zoratti M., Chandy K.G., Gulbins E., Szabo I. Inhibitors of mitochondrial Kv1.3 channels induce Bax/Bak-independent death of cancer cells. EMBO Mol. Med. 2012;4:577–593. doi: 10.1002/emmm.201200235. [DOI] [PMC free article] [PubMed] [Google Scholar]
- 29.Leanza L., Romio M., Becker K.A., Azzolini M., Trentin L., Manago A., Venturini E., Zaccagnino A., Mattarei A., Carraretto L., Urbani A., Kadow S., Biasutto L., Martini V., Severin F., Peruzzo R., Trimarco V., Egberts J.H., Hauser C., Visentin A., Semenzato G., Kalthoff H., Zoratti M., Gulbins E., Paradisi C., Szabo I. Direct pharmacological targeting of a mitochondrial ion channel selectively kills tumor cells in vivo. Canc. Cell. 2017;31:516–531. doi: 10.1016/j.ccell.2017.03.003. e10. [DOI] [PubMed] [Google Scholar]
- 30.Leanza L., Trentin L., Becker K.A., Frezzato F., Zoratti M., Semenzato G., Gulbins E., Szabo I. Clofazimine, Psora-4 and PAP-1, inhibitors of the potassium channel Kv1.3, as a new and selective therapeutic strategy in chronic lymphocytic leukemia. Leukemia. 2013;27:1782–1785. doi: 10.1038/leu.2013.56. [DOI] [PubMed] [Google Scholar]
- 31.Leanza L., Zoratti M., Gulbins E., Szabo I. Induction of apoptosis in macrophages via Kv1.3 and Kv1.5 potassium channels. Curr. Med. Chem. 2012;19:5394–5404. doi: 10.2174/092986712803833281. [DOI] [PubMed] [Google Scholar]
- 32.Long S.B., Campbell E.B., Mackinnon R. Crystal structure of a mammalian voltage-dependent Shaker family K+ channel. Science. 2005;309:897–903. doi: 10.1126/science.1116269. [DOI] [PubMed] [Google Scholar]
- 33.Marzian S., Stansfeld P.J., Rapedius M., Rinne S., Nematian-Ardestani E., Abbruzzese J.L., Steinmeyer K., Sansom M.S., Sanguinetti M.C., Baukrowitz T., Decher N. Side pockets provide the basis for a new mechanism of Kv channel-specific inhibition. Nat. Chem. Biol. 2013;9:507–513. doi: 10.1038/nchembio.1271. [DOI] [PMC free article] [PubMed] [Google Scholar]
- 34.Mattarei A., Azzolini M., Zoratti M., Biasutto L., Paradisi C. N-monosubstituted methoxy-oligo(ethylene glycol) carbamate ester prodrugs of Resveratrol. Molecules. 2015;20:16085–16102. doi: 10.3390/molecules200916085. [DOI] [PMC free article] [PubMed] [Google Scholar]
- 35.Noh J., Kwon B., Han E., Park M., Yang W., Cho W., Yoo W., Khang G., Lee D. Amplification of oxidative stress by a dual stimuli-responsive hybrid drug enhances cancer cell death. Nat. Commun. 2015;6:6907. doi: 10.1038/ncomms7907. [DOI] [PubMed] [Google Scholar]
- 36.Paggio A., Checchetto V., Campo A., Menabo R., Di Marco G., Di Lisa F., Szabo I., Rizzuto R., De Stefani D. Identification of an ATP-sensitive potassium channel in mitochondria. Nature. 2019;572:609–613. doi: 10.1038/s41586-019-1498-3. [DOI] [PMC free article] [PubMed] [Google Scholar]
- 37.Panyi G., Beeton C., Felipe A. Ion channels and anti-cancer immunity. Philos. Trans. R. Soc. Lond. B Biol. Sci. 2014;369:20130106. doi: 10.1098/rstb.2013.0106. [DOI] [PMC free article] [PubMed] [Google Scholar]
- 38.Pasciak E.M., Rittichier J.T., Chen C.H., Mubarak M.S., Vannieuwenhze M.S., Peters D.G. Electroreductive dimerization of coumarin and coumarin analogues at carbon cathodes. J. Org. Chem. 2015;80:274–280. doi: 10.1021/jo502272g. [DOI] [PubMed] [Google Scholar]
- 39.Schmitz A., Sankaranarayanan A., Azam P., Schmidt-Lassen K., Homerick D., Hansel W., Wulff H. Design of PAP-1, a selective small molecule Kv1.3 blocker, for the suppression of effector memory T cells in autoimmune diseases. Mol. Pharmacol. 2005;68:1254–1270. doi: 10.1124/mol.105.015669. [DOI] [PubMed] [Google Scholar]
- 40.Serrano-Albarras A., Estadella I., Cirera-Rocosa S., Navarro-Perez M., Felipe A. Kv1.3: a multifunctional channel with many pathological implications. Expert Opin. Ther. Targets. 2018;22:101–105. doi: 10.1080/14728222.2017.1420170. [DOI] [PubMed] [Google Scholar]
- 41.Smith G.A., Tsui H.W., Newell E.W., Jiang X., Zhu X.P., Tsui F.W., Schlichter L.C. Functional up-regulation of HERG K+ channels in neoplastic hematopoietic cells. J. Biol. Chem. 2002;277:18528–18534. doi: 10.1074/jbc.M200592200. [DOI] [PubMed] [Google Scholar]
- 42.Szabo I., Bock J., Grassme H., Soddemann M., Wilker B., Lang F., Zoratti M., Gulbins E. Mitochondrial potassium channel Kv1.3 mediates Bax-induced apoptosis in lymphocytes. Proc. Natl. Acad. Sci. U. S. A. 2008;105:14861–14866. doi: 10.1073/pnas.0804236105. [DOI] [PMC free article] [PubMed] [Google Scholar]
- 43.Szabo I., Nilius B., Zhang X., Busch A.E., Gulbins E., Suessbrich H., Lang F. Inhibitory effects of oxidants on n-type K+ channels in T lymphocytes and Xenopus oocytes. Pflügers Archiv. 1997;433:626–632. doi: 10.1007/s004240050323. [DOI] [PubMed] [Google Scholar]
- 44.Szabo I., Trentin L., Trimarco V., Semenzato G., Leanza L. Biophysical characterization and expression analysis of Kv1.3 potassium channel in primary human leukemic B cells. Cell. Physiol. Biochem. 2015;37:965–978. doi: 10.1159/000430223. [DOI] [PubMed] [Google Scholar]
- 45.Szatrowski T.P., Nathan C.F. Production of large amounts of hydrogen peroxide by human tumor cells. Canc. Res. 1991;51:794–798. [PubMed] [Google Scholar]
- 46.Trnka J., Elkalaf M., Anděl M. Lipophilic triphenylphosphonium cations inhibit mitochondrial electron transport chain and induce mitochondrial proton leak. PloS One. 2015;10 doi: 10.1371/journal.pone.0121837. [DOI] [PMC free article] [PubMed] [Google Scholar]
- 47.Wirth C., Brandt U., Hunte C., Zickermann V. Structure and function of mitochondrial complex I. Biochim. Biophys. Acta. 2016;1857:902–914. doi: 10.1016/j.bbabio.2016.02.013. [DOI] [PubMed] [Google Scholar]
- 48.Wojtovich A.P., Smith C.O., Haynes C.M., Nehrke K.W., Brookes P.S. Physiological consequences of complex II inhibition for aging, disease, and the mKATP channel. Biochim. Biophys. Acta. 2013;1827:598–611. doi: 10.1016/j.bbabio.2012.12.007. [DOI] [PMC free article] [PubMed] [Google Scholar]
- 49.Wulff H., Christophersen P., Colussi P., Chandy K.G., Yarov-Yarovoy V. Antibodies and venom peptides: new modalities for ion channels. Nat. Rev. Drug Discov. 2019;18:339–357. doi: 10.1038/s41573-019-0013-8. [DOI] [PMC free article] [PubMed] [Google Scholar]
- 50.Yao Y., Xue M., Chen J., Zhang M., Huang F. An amphiphilic pillar[5]arene: synthesis, controllable self-assembly in water, and application in calcein release and TNT adsorption. J. Am. Chem. Soc. 2012;134:15712–15715. doi: 10.1021/ja3076617. [DOI] [PubMed] [Google Scholar]
- 51.Zimin P.I., Garic B., Bodendiek S.B., Mahieux C., Wulff H., Zhorov B.S. Potassium channel block by a tripartite complex of two cationophilic ligands and a potassium ion. Mol. Pharmacol. 2010;78:588–599. doi: 10.1124/mol.110.064014. [DOI] [PMC free article] [PubMed] [Google Scholar]
- 52.Zoratti M., Szabo I. The mitochondrial permeability transition. Biochim. Biophys. Acta. 1995;1241:139–176. doi: 10.1016/0304-4157(95)00003-a. [DOI] [PubMed] [Google Scholar]
Associated Data
This section collects any data citations, data availability statements, or supplementary materials included in this article.