FIG 1.
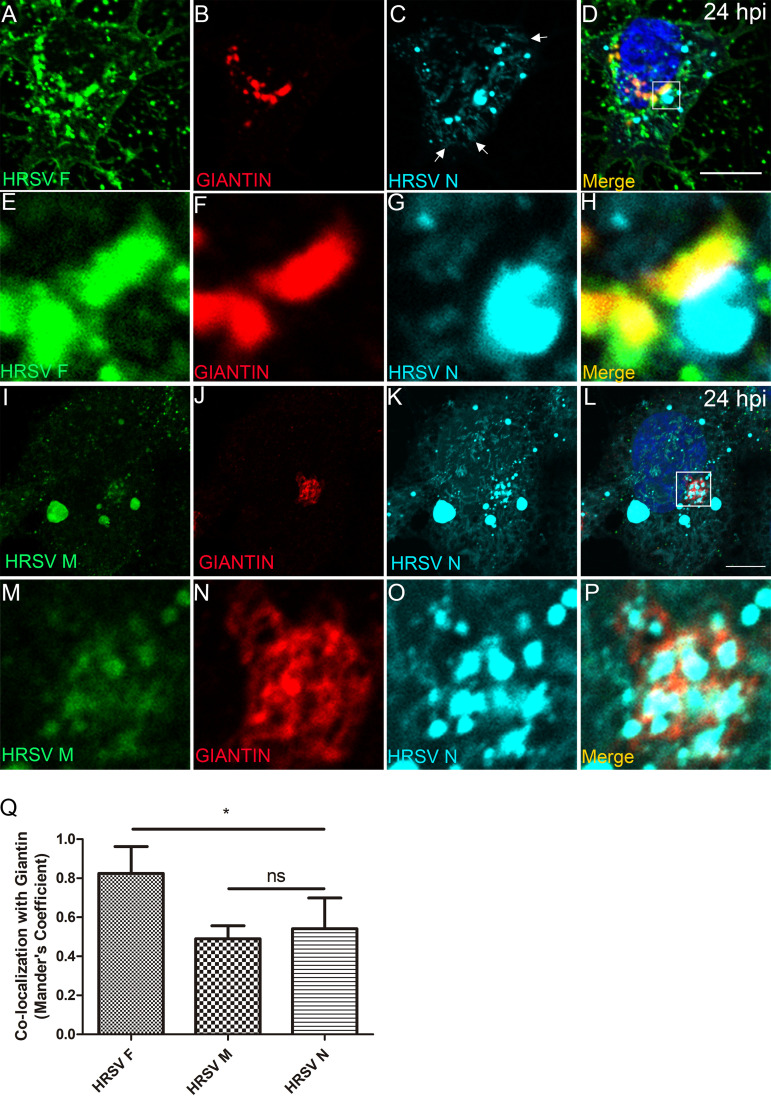
HRSV M and N proteins colocalize with the cis and medial Golgi marker giantin. (A to D) Colocalization of glycosylated HRSV F (A), giantin (B), and HRSV nonglycosylated N protein (C). (E to H) Higher magnification of panels A, B, C, and D, respectively. (I to L) Colocalization of HRSV M (I), giantin (J), and HRSV N (K). (M to P) Higher magnification of panels I, J, K, and L, respectively. (Q) Mander’s coefficient of colocalization of HRSV F (used as a positive control of colocalization with the Golgi), M, and N proteins with giantin. This set of immunofluorescence images is a single plane, representative of at least three independent experiments. The Mander’s coefficient was calculated from Z-stack images of at least five cells from three independent experiments. The P value was determined using analysis of variance (ANOVA) one-way Tukey’s multiple-comparison test. *, P < 0.05; **, P < 0.01; ***, P < 0.001; ns, nonsignificant. Images were taken at 24 hpi infection with a Zeiss 780 confocal microscope. Magnification, ×63. All scale bars = 10 μm.

