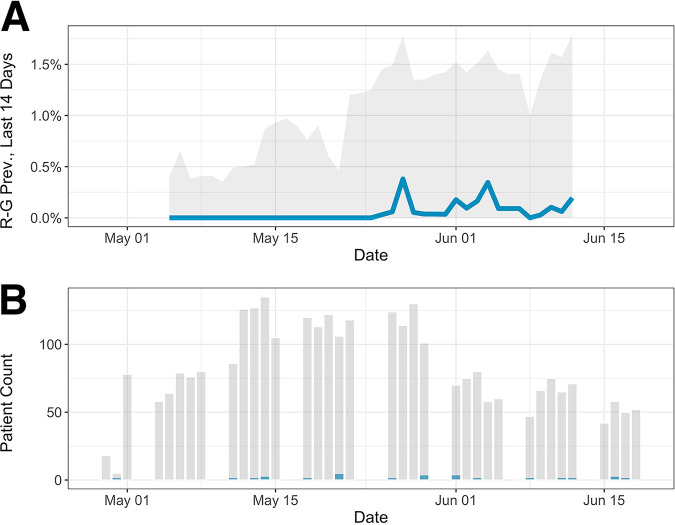
FIG 1.
Sample seroprevalence over time. (A) The vertical axis shows the 2-week moving average of Rogan-Gladen-adjusted seroprevalence (blue) with 95% bootstrap confidence intervals (gray). This averaging includes weeks where no positive tests were recorded, yielding to a temporary decline of the prevalence estimate. (B) Daily patient count (gray) and positive case counts (blue). The calendar date is shown on the horizontal axis.

