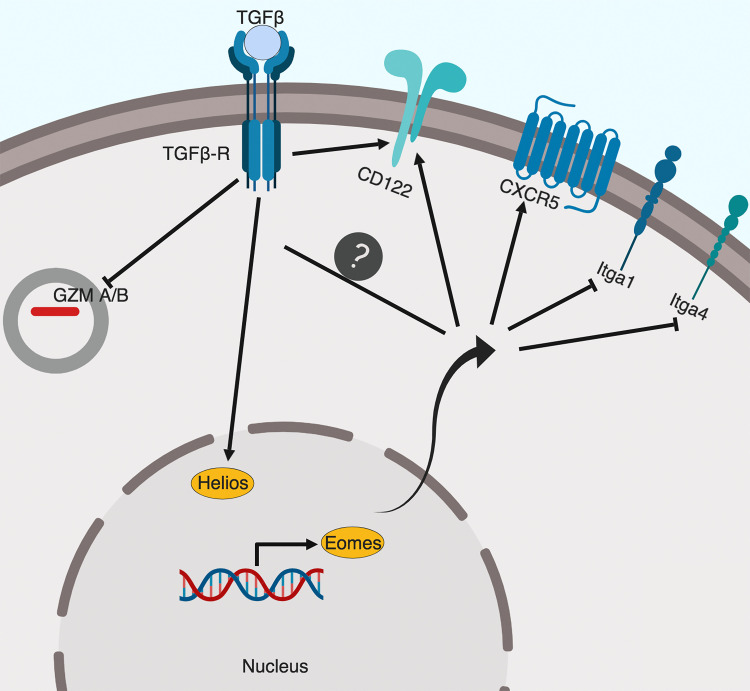
In contrast to well-studied CD4+ T reg cells, the molecular mechanisms controlling CD8+ T reg cells remain largely elusive. Here, the authors find that TGF-β signal and transcription factor Eomes cooperate to promote the function, location, and homeostasis of CD8+ T reg cells.
Abstract
In addition to Foxp3+ CD4+ regulatory T cells (CD4+ T reg cells), Foxp3− CD8+ regulatory T cells (CD8+ T reg cells) are critical to maintain immune tolerance. However, the molecular programs that specifically control CD8+ but not CD4+ T reg cells are largely unknown. Here, we demonstrate that simultaneous disruption of both TGF-β receptor and transcription factor Eomesodermin (Eomes) in T cells results in lethal autoimmunity due to a specific defect in CD8+ but not CD4+ T reg cells. Further, TGF-β signal maintains the regulatory identity, while Eomes controls the follicular location of CD8+ T reg cells. Both TGF-β signal and Eomes coordinate to promote the homeostasis of CD8+ T reg cells. Together, we have identified a unique molecular program designed for CD8+ T reg cells.
Graphical Abstract
Introduction
Regulatory T (T reg) cells are essential to maintain immune tolerance. CD4+ T reg cells expressing transcription factor Foxp3 have been established as the major T reg cell subset for decades (Josefowicz et al., 2012). In addition to CD4+ T reg cells, a CD8+ T cell population exhibiting potent regulatory activity has been identified (Kim et al., 2010; Rifa’i et al., 2004). In the naive mouse, CD8+ T reg cells do not express Foxp3 but carry typical memory CD8+ T cell markers (e.g., CD44 and CD122) and unique natural killer (NK) markers (i.e., Ly49; Kim et al., 2011). Furthermore, CD8+ T reg cells express Helios (encoded by Ikzf2), which is a transcription factor shared with thymic-derived CD4+ T reg cells and likely responsible for the establishment of their regulatory identity (Kim et al., 2015). However, the molecular mechanisms that specifically control CD8+ T reg cells but not CD4+ T reg cells remain unidentified.
Germinal center (GC) reaction is essential for the generation of high-affinity antibodies. Suppression of unwanted spontaneous GC reaction is critical to maintain immune tolerance and prevent autoimmunity. Two populations of T reg cells, including both Foxp3+ CD4+ follicular regulatory T (TFR) cells (Botta et al., 2017; Chung et al., 2011; Fu et al., 2018; Laidlaw et al., 2017; Linterman et al., 2011; Ritvo et al., 2017; Sage et al., 2014, 2016; Wing et al., 2014; Wu et al., 2016; Xu et al., 2017) and Foxp3− nonclassical MHC-I molecule Qa-1–restricted CD8+ T reg cells (Kim et al., 2010) have been identified as the negative regulators of GC reaction. Why two distinct subsets of T reg cells are required to regulate GC reaction is unknown. Extensive investigation has been focused on CD4+ TFR cells, while the regulation of CD8+ T reg cells remains elusive. A recent publication has extended the CD8+ T reg cell population from Qa-1–restricted CD8+ to include both nonclassical and classical MHC-I–restricted CD8+ T cells (Saligrama et al., 2019). Interestingly, both Qa-1– and classical MHC-I–restricted CD8+ T reg cells bear identical surface markers including both CD122 and Ly49, suggesting that a common set of signals and molecular programs controls all CD8+ T reg cells regardless of their TCR specificity (Saligrama et al., 2019). However, the molecular mechanisms controlling their homeostasis and function remain to be discovered. Therefore, CD8+ T reg cells are emerging as a key component of immune tolerance and essential to prevent autoimmunity. There is an unmet need to identify the signals essential for CD8+ T reg cells.
Here we found that mature T cell–specific simultaneous disruption of both TGF-β receptor (TGF-βR) and transcription factor Eomesodermin (Eomes) led to lethal autoimmunity due to a specific defect in CD8+ but not CD4+ T reg cells. In addition, we identified unique molecular programs downstream of TGF-β signaling and Eomes that control different features of CD8+ T reg cells. Further, in addition to a spontaneous autoimmune model, we have validated the importance of CD8+ T reg cells in an induced autoimmune model and human systemic lupus erythematosus (SLE) patients.
Results
Dramatically enhanced spontaneous GC formation in Tgfbr2−/−Eomes−/− mice
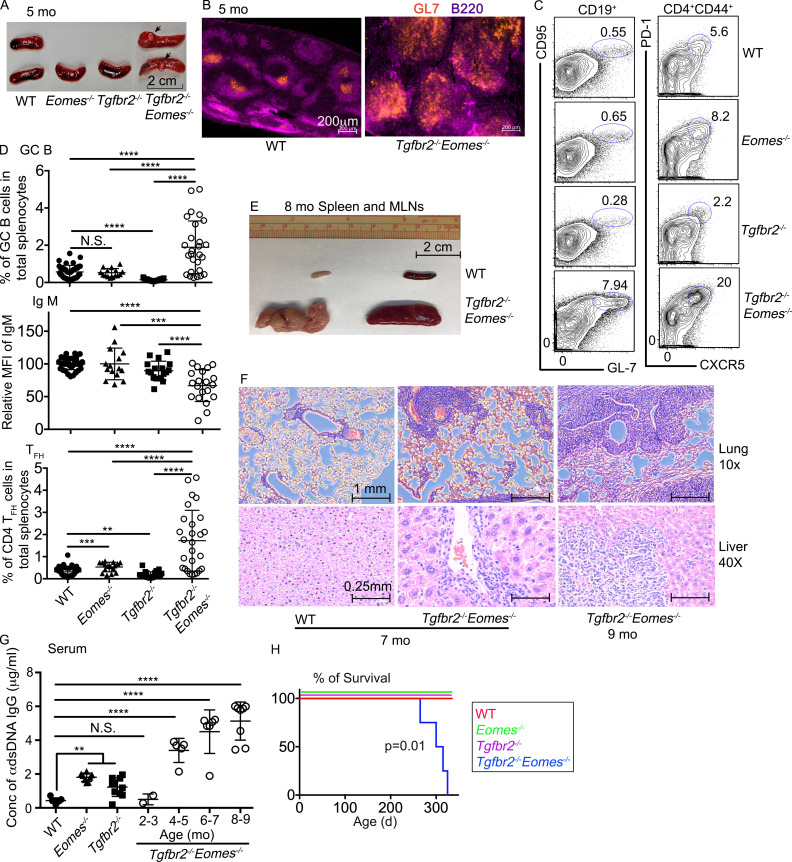
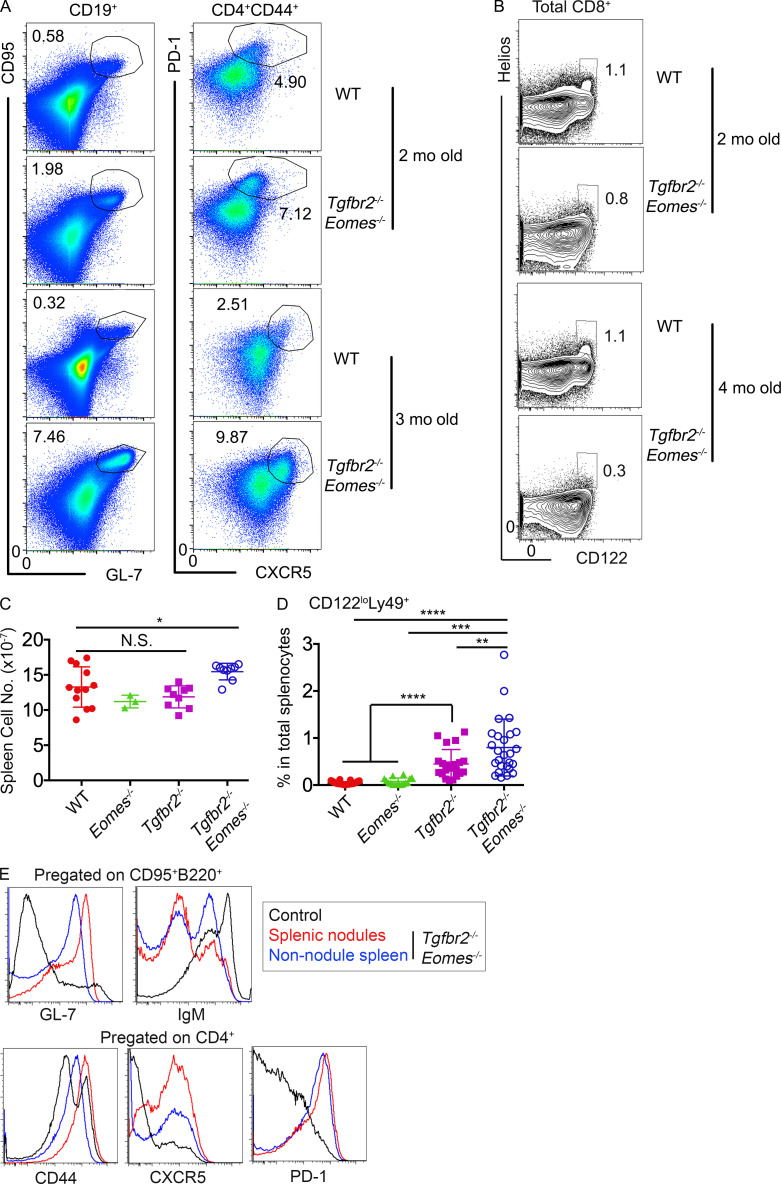
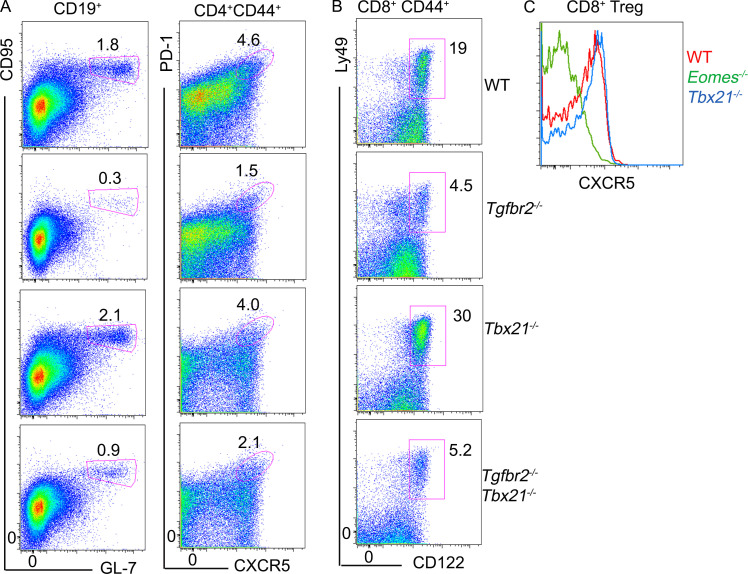
We were initially interested in the interaction between TGF-β signaling and T-box transcription factors in mature T cells. We generated a collection of mature T cell–specific conditional KO mouse strains mediated by distal Lck promoter–driven Cre recombinase (dLck-cre), including Tgfbr2f/fdLck-cre (hereafter referred to as Tgfbr2−/−; Zhang and Bevan, 2012), Eomesf/fdLck-cre (hereafter referred to as Eomes−/−), and Tgfbr2f/fEomesf/fdLck-cre (hereafter referred to as Tgfbr2−/−Eomes−/−) mice. Surprisingly, splenomegaly and light-colored nodule formation (evident to the naked eye) on the spleen were observed in 5-mo-old Tgfbr2−/−Eomes−/− mice, but not in any single KOs or WT controls (Fig. 1 A and Fig. S1 C). Large spontaneous GCs were easily identified in the spleen of 4–5-mo-old naive Tgfbr2−/−Eomes−/− mice (Fig. 1 B). Consistent with greatly enlarged spontaneous GCs, a significant increase in both GC B cells (identified as CD19+GL-7+CD95+) and T follicular helper CD4+ T cells (TFH, identified as CD4+CD44+CXCR5+PD-1+) was observed in Tgfbr2−/−Eomes−/− mice (Fig. 1, C and D). Compared with littermate controls, the enhanced spontaneous GC reactions could be detected in Tgfbr2−/−Eomes−/− mice as early as 2–3 mo of age, and no gender bias was observed (Fig. S1 A and data not shown). Moreover, when splenic nodules were dissected and separated from other splenic tissues not carrying visible nodules, enriched GC B and TFH cells were identified in the nodule samples (Fig. S1 E), suggesting that visible light-colored splenic nodules were indeed composed of large lymphoid follicles and GCs. To be noted, dramatically enhanced GC reaction was only detected in Tgfbr2−/−Eomes−/− mice. The alteration of GC reactions in single KOs was rather subtle. Consistent with the role of TGF-β as a positive regulator for TFH cell differentiation in both mouse and human (Locci et al., 2016; Marshall et al., 2015; Schmitt et al., 2014), spontaneous GC was slightly but significantly reduced in naive Tgfbr2−/− mice (Fig. 1, C and D). Interestingly, naive Eomes−/− mice carried a slightly increased population of TFH cells while the GC B cell population was apparently normal (Fig. 1, C and D). Furthermore, this dramatic phenotype was restricted to TGF-βR and Eomes double KO animals, while TGF-βR and T-bet (encoded by Tbx21) double KOs were largely normal without any notable GC phenotypes (Fig. S2 A).
Figure 1.
Dramatically enhanced spontaneous GC reaction in Tgfbr2−/−Eomes−/− mice. (A–D) The results from 5-mo-old mice are shown. (A) Representative picture of spleens. Arrows and circles indicate light-colored nodules on Tgfbr2−/−Eomes−/− spleens. (B) Representative images (n = 5) of WT and Tgfbr2−/−Eomes−/− spleens. (C) Representative FACS plots of pregated CD19+ (left) and CD4+CD44+ (right) splenic lymphocytes. (D) The percentage of GC B cells (CD19+CD95+GL-7+) in total splenic lymphocytes (top), mean fluorescence intensity (MFI) of IgM on B cells relative to the average value from WT controls in the same experiment (relative MFI, middle), and the percentage of CD4+ TFH cells (CD4+CD44+PD-1+CXCR5+) in total splenic lymphocytes (bottom) are shown. (E) Representative picture of spleen and mesenteric lymph nodes from 8-mo-old WT and Tgfbr2−/−Eomes−/− mice (n = 5). (F) Hematoxylin and eosin staining of lung and liver sections from 7–9-mo-old WT and Tgfbr2−/−Eomes−/− mice (n = 3). (G) Concentration (Conc) of serum anti-dsDNA IgG. (H) Survival curve (n = 11 for each group). Each symbol in D and G represents the results from an individual animal; bar graphs indicate the mean (± SEM). N.S., not significant; **, P < 0.01; ***, P < 0.001; ****, P < 0.0001 by one-way ANOVA with Tukey multi-comparison posttest for D and G. Mantel–Cox test was used for survival curve in H. Representative results from 3 (B, E, and F) or 10 (A and C) independent experiments are shown. Pooled results from 10 (D) or 3 (G) independent experiments are shown. For A, C, and D, WT, n = 41; Eomes−/−, n = 15; Tgfbr2−/−, n = 23; and Tgfbr2−/−Eomes−/−, n = 27. For G, WT, n = 7; Eomes−/−, n = 8; Tgfbr2−/−, n = 10; and Tgfbr2−/−Eomes−/−, n = 2 (2–3 mo), 5 (4–5 mo), 6 (6–7 mo), and 8 (8–9 mo).
Figure S1.
Extended characterization of Tgfbr2−/−Eomes−/− mice. (A) Representative FACS plots of B cells (left, to show GC B cells) and CD44hiCD4+ T cells (right, to show TFH cells) in 2- and 3-mo-old WT and Tgfbr2−/−Eomes−/− spleens. (B) Representative FACS profiles of CD8+ in 2- and 4-mo-old WT and Tgfbr2−/−Eomes−/− spleens. Representative results from three independent experiments (n = 6) are shown in A and B. (C) Total cell number of the spleen. (D) The percentage of CD122loLy49+CD8+ T cells in total splenocytes. Pooled results from three (C) or six (D) independent experiments are shown. WT, n = 12 (C) or 43 (D); Eomes−/−, n = 3 (C) or 16 (D); Tgrbr2−/−, n = 9 (C) or 21 (D); and Tgfbr2−/−Eomes−/−, n = 9 (C) or 26 (D). (E) Visible splenic nodules were dissected and compared with nonnodule splenic tissues from a 6-mo-old Tgfbr2−/−Eomes−/− mouse. FACS profiles of pregated activated B cells (top) and CD4+ T cells (bottom) are shown. Representative results from two independent experiments are shown (n = 3). Each symbol in C and D represents the results from an individual animal. N.S., not significant; *, P < 0.05; **, P < 0.01; ***, P < 0.001; ****, P < 0.0001 by Student’s t test.
Figure S2.
T-bet deficiency does not impact GC reaction or CD8+ T reg cells. Representative FACS profiles of splenocytes isolated from 5-mo-old mice. Tgfbr2−/− mice have been described in the main text; Tbx21−/− mice are Tbx21f/fdLck-cre mice; and Tgfbr2−/−Tbx21−/− mice are Tgfbr2f/fTbx21f/fdLck-cre mice. (A) Left: Pregated B cells to show GC B cells. Right: Pregated CD44+CD4+ T cells to show TFH cells. (B) Pregated CD44+CD8+ T cells to show CD8+ T reg cells. (C) Pregated CD8+ T reg cells to show CXCR5 expression. Representative results from three independent experiments are shown (n = 3 for each genotype).
As a result of spontaneous GC reaction, a significant increase in the population of IgMlo/− class-switched B cells and elevated levels of anti–double-stranded DNA (dsDNA) autoantibodies were detected in Tgfbr2−/−Eomes−/− mice (Fig. 1, D and G). The gradual increase of anti-dsDNA antibodies was correlated with an age-dependent expansion of spontaneous GC reactions in Tgfbr2−/−Eomes−/− mice (Fig. 1, C, D, and G; and Fig. S1 A). By the age of 7–9 mo, Tgfbr2−/−Eomes−/− mice exhibited dramatically enlarged spleen and lymph nodes (Fig. 1 E). All Tgfbr2−/−Eomes−/− mice, but none of the single KOs nor WT control animals, died around 9–11 mo of age (Fig. 1 H). Massive leukocyte infiltration in vital organs was only observed in Tgfbr2−/−Eomes−/− mice (Fig. 1 F). Together, we discovered uncontrolled GC reaction in the mice lacking both Tgfbr2 and Eomes expression in mature T cells.
Apparently normal CD4+ TFR in Tgfbr2−/−Eomes−/− mice
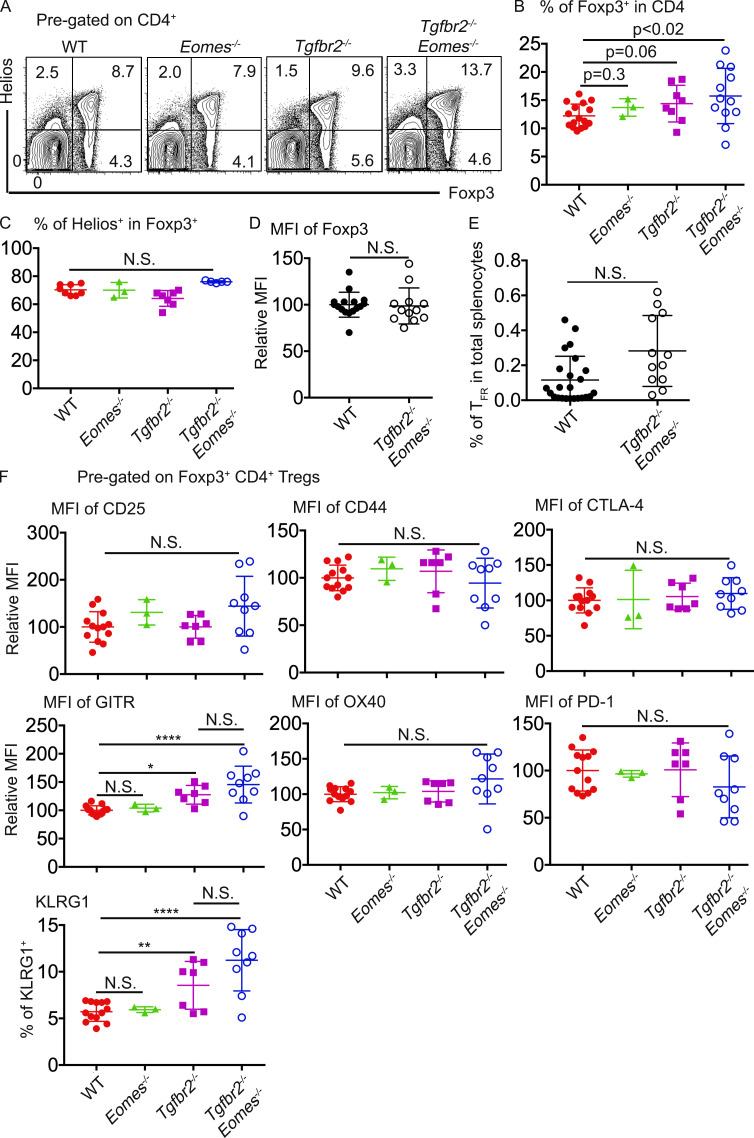
To investigate the mechanisms underlying the uncontrolled GC reaction, we first focused on CD4+Foxp3+ T reg cells. Consistent with previous findings that TGF-β negatively controls the homeostasis of T reg cells (Sledzińska et al., 2013), total Foxp3+CD4+ T reg cells were slightly but consistently increased in both Tgfbr2−/− and Tgfbr2−/−Eomes−/− mice (Fig. 2, A and B). When focused on CXCR5+PD-1+Foxp3+ TFR cells, no significant difference was detected in Tgfbr2−/−Eomes−/− mice compared with WT mice (Fig. 2 E). Transcription factor Helios is highly expressed in thymic-derived Foxp3+CD4+ T reg cells (Kim et al., 2015; Thornton and Shevach, 2019). No defective expression of Helios was observed in CD4+Foxp3+ T cells isolated from Tgfbr2−/−Eomes−/− mice (Fig. 2 C). Further, to confirm the regulatory phenotypes of CD4+ T reg cells, we examined a panel of markers commonly associated with CD4+ T reg cells. We did not detect any change in the expression levels of Foxp3 (Fig. 2 D), CD25, CD44, CTLA-4, OX40, or PD-1 (Fig. 2 F). We did observe a slight but significant increase of GITR (glucocorticoid-induced TNFR-related) and KLRG1 expression in the CD4+ T reg cells isolated from both Tgfbr2−/− and Tgfbr2−/−Eomes−/− mice (Fig. 2 F). Overall, the regulatory phenotype of CD4+ T reg cells is largely intact in Tgfbr2−/−Eomes−/− mice. Together, even though TGF-β limits the total Foxp3+CD4+ T reg cells, the impacts were similar in both Tgfbr2−/− and Tgfbr2−/−Eomes−/− mice, and no double KO–specific defects were found in CD4+ T reg cells, including TFR cells.
Figure 2.
Apparently normal CD4+ T reg cells in Tgfbr2−/−Eomes−/− mice. (A) Representative FACS profiles of pregated CD4+ T cells isolated from 4–6-mo-old mice. (B) The percentage of Foxp3+ cells in CD4+ T cells. (C) The percentage of Helios+ cells in Foxp3+ CD4+ T reg cells. (D) Relative MFI of Foxp3 in pregated CD4+ T reg cells. (E) The percentage of CD4+ TFR cells (CD4+Foxp3+PD-1+CXCR5+) in total splenocytes. (F) A panel of CD4+ T reg cell–related markers on pregated Foxp3+CD4+ T cells. Each symbol in B to F represents the results from an individual animal. N.S., not significant; *, P < 0.05; **, P < 0.01; ****, P < 0.0001 by one-way ANOVA with Tukey multi-comparison posttest (C and F) or Student’s t test (B, D, and E). Representative results from four independent experiments are shown in A. Pooled results from four (B, C, D, and F) or five (E) independent experiments are shown. WT, n = 18 (A and B), 11 (C), 16 (D), 24 (E), or 13 (F); Eomes−/−, n = 3 (A, B, C, and F); Tgfbr2−/−, n = 8 (A and B) or 7 (C and F); and Tgfbr2−/−Eomes−/−, n = 14 (A and B), 7 (C), 12 (D and E), or 9 (F).
CD8+ T reg cell subset is specifically depleted in Tgfbr2−/−Eomes−/− mice
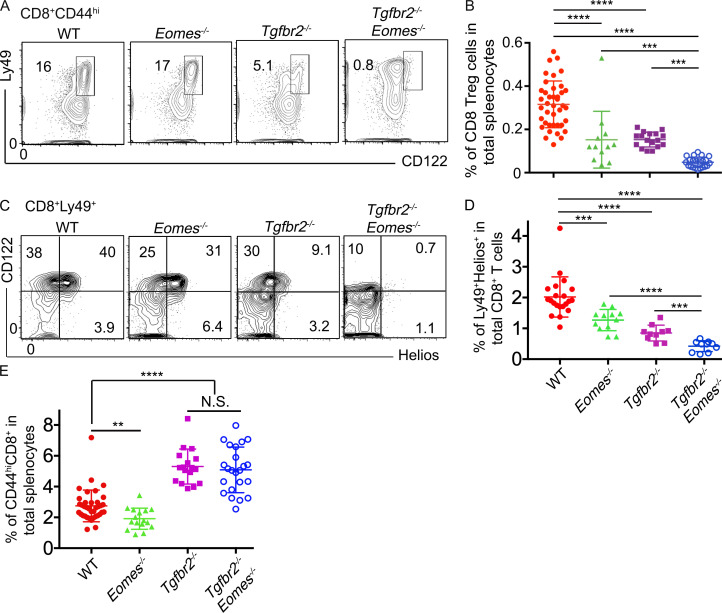
In addition to CD4+ TFR cells, CD8+ T reg cells function as another essential regulator of GC reaction (Kim et al., 2010). CD8+ T reg cells can be conveniently identified by the coexpression of Ly49 and CD122 within CD44hi memory-like CD8+ T cells (Kim et al., 2011). Surprisingly, Ly49+CD122hi CD8+ T cells almost disappeared in Tgfbr2−/−Eomes−/− mice and slightly but significantly reduced in both single KO mice at 5 mo of age (Fig. 3, A and B). Interestingly, a Ly49+CD122loCD8+ T cell subset appeared in both Tgfbr2−/− and Tgfbr2−/−Eomes−/− mice (Fig. 3 A and Fig. S1 D). To rule out the possibility that CD8+ T reg cells only down-regulate CD122 expression in the absence of TGF-β signal, a different set of staining was performed to focus on Helios, the only transcription factor identified for CD8+ T reg cells (Fig. 3, C and D). A clear subset of Helios+ cells was identified in both WT and Eomes−/− CD8+Ly49+ T cell populations, and most Helios+ cells were CD122hi (Fig. 3 C). In Tgfbr2−/− mice, Helios+ cells were substantially reduced, and in Tgfbr2−/−Eomes−/− mice, this cell subset essentially disappeared regardless of CD122 levels (Fig. 3, C and D). Even though Helios+ cells exhibited an apparently normal percentage in pregated Ly49+CD8+ T cells in Eomes−/− mice (Fig. 3 C), total Helios+ cells were significantly decreased (Fig. 3 D) due to the reduction of memory-like CD44hiCD8+ T cells in the absence of Eomes (Fig. 3 E). Therefore, both sets of staining confirmed that the CD8+ T reg cell population was significantly reduced in single KOs and almost completely abolished in 5-mo-old Tgfbr2−/−Eomes−/− mice.
Figure 3.
CD8+ T reg cells are severely defective in Tgfbr2−/−Eomes−/− mice. The results from 4–5-mo-old mice are shown. (A) Representative FACS plots of pregated CD8+CD44hi T cells. (B) The percentage of Ly49+CD122hiCD44hi CD8+ cells in total splenocytes. (C) Representative FACS plots of pregated CD8+Ly49+ T cells. (D) The percentage of Ly49+Helios+ cells in total CD8+ T cells. (E) The percentage of CD44hiCD8+ cells in spleen. Representative results from 6 (C) or 10 (A) independent experiments are shown. Pooled results from 6 (D) or 10 (B and E) independent experiments are shown. Each symbol in B, D, and E represents the results from an individual animal. N.S., not significant; **, P < 0.01; ***, P < 0.001; ****, P < 0.0001 by one-way ANOVA with Tukey multi-comparison posttest (E) or Student’s t test (B and D). WT, n = 41 (A and B), 21 (C and D), or 37 (E); Eomes−/−, n = 13 (A and B), 12 (C and D), or 16 (E); Tgfbr2−/−, n = 17 (A, B, and E) or 10 (C and D); and Tgfbr2−/−Eomes−/−, n = 22 (A and B), 10 (C and D), or 23 (E).
Further, in contrast to slightly increased Foxp3+CD4+ T reg cells, Helios+CD8+ T reg cells were slightly reduced in 2-mo-old Tgfbr2−/−Eomes−/− mice and continued to decrease as they aged (Fig. S1 B). Consistent with the facts that Tgfbr2−/−Eomes−/− mice, but not Tgfbr2−/−Tbx21−/− mice, exhibited an uncontrolled GC reaction, Tgfbr2−/−Tbx21−/− mice carried a similar population of CD8+ T reg cells as Tgfbr2−/− mice (Fig. S2). Together, concurrently with spontaneous GC reaction, a dramatically defective CD8+ T reg cell population was detected in Tgfbr2−/−Eomes−/− mice.
Adoptive transfer of a small number of WT CD8+ T reg cells completely abolished spontaneous GC response in Tgfbr2−/−Eomes−/− mice
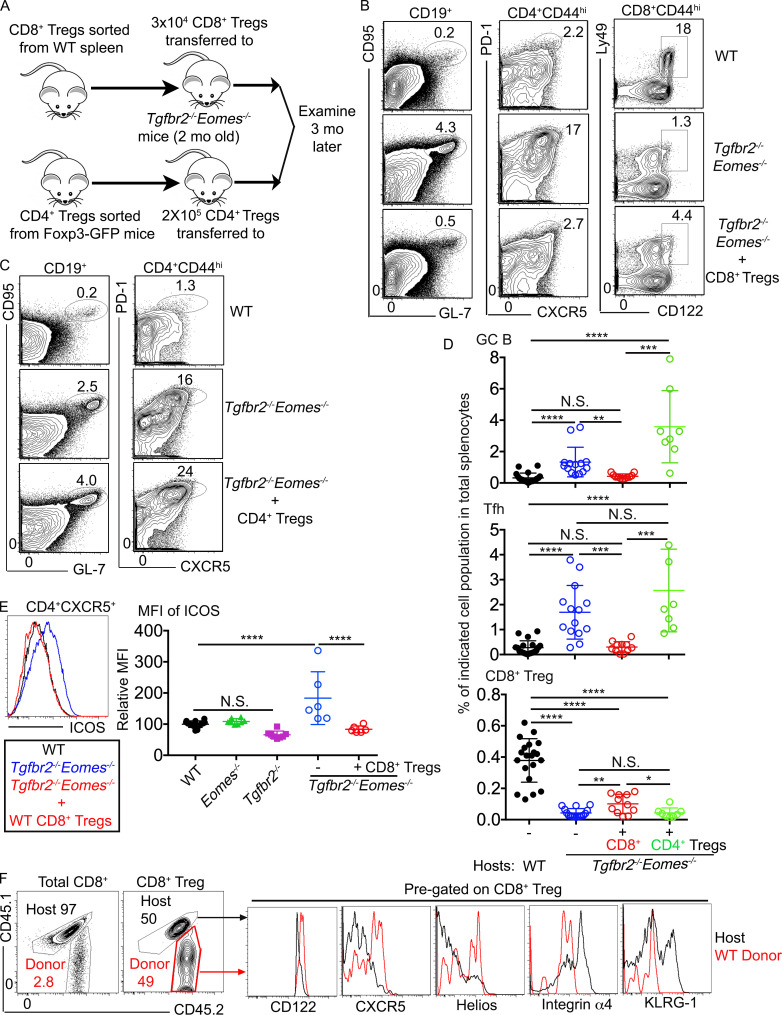
To determine if the defects in CD8+ T reg cells were responsible for the spontaneous GC development in Tgfbr2−/−Eomes−/− mice, rescue experiments were performed. Briefly, Ly49+CD122hiCD8+ T reg cells were FACS-sorted from the spleen of WT mice and 3 × 10⁴ cells intravenously injected into un-irradiated sex-matched 2-mo-old Tgfbr2−/−Eomes−/− mice before dramatically enhanced GC reaction occurred. Spleens of the recipient mice were harvested 3 mo after cell transfer (i.e., when all mice reached 5 mo old), and the GC reaction and Ly49+CD122hiCD8+ T cells were compared with those of WT control and Tgfbr2−/−Eomes−/− mice without CD8+ T reg cell transfer (illustrated in Fig. 4 A). Indeed, the percentages of GC B and CD4+ TFH cells as well as ICOS (inducible T cell co-stimulator) expression on CD4+ T cells were comparable between WT mice and Tgfbr2−/−Eomes−/− mice that had received CD8+ T reg cells, suggesting that elevated GC response in Tgfbr2−/−Eomes−/− mice was completely corrected by one-time adoptive transfer of a small number of WT CD8+ T reg cells. Even though the CD8+ T reg cell population was not completely rescued, a significant increase in Ly49+CD122hiCD8+ T cells was observed in treated Tgfbr2−/−Eomes−/− mice (Fig. 4, B, D, and E). Using congenically marked donor cells, we were able to confirm that WT donor-derived CD8+ T cells survived and represented a significant portion of the Ly49+CD122hiCD8+ T cells 3 mo after cell transfer in Tgfbr2−/−Eomes−/− mice (Fig. 4 F). Further, compared with WT donor cells, host-derived Tgfbr2−/−Eomes−/− CD8+ T reg cells expressed lower levels of CD122, CXCR5, and Helios while carrying higher levels of integrin α4 and KLRG1 (Fig. 4 F; and the expression of CD8+ T reg cell–associated markers will be further discussed in Fig. 6, Fig. 7, and Fig. 8). Importantly, similar transfer of a higher number of Foxp3+CD4+ T reg cells into young Tgfbr2−/−Eomes−/− mice resulted in no detectable impacts on spontaneous GC reaction (illustrated in Fig. 4 A; and results shown in Fig. 4, C and D). Thus, we have demonstrated that defective CD8+ T reg cells, but not CD4+ T reg cells, are responsible for uncontrolled spontaneous GC reaction in Tgfbr2−/−Eomes−/− mice.
Figure 4.
Adoptive transfer of WT CD8+ T reg cells completely corrects spontaneous GC reaction in Tgfbr2−/−Eomes−/− mice. (A) Schematic of the experiments. Representative FACS plots of pregated CD19+ (left), CD4+CD44+ (middle), and CD44hiCD8+ (right in B) splenocytes 3 mo after adoptive WT CD8+ T reg cell transfer (B) or after CD4+ T reg cell transfer (C). (D) The percentage of GC B cells (top), CD4+ TFH cells (middle), and CD8+ T reg cells (bottom) in the spleens. (E) Representative FACS profiles of pregated CD4+CXCR5+ T cells (left) and relative MFI of ICOS on pregated CD44hiCD4+ T cells. (F) Representative FACS profiles from the Tgfbr2−/−Eomes−/− mice who had received WT cells 3 mo before show congenic marker labeled donor cells. Each symbol in D and E represents the results from an individual animal. N.S., not significant; *, P < 0.05; **, P < 0.01; ***, P < 0.001; ****, P < 0.0001 by one-way ANOVA with Tukey multi-comparison posttest (E) or Student’s t test (D). Pooled (D) or representative (B and F) results from four or two (E) independent CD8+ T reg cell transfer experiments are shown. Pooled (D) or representative (C) results from two independent CD4+ T reg cell transfer experiments are shown. In total, for B, C, D, and F, WT, n = 20; Tgfbr2−/−Eomes−/−, n = 14; Tgfbr2−/−Eomes−/−+CD8+ T reg cells, n = 11; Tgfbr2−/−Eomes−/−+CD4+ T reg cells, n = 8. For E, WT, n = 14; Eomes−/−, n = 8; Tgfbr2−/−, n = 8; Tgfbr2−/−Eomes−/−, n = 6; and Tgfbr2−/−Eomes−/−+CD8+ T reg cells, n = 6.
Figure 6.
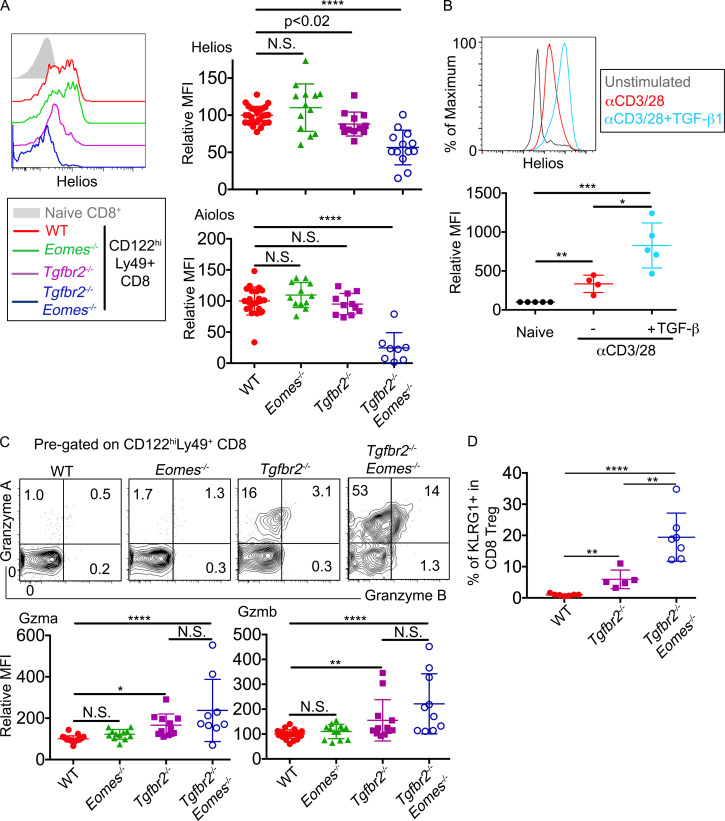
A TGF-β–dependent genetic program controls the regulatory identity of CD8+ T reg cells. (A) Left: Representative FACS plots to show the expression of Helios in pregated Ly49+CD122hi CD8+ T cells isolated from the spleens. Right: MFI of Helios (top) and Aiolos (bottom) in pregated Ly49+CD122hi CD8+ T cells relative to the average value of WT controls in the same experiments. (B) Representative FACS plot (top) and relative MFI (bottom) of Helios expression in WT CD8+ T cells after 3 d in vitro αCD3/28±hTGF-β1 stimulation. (C) Representative FACS plot of pregated CD8+ T reg cells are shown (top). Relative MFI of Granzyme A (GzmA; bottom left) and Granzyme B (GzmB; bottom right) of pregated CD8+ T reg cells are shown. (D) The percentage of KLRG1+ cells in pregated CD8+ T reg cells. Pooled results from three (B and D) or six (A and C) independent experiments are shown. All mice are 3–6 mo of age. Each symbol represents the results from an individual animal. WT, n = 26 (Helios in A), 22 (Aiolos in A), 23 (GzmA in C), 24 (GzmB in C), or 7 (D); Eomes−/-, n = 13 (Helios in A and GzmB in C) or 12 (Aiolos in A and GzmA in C); Tgfbr2−/−, n = 12 (Helios in A and GzmB in C), 11 (Aiolos in A and GzmA in C), or 5 (D); and Tgfbr2−/−Eomes−/−, n = 13 (Helios in A), 8 (Aiolos in A), 9 (GzmA in C), 10 (GzmB in C), or 7 (D). In B, naive group, n = 5; stimulated groups, n = 4 (without TGF-β) or 5 (plus TGF-β). N.S., not significant; *, P < 0.05; **, P < 0.01; ***, P < 0.001; ****, P < 0.0001 by one-way ANOVA with Tukey multi-comparison posttest (GzmA in C) or Student’s t test (A, B, GzmB in C, and D).
Figure 7.
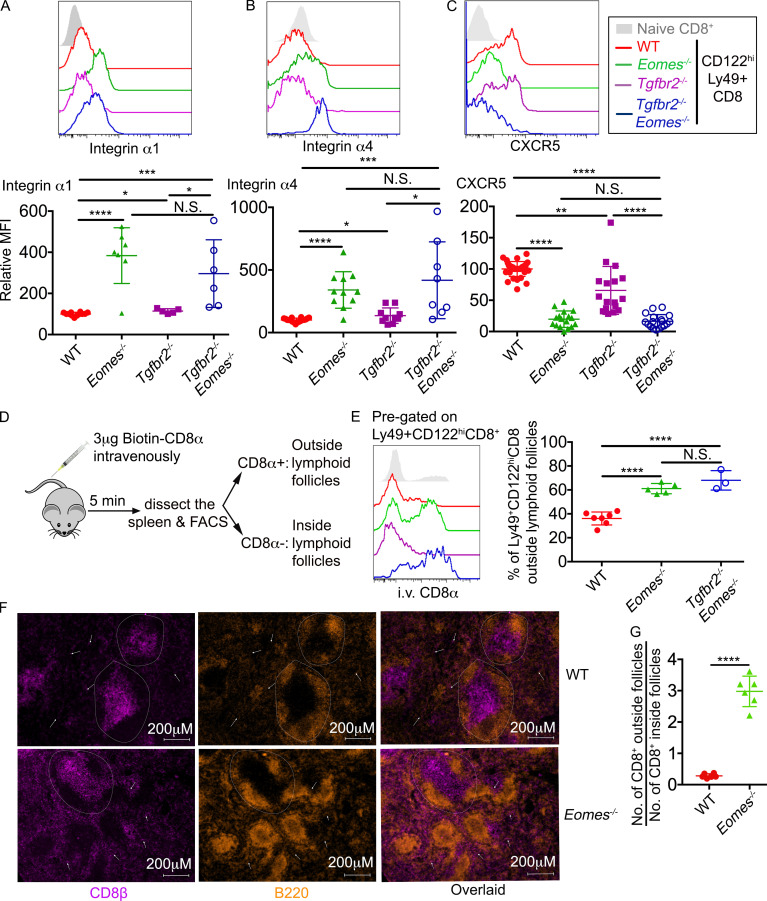
An Eomes-dependent genetic program controls the location of CD8+ T reg cells. (A–C) The expression of integrin α1 (A), integrin α4 (B), and CXCR5 (C) on pregated CD8+ T reg cells are shown. Pooled results from six independent experiments are shown (A–C). (D) Schematic of intravascular labeling of CD8+ T cells. (E) Representative FACS plot of pregated CD8+ T reg cells (seft) and pool results from three independent experiments (right) are shown. (F) Representative images of WT and Eomes−/− spleen (n = 3). Dashed circles provide examples of follicles. White arrows indicate CD8+ T cells outside follicles. (G) The ratio of CD8+ T cell number outside vs. inside follicles. Each number was calculated from an area of 2.39 mm2 containing two to seven follicles. Representative (F) or pooled results (G) from two independent experiments are shown with a total of 20 WT and 20 Eomes−/− follicles analyzed. All mice are 3–6 mo of age. Each symbol represents the results from an individual animal. N.S., not significant; *, P < 0.05; **, P < 0.01; ***, P < 0.001; ****, P < 0.0001 by one-way ANOVA with Tukey multi-comparison posttest (E) or Student’s t test (A, B, C, and G). WT, n = 12 (A), 18 (B), 34 (C), or 7 (E); Eomes−/−, n = 7 (A), 11 (B), 17 (C), or 5 (E); Tgfbr2−/−, n = 5 (A), 10 (B), or 17 (C); Tgfbr2−/−Eomes−/−, n = 6 (A), 8 (B), 18 (C), or 3 (E).
Figure 8.
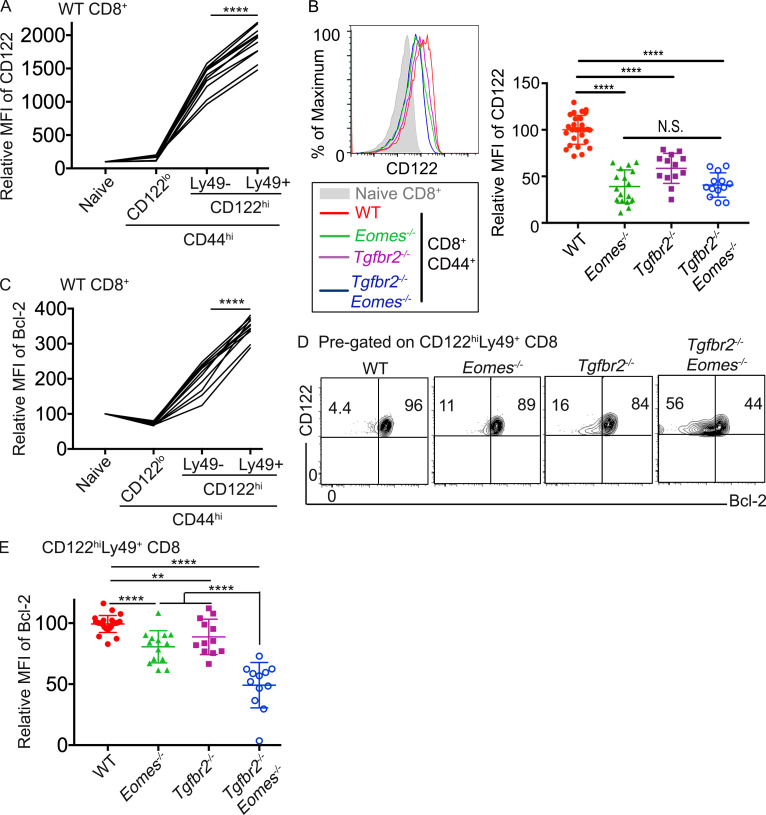
TGF-β and Eomes coordinate to promote the survival of CD8+ T reg cells. (A) Relative MFI of CD122 in different subsets of CD8+ T cells in naive WT spleen is shown (n = 11). (B) CD122 expression on pregated CD44hiCD8+ T cells. (C) Relative MFI of Bcl-2 in different subsets of CD8+ T cells in naive WT spleen (n = 11). (D) Representative FACS profiles of pregated CD8+ T reg cells. (E) Relative MFI of Bcl-2 in pregated CD8+ T reg cells. Each line in A and C and each symbol in B and E represents the results from an individual mouse; bar graphs indicate the mean (± SEM). All mice are 3–6 mo of age. Pooled results from three (A and C) or six (B and E) independent experiments are shown. N.S., not significant; **, P < 0.01; ****, P < 0.0001 by paired (A and C) or unpaired (B and E) Student’s t test. WT, n = 27 (B) or 26 (D and E); Eomes−/−, n = 17 (B) or 15 (D and E); Tgfbr2−/−, n = 13 (B) or 12 (D and E); and Tgfbr2−/−Eomes−/−, n = 13 (B) or 12 (D and E).
Distinct behavior of CD8+ vs. CD4+ T reg cells during inflammatory responses
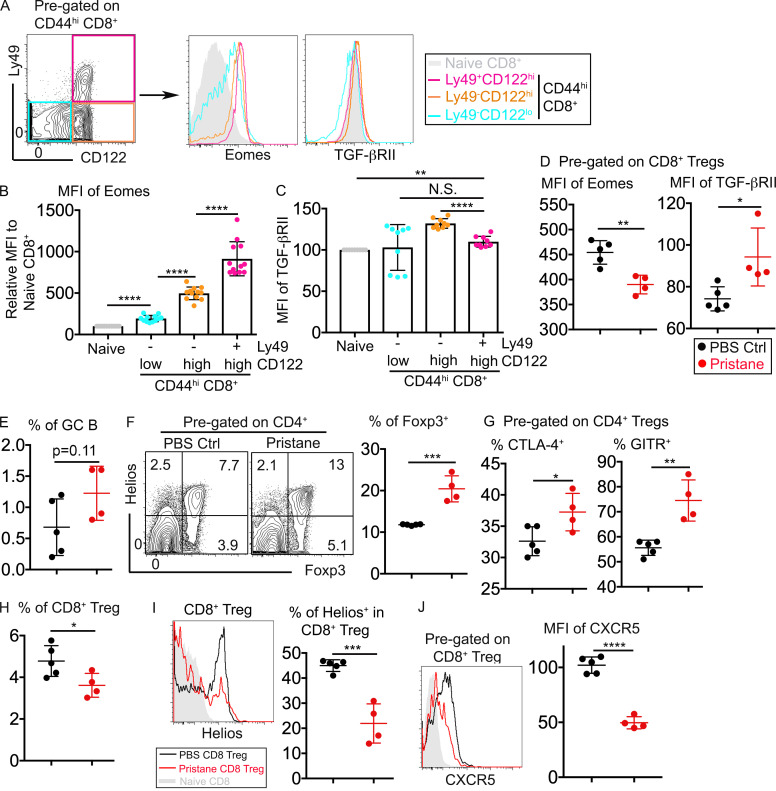
Using Tgfbr2−/−Eomes−/− mice, we have demonstrated that CD8+ T reg cells play nonredundant roles in controlling spontaneous GC reaction. To further characterize CD8+ T reg cells, we first focused on the expression of Tgfbr2 and Eomes in WT CD8+ T reg cells. In naive WT mice, CD8+ T reg cells carried the highest expression levels of Eomes among all CD8+ subsets (Fig. 5, A and B). In contrast, only a small difference was detected in the expression of TGF-βRII among CD8+ subsets (Fig. 5, A and C). Further, we employed the well-established pristane-induced autoimmune model in mouse (Li et al., 2017). Single injection of pristane induces elevated GC reaction and lupus-like autoimmunity within a 6-mo time period. Interestingly, at a very early stage of pristane-induced autoimmunity (i.e., 6 wk after pristane injection), when GC reaction was not significantly increased (Fig. 5 E), the expression of Eomes was significantly reduced while TGF-βRII expression was increased in CD8+ T reg cells (Fig. 5 D). A slight but significant reduction of CD8+ T reg cells was observed after pristane injection (Fig. 5 H). Furthermore, remaining CD8+ T reg cells carried reduced levels of Helios and CXCR5 (Fig. 5, I and J), suggesting reduced function of the remaining CD8+ T reg cells (to be discussed related to Fig. 6 and Fig. 7). In stark contrast, the CD4+ T reg cell population was significantly increased after pristane injection (Fig. 5 F). On a per cell basis, CD4+ T reg cells carried higher levels of CTLA-4 and GITR, suggesting enhanced regulatory activity after pristane injection (Fig. 5 G).
Figure 5.
Distinct responses of CD8+ vs. CD4+ T reg cells upon pristane challenge. (A) Gating strategy of memory-like CD8+ T cells (left) and the expression of Eomes and TGF-βRII on different subsets of CD8+ T cells isolated from WT spleen. (B) MFI of Eomes. (C) MFI of TGF-βRII on different subsets of WT CD8+ T cells. Representative (A) or pooled (B and C) results from four independent experiments are shown (n = 12). (D) MFI of Eomes (left) and TGF-βRII (right) on pregated CD8+ T reg cells. (E) The percentage of GC B cells. (F) FACS profiles of pregated CD4+ T cells (left) and the percentage of Foxp3+ within CD4+ T cells (right). (G) Expression of CTLA-4 (left) or GITR (right) on pregated Foxp3+CD4+ T reg cells. (H) The percentage of CD8+ T reg cells within CD8+ T cells. (I and J) The expression of Helios (I) or CXCR5 (J) on pregated CD8+ T reg cells. Pooled results from two independent experiments are shown in D–J. PBS group, n = 5; pristane group, n = 4. Each symbol in B–J represents the results from an individual mouse. N.S., not significant; *, P < 0.05; **, P < 0.01; ***, P < 0.001; ****, P < 0.0001 by paired (B and C) or unpaired (D–J) Student’s t test. Ctrl, control.
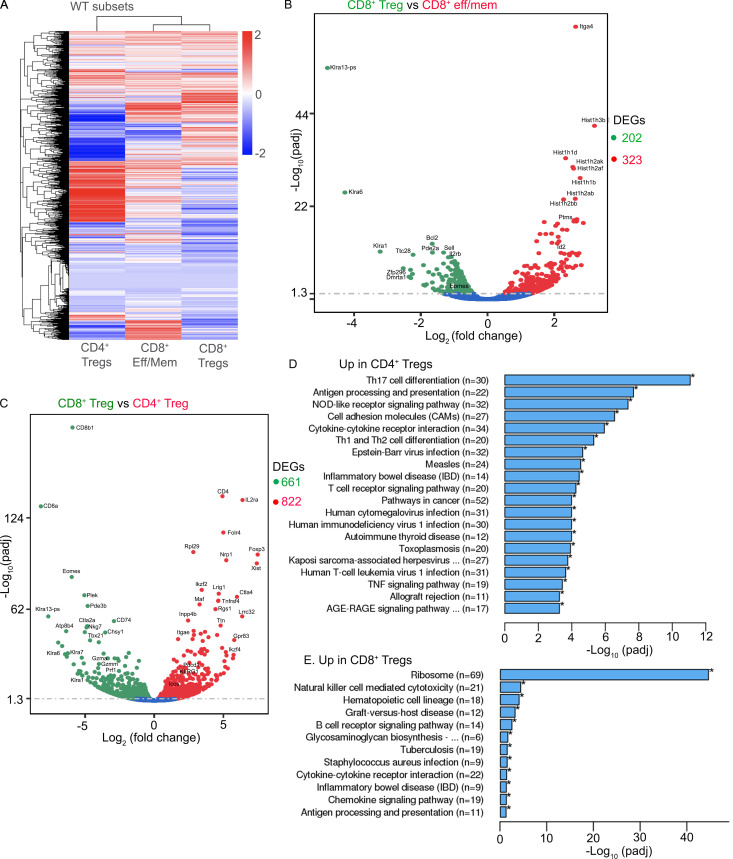
In addition, we performed global transcription analysis on CD4+ T reg cells, CD8+ T reg cells, and effector/memory-like CD8+ T cells (i.e., CD44hiCD49dhi) sorted from naive WT mice. Even though both CD8+ T reg cells and the majority of CD4+ T reg cells carry the key T reg cell–associated transcription factor Helios, on a global scale, CD8+ T reg cells were more closely associated with effector/memory-like CD8+ T cells (Fig. S3). Together, our results have demonstrated that the expression of Eomes and Tgfbr2 is dynamically regulated in CD8+ T reg cells. Compared with CD4+ T reg cells, CD8+ T reg cells carry unique transcription profiles and exhibit distinct behavior in response to immunological challenge.
Figure S3.
Distinct transcription profiles of CD4+ vs. CD8+ T reg cells in WT mice. FACS-sorted CD4+ T reg cells (based on Foxp3-GFP; n = 2), CD8+ T reg cells (CD8+CD44hi CD122hiLy49+; n = 1), and effector (eff)/memory (mem)–like CD8+ T cells (CD8+CD44hiCD49d+; n = 2) from WT mice were subjected to global RNA-seq analysis. (A) Heatmap of differentially expressed genes (DEGs). (B and C) Volcano plots of CD8+ T reg cells vs. effector/memory-like CD8+ T cells (B) or CD8+ T reg cells vs. CD4+ T reg cells (C). Numbers on the right of volcano plots indicate the total number of DEGs between the groups. DEGs between CD4+ and CD8+ T reg cells are subjected to Kyoto Encyclopedia of Genes and Genomes pathway analysis. Significantly enriched pathways are shown in D and E.
TGF-β–controlled Helios expression in CD8+ T reg cells
After confirming that defective CD8+ T reg cells were responsible for uncontrolled GC reaction in Tgfbr2−/−Eomes−/− mice and documenting the dynamic expression of Eomes and Tgfbr2 in WT CD8+ T reg cells, we would like to address the key question why CD8+ T reg cells require both TGF-β signal and Eomes expression. As we had found that the total population of Helios+ cells was significantly reduced in the absence of Tgfbr2 and Eomes (Fig. 3, C and D), we first focused on the expression of Helios. On a per cell basis, the expression level of Helios in CD8+ T reg cells isolated from WT and Eomes−/− mice was comparable. In contrast, Tgfbr2−/− CD8+ T reg cells expressed a significantly reduced level of Helios, while in Tgfbr2−/−Eomes−/− counterparts, the expression of Helios was almost completely abolished (Fig. 6 A, top). Interestingly, the expression of a similar transcription factor, Aiolos (encoded by Ikzf3), was also significantly reduced in Tgfbr2−/−Eomes−/− CD8+ T reg cells (Fig. 6 A, bottom), consistent with the leading model that Ikaros factors (including both Helios and Aiolos) form one functional complex in hematopoietic cells (Georgopoulos, 2017). Since the regulation of Helios in CD8+ T cells was not well-defined, we tested whether TGF-β signaling induced Helios expression in CD8+ T cells. To this end, naive CD8+ T cells isolated from WT spleen were stimulated in vitro with or without added TGF-β. The presence of TGF-β significantly boosted the expression of Helios (Fig. 6 B). Considering similar Helios expression in CD4+ T cells from WT and Tgfbr2−/−Eomes−/− mice (Fig. 2, A and C), these results suggest that TGF-β is uniquely required for the optimal expression of Helios in CD8+ T cells, which contributes to the defective CD8+ T reg cells in Tgfbr2−/−Eomes−/− mice.
A TGF-β–dependent genetic program to maintain the regulatory identity of CD8+ T reg cells
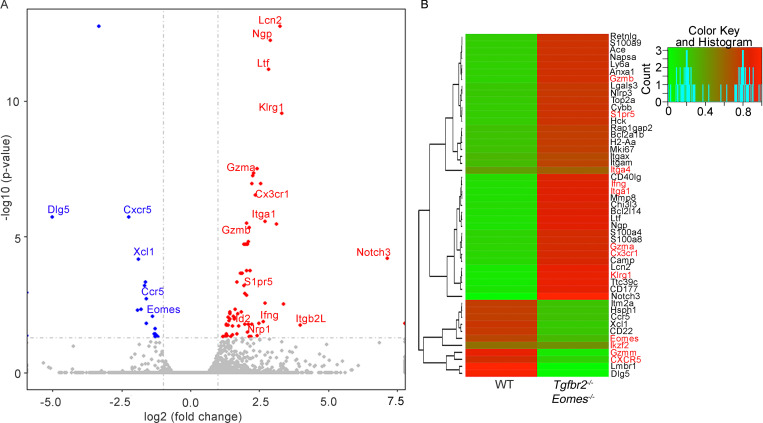
To further dissect the molecular mechanisms leading to the defective CD8+ T reg cells in Tgfbr2−/−Eomes−/− mice, we performed RNA sequencing (RNA-seq) analysis to compare the transcriptional profiles of Ly49+CD122hi CD8+ T cells isolated from WT versus Tgfbr2−/−Eomes−/− mice at 3 mo of age. We found 577 differentially regulated genes (Fig. S4 and Table S1). Among other genes, CD8+ T cell effector molecules and effector program–related molecules including granzyme A (encoded by Gzma), granzyme B (encoded by Gzmb), Klrg1, Id2 (Omilusik et al., 2018), and Cx3cr1 (Gerlach et al., 2016) were greatly up-regulated in Tgfbr2−/−Eomes−/− CD8+ T reg cells.
Figure S4.
RNA-seq analysis of Ly49+CD122hi CD8+ T cells isolated from WT and Tgfbr2−/−Eomes−/− mice. (A and B) Volcano plot (A) and heatmap (B) of selected differentially expressed genes (DEGs) are shown (n = 1). Complete list of differentially expressed genes is shown in Table S1.
To confirm these findings at protein levels, CD8+ T reg cells isolated from WT, Tgfbr2−/−, Eomes−/−, and Tgfbr2−/−Eomes−/− mice were examined by flow cytometry. WT and Eomes−/− CD8+ T reg cells were largely negative for granzyme A and granzyme B. Interestingly, both Tgfbr2−/− and Tgfbr2−/−Eomes−/− mice carried significantly higher levels of effector molecules granzyme A and granzyme B in their CD8+ T reg cells (Fig. 6 C), consistent with lower Helios expression (Fig. 6 A) and possible loss of T reg cell identity. Further, the expression of KLRG1, which is often associated with effector CD8+ T cells, was significantly increased in CD8+ T reg cells isolated from both Tgfbr2−/− and Tgfbr2−/−Eomes−/− mice (Fig. 6 D). Thus, TGF-β actively maintains the regulatory identity of CD8+ T reg cells by inhibiting effector molecules and promoting Helios expression.
An Eomes-dependent genetic program to maintain the location of CD8+ T reg cells
Because one of the major demonstrated functions of CD8+ T reg cells was to control GC reaction, follicular location was essential for CD8+ T reg cells. Indeed, the expression of a group of cell surface proteins involving cell–cell contact and cell migration was also substantially altered in our RNA-seq analysis (Fig. S4). For instance, the expression of integrin Itga1 (CD49a) and S1pr5 (sphingosine 1-phosphate receptor 5) were up-regulated, and the expression of CXCR5 was reduced in Tgfbr2−/−Eomes−/− cells (Fig. S4). To confirm these findings at protein levels, FACS analysis was performed on pregated CD8+ T reg cells in various genetic models. Surprisingly, this set of differentially expressed genes in Tgfbr2−/−Eomes−/− CD8+ T reg cells turned out to be under the control of Eomes and largely independent of TGF-β. For instance, integrin α1 and integrin α4 were minimally expressed on WT CD8+ T reg cells and significantly elevated in the absence of Eomes (including both Eomes−/− and Tgfbr2−/−Eomes−/−) while Tgfbr2 single KO mice exhibited subtle changes (Fig. 7, A and B). CXCR5 exhibited the opposite expression pattern. WT CD8+ T reg cells carried high levels of CXCR5, and Eomes-deficient ones (including both Eomes−/− and Tgfbr2−/−Eomes−/−) almost completely lost their expression while Tgfbr2 single KO mice exhibited a slight decrease (Fig. 7 C). Importantly, the regulation of CXCR5 expression by Eomes was highly specific because closely related transcription factor T-bet played no detectable role (Fig. S2). To test whether the changes of these cell surface markers were associated with defective location of CD8+ T reg cells in the absence of Eomes in vivo, we took advantage of the intravascular labeling technique. Briefly, 5 min after intravenous injection of biotin-labeled anti-CD8α antibody, splenic lymphocytes were subjected to FACS analysis. Due to the short period of in vivo antibody labeling time, only the CD8+ T cells with easy access to blood circulating will be labeled. CD8α+ cells represent the cells located in the red pulp of spleen while CD8α− ones are located inside lymphoid follicles (illustrated in Fig. 7 D). The majority of WT and Tgfbr2−/− CD8+ T reg cells are located inside lymphoid follicles (Fig. 7 E). In contrast, CD8+ T reg cells from both Eomes−/− and Tgfbr2−/−Eomes−/− mice were largely located outside lymphoid follicles (Fig. 7 E). To directly visualize CD8+ T cell distribution in the presence and absence of Eomes, we quantified CD8+ T cells residing inside vs. outside lymphoid follicles on spleen sections. Indeed, we detected significantly increased localization of CD8+ T cells outside lymphoid follicles in Eomes−/− mice compared with WT controls (Fig. 7, F and G). Together, an Eomes-dependent genetic program plays essential functions, including the migration and location of CD8+ T reg cells, which are tightly linked with their function as a controller of GC reaction.
TGF-β and Eomes promote the homeostasis of CD8+ T reg cells
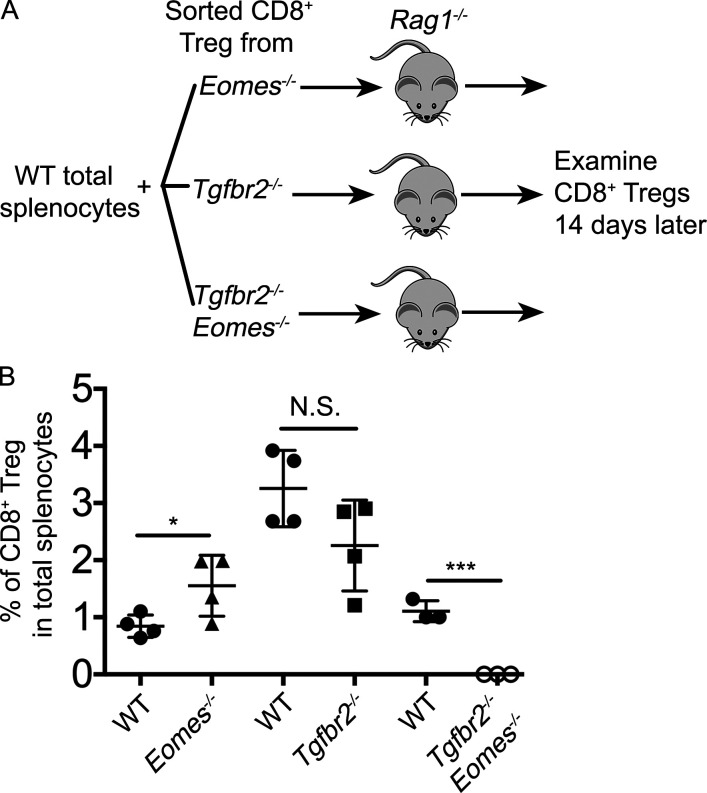
So far, we have demonstrated that for CD8+ T reg cells, TGF-β and Eomes play distinct functions. While TGF-β actively suppresses the effector program and maintains the regulatory identity, Eomes controls the localization of these cells. However, these mechanisms cannot fully explain why the population of CD8+ T reg cells was significantly reduced in single KOs and almost completely lost in double KO mice (Fig. 3). Next, we examined the survival and homeostasis of CD8+ T reg cells. In naive WT mice, CD8+ T reg cells carried the highest levels of CD122 among all CD8+ T cell subsets (Fig. 8 A). In the absence of Tgfbr2 or Eomes, the expression of CD122 was dramatically reduced on CD8+ T cells (Fig. 8 B). At steady-state, CD122 is a key component of IL-15R, which mediates the homeostasis of memory CD8+ T cells. Consistent with elevated CD122 expression, CD8+ T reg cells carried the highest levels of pro-survival Bcl-2 among various CD8+ subsets in WT mice (Fig. 8 C). In the absence of Tgfbr2 or Eomes, Bcl-2 expression was significantly reduced in CD8+ T reg cells. Importantly, TGF-β signaling and Eomes played additive roles on Bcl-2 expression as Tgfbr2−/−Eomes−/− CD8+ T reg cells exhibited a much more dramatic reduction of Bcl-2 compared with WT and single KO controls (Fig. 8, D and E). To directly test the homeostasis of CD8+ T reg cells, we cotransferred WT splenocytes and FACS-sorted CD8+ T reg cells into Rag1−/− hosts (illustrated in Fig. S5 A). While we did not detect defective homeostasis of CD8+ T reg cells derived from single KOs in this setting, Tgfbr2−/−Eomes−/− CD8+ T reg cells completely disappeared after 2 wk (Fig. S5 B). Together, TGF-β signaling and Eomes coordinate to promote the homeostasis and survival of the CD8+ T reg cell population.
Figure S5.
Defective homeostasis of Tgfbr2−/−Eomes−/− CD8+ T reg cells. (A) Schematic of the experiments shown in B. Briefly, WT total splenocytes plus sorted CD8+ T reg cells carrying distinct congenic markers were cotransferred into Rag1−/− mice and examined 14 d later. (B) The percentage of CD8+ T reg cells from various donor mice 14 d after transfer is shown. Each symbol in B represents the results from an individual recipient mouse (n = 3 or 4); bar graphs indicate the mean (± SEM). N.S., not significant; *, P < 0.05; ***, P < 0.001 by Student’s t test. Representative results from two independent experiments are shown.
Similar CD8+ T cell subset was reduced in human SLE patients
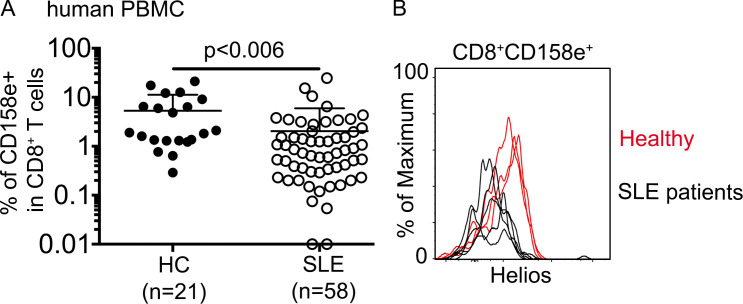
We have identified TGF-β signaling and Eomes-dependent genetic programs as critical regulators of CD8+ T reg cell homeostasis and function in mouse. Interestingly, in both mouse and human genome, Tgfbr2 and Eomes are closely linked genes. To determine the clinical significance of CD8+ T reg cells, we analyzed peripheral blood mononuclear cell (PBMC) samples from patients diagnosed with SLE and healthy controls. Similar to mouse Ly49+CD122hi CD8+ T cells, a subset of human CD8+ T cells bearing a similar phenotype (i.e., CD122hiEomes+CD49dlo) has been identified (Jacomet et al., 2015; White et al., 2016). Interestingly, resembling mouse counterparts who carry NK-related receptor Ly49, these human counterparts are also positive for several NK-related receptors, including CD158e. We compared the expression of CD158e+ in CD8+ T cells from PBMCs and observed a significant lower percentage of CD8+CD158e+ cells in SLE patients (Fig. 9 A). Similar to what is observed in our mouse model, Helios expression in remaining CD8+CD158e+ cells isolated from SLE patients was substantially reduced compared with that in healthy controls (Fig. 9 B). Thus, our findings in mouse models may be extended to humans.
Figure 9.
The defects of a similar CD8+ subset in human SLE patients. (A) The percentage of CD158e+ cells in CD8+ T cells in human PBMCs is shown. Each symbol represents the results from an individual patient; bar graphs indicate the mean (± SEM); healthy control (HC), n = 21; and SLE, n = 58. P value was calculated by Student’s t test. (B) Representative FACS plots of pregated CD8+CD158e+ T cells to show Helios expression (healthy control, n = 3; and SLE, n = 5). Each line represents an individual patient.
Discussion
We have demonstrated that mice lacking both TGF-βR and Eomes expression in mature T cells develop lethal autoimmunity due to severely defective CD8+ T reg cells. Mechanistically, TGF-β inhibits CD8+ effector program and maintains the regulatory identity of CD8+ T reg cells while Eomes promotes their follicular location. In addition, both TGF-β and Eomes promote the survival of CD8+ T reg cells. Together, we have shown that distinct molecular programs downstream of TGF-β and Eomes coordinate to maintain the homeostasis and function of CD8+ T reg cells.
Interestingly, most molecular mechanisms identified here are functional in CD8+ but not in CD4+ T cells. For instance, TGF-β unresponsive CD4+ T reg cells exhibited normal Helios expression (Fig. 2, A and C) while Tgfbr2−/− CD8+ T cells were significantly defective in Helios induction (Fig. 3 C and Fig. 6 A). TGF-β promoted the survival of CD8+ T reg cells (Fig. 8) while slightly inhibiting the homeostasis of CD4+ T reg cells (Fig. 2, A and B). On the other hand, Eomes deficiency clearly abolished CXCR5 expression on CD8+ T cells (Fig. 7) while it had minimal effects on CXCR5+CD4+ TFH cells (Fig. 1 C). These findings suggest that a unique molecular pathway distinct from CD4+ T cells, including CD4+ T reg cells, has been designed for CD8+ T reg cells, consistent with the difference in global transcription profiles (Fig. S3).
Disruption of a TGF-β–controlled or Eomes-controlled program alone only leads to a subtle decrease in overall CD8+ T reg cell function and population. In Tgfbr2−/− mice, even though CD8+ T reg cells expressed lower levels of Helios, only a subtle increase in autoantibodies was detected (Fig. 1 G), presumably due to the facts that TGF-β is intrinsically required to promote CD4+ TFH cell differentiation (Locci et al., 2016; Marshall et al., 2015; Schmitt et al., 2014), which counterbalanced the slightly reduced function of Tgfbr2−/− CD8+ T reg cells. In Eomes−/− mice, we consistently observed a slightly expanded CD4+ TFH cell population and enhanced autoantibody level (Fig. 1). These defects were correlated with reduced CXCR5 expression, altered location, and possibly partial impairment of CD8+ T reg cell function in Eomes−/− mice.
The interaction between TGF-β signaling and Eomes remains to be determined in CD8+ T reg cells in the future. It is conceivable that TGF-β may inhibit Eomes expression similar to previous publications (Ichiyama et al., 2011; Lewis et al., 2016; Mackay et al., 2015) so that Tgfbr2−/− CD8+ T reg cells may carry higher levels of Eomes and contribute to the subtle phenotypes observed in Tgfbr2−/− mice.
As shown in Fig. 4, a single injection of a small number of WT CD8+ T reg cells completely rescued the uncontrolled GC reaction in Tgfbr2−/−Eomes−/− mice while CD8+ T reg cell number was only partially corrected. These results suggest that CD8+ T reg cells are extremely efficient to control spontaneous GC reaction, which may explain why both single KO mice carry significantly reduced population of CD8+ T reg cells while lacking obvious autoimmunity (Fig. 1 and Fig. 3). The efficacy of WT cells to correct the defects in Tgfbr2−/−Eomes−/− mice is remarkable. A single transfer of 3 × 10⁴ WT Ly49+CD8+ T cells/recipient completely corrects the defects in Tgfbr2−/−Eomes−/− mice and provides long-term protection. As a reference, to rescue Scurfy mice, 10-fold more CD4+ T reg cells are required to be transferred at neonatal stages (Fontenot et al., 2003).
Together, we have demonstrated that both TGF-β signaling and the expression of Eomes are required for the homeostasis and function of CD8+ T reg cells, but not for CD4+ T reg cells. Further, we have established an animal model that only this subset of T reg cells is specifically disrupted. Considering the potential significance of CD8+ T reg cells in other autoimmune settings (Fig. 5) and in human autoimmune diseases (Fig. 9), our model will facilitate the future investigation of CD8+ T reg cells under various physiological and pathological settings.
Materials and methods
Mice
C57BL/6J (B6) WT, Eomesf/f (Zhu et al., 2010), Tbx21f/f (Intlekofer et al., 2008), Foxp3-GFP (Lin et al., 2007), and Rag1−/− mice were obtained from the Jackson Laboratory. Tgfbr2f/f and dLck-cre mice were described before (Ma and Zhang, 2015; Zhang and Bevan, 2012). Tgfbr2f/f mice were originally from S. Karlsson (Lund University, Lund, Sweden; Levéen et al., 2005), and dLck-cre mice were originally from N. Killeen (University of California, San Francisco, San Francisco, CA; Zhang et al., 2005). All mice were housed at our specific pathogen–free animal facilities at the University of Texas Health Science Center at San Antonio. All experimental mice have been backcrossed to a C57BL/6 background for >12 generations. Cre− littermates were used for most experiments as WT controls. For the experiments shown in Fig. 5, C57BL/6 mice ordered from Jax were used. All experiments were done in accordance with the University of Texas Health Science Center at San Antonio Institutional Animal Care and Use Committee guidelines.
Antibodies and flow cytometry
Fluorescence dye–labeled antibodies specific for CD3 (17A2), B220 (RA3-6B2), Bcl-2 (10C4), CD19 (1D3), GL-7 (GL7), CD95 (J02 RUO), IgM (11/41), CD4 (GK 1.5), CD44 (IM7), PD-1 (J43), CXCR5 (SPRCL5), Foxp3 (FJK-16S), Helios (22F6), CD8β (H35-17.2), Ly49 (14B11), CD122 (TM-β1), Aiolos (8B2), Granzyme A (GzA-3G8.5), Granzyme B (GB11), ICOS (C398.4A), CTLA4 (UC10-4F10-11), OX40 (OX-86), GITR (DTA-1), KLRG1 (2F1), CD25 (PC61.5), Eomes (Dan11mag), CD49a (142603), CD49d (R1-2), CD45.1 (A20), CD45.2 (104), and CD8α (53–6.7) were purchased from eBioscience, Biolegend, Invitrogen, and Tonbo. TGF-β RII antibody was from R&D Systems (BAF532). Anti-CD16/32 (2.4G2) was produced in the laboratory and used in all FACS staining as FcR blocker. Intranuclear staining for Helios, Eomes, and Foxp3 was performed using a Foxp3 staining buffer set (Tonbo). Intracellular staining for Bcl-2, Granzyme A, and Granzyme B was performed using permeabilization buffer (Invitrogen) following fixation. Ghost Dye Violet 510 (Tonbo) was used to identify live cells. To access Ly49+CD8 T cell intra-splenic location, A dose of 3 µg/mouse biotinylated-CD8α antibody was i.v. injected 5 min before euthanasia. After lymphocyte isolation, fluorescence-labeled streptavidin (Thermo Fisher Scientific) was used during surface FACS staining to differentiate between the CD8+ T cells in the red and white pulp region. Washed and fixed samples were analyzed by BD LSRII or BD FACSCelesta and analyzed by FlowJo (Tree Star) software.
Gene expression profiling
CD8+ T cells were enriched from spleen cells of WT and Tgfbr2−/−Eomes−/− mice by negative selection using biotinylated CD4, B220, and CD19 followed by magnetic depletion. Enriched cells were stained with CD8, CD44, CD122, and Ly49. CD44+Ly49+CD122+CD8+ cells were purified by cell sorting using BD AriaII. RNA was extracted from sorted cells using the Quick-RNA MiniPrep according to the manufacturer’s instructions (Zymo Research). The sequencing library was constructed according to the Illumina TruSeq Total RNA Sample Preparation Guide (RS-122-2201). Each library was barcoded and then pooled for cluster generation and sequencing run with 50 bp single-end sequencing protocol on an Illumina HiSeq 3000 platform by an on-campus facility. WT CD4+ T reg cells were FACS-sorted from the spleen of Foxp3-GFP reporter mice. Effector/memory-like CD8+ T cells (CD8+CD44hiCD49dhi) and CD8+ T reg cells were FACS-sorted from WT spleen. RNA was extracted from sorted cells. RNA-seq analysis was performed by Novogene. Original RNA-seq results can be accessed by under Gene Expression Omnibus accession numbers GSE125111 and GSE150628.
Histology
To assess immunopathology in mice, multiple organs were paraffin-fixed and stained with hematoxylin and eosin. More than five tissue sections were examined for each experimental condition to verify reproducibility.
Immunofluorescent staining and quantitative image analysis
Spleens were obtained from WT and Eomes−/− mice and immediately snap-frozen in optimal cutting temperature compound. Tissues were sectioned to 7 μm thickness using CryoStar NX 0. Sectioned tissues were fixed with 5% paraformaldehyde for 10 min at room temperature. After three washes in PBS, tissues were blocked with 5% BSA overnight at 4°C. For staining, blocked tissues were incubated with eFluor 570-B220 (RA3-6B2, eBioscience) and Alexa Fluor 647-CD8β (Ly-3, Biolegend) in 1% BSA for 2 h at room temperature followed by three PBS washes. Sections were imaged using a Zeiss confocal microscope. Images of 2.39 mm2 were obtained and used for analysis. For the quantification of CD8+ T cell numbers inside and outside the B cell follicle region, ImageJ software was used. Follicular areas were identified morphologically as clusters of brightly stained closely aggregated B220+ cells. Follicular and extrafollicular areas were delineated, and CD8+ cells were counted using ImageJ.
Rescue experiment
30,000 FACS-sorted Ly49+CD122hi CD8+ T cells from WT mice were i.v. injected into each congenically distinct 2-mo-old sex-matched unmanipulated Tgfbr2−/−Eomes−/− mice. 2 × 10⁵ GFP+CD4+ T reg cells were FACS-sorted from Foxp3-GFP reporter mice and i.v. injected into 2-mo-old sex-matched unmanipulated Tgfbr2−/−Eomes−/− mice. Mice that received the cells were sacrificed 3 mo after transfer along with age-matched WT and unmanipulated Tgfbr2−/−Eomes−/− mice as controls.
ELISA
For detection of anti-dsDNA IgG, serum was collected from WT, Tgfbr2−/−, Eomes−/−, and Tgfbr2−/−Eomes−/− mice. Serum was 1:400 diluted in PBS, and antigen capture ELISA was performed using the Mouse Anti-dsDNA IgG Antibody Assay Kit according to the manufacturer’s instructions (3031, Chondrex).
In vitro T cell stimulation
CD8+ T cells were isolated from splenocytes of WT mice by negative selection using the MojoSort mouse CD8+ T cell isolation kit (Biolegend). Purified CD8+ T cells were stimulated with plate-bound 1 µg/ml anti-CD3 (145-2C11, Biolegend) and soluble 1 µg/ml anti-CD28 (37.51; Biolegend) with or without 2.5 ng/ml added recombinant hTGF-β1 (Biolegend) for 2–3 d followed by FACS staining with CD8, CD44, Helios antibodies, and a Viability dye. 5 ng/ml IL-2 (Biolegend) was added on day 1 after stimulation.
Pristane injection
2-mo-old female WT mice were injected i.p. with 0.5 ml pristane (2,6,10,14-tetramethylpentadecane, Acros Organics) and examined 6 wk later.
Human samples
A total of 55 patients with SLE were recruited from out-patient dermatology clinics and in-patient wards at the Second Xiangya Hospital, Central South University, Hunan, China. All SLE patients fulfilled at least four of the SLE classification criteria of the American College of Rheumatology (Hochberg, 1997). A healthy age- and gender-matched control group was enrolled in the hospital. Importantly, control subjects with systemic sclerosis, myositis, other autoimmune disorders, and cancers were excluded from the study. This study was approved by the Ethics Committee of the Second Xiangya Hospital, Central South University, and written informed consents were obtained from all participants. 3 ml venous blood was obtained from SLE-diagnosed patients and healthy controls. PBMCs were obtained by density centrifugation and stained with anti-CD8α (RPA-T8), anti-CD158e (DX9), and anti-Helios (22F6). For intranuclear staining, cells were fixed and permeabilized with a Human Foxp3 Buffer Set (560098, BD Biosciences).
Statistical analysis
Ordinary one-way ANOVA or Student’s t test from Prism 7 (GraphPad Software) was used.
Online supplemental material
Fig. S1 shows extended characterization of Tgfbr2−/−Eomes−/− mice, including splenic phenotypes at younger ages, spleen cellularity, the appearance of Ly49+CD122lo CD8+ T cells, and splenic nodules. Fig. S2 shows the lack of impacts of T-bet deficiency in GC reaction and CD8+ T reg cells. Fig. S3 shows the transcription profiles of WT CD4+ T reg cells, WT CD8+ T reg cells, and CD8+ effector/memory-like T cells. Fig. S4 shows the differentially expressed genes between WT and Tgfbr2−/−Eomes−/− CD8+ T reg cells. Fig. S5 shows defective homeostasis of Tgfbr2−/−Eomes−/− CD8+ T reg cells after transfer into lymphopenic Rag1−/− hosts. Table S1 lists differentially expressed genes between WT and Tgfbr2−/−Eomes−/− CD8+ T reg cells.
Supplementary Material
lists differentially expressed genes between WT and Tgfbr2−/−Eomes−/− CD8+ T reg cells.
Acknowledgments
We thank Dr. Di Yu (Australian National University) and Dr. Stephen Jameson (University of Minnesota) for critical reading of the manuscript. We thank Dr. Ben Daniel, Karla Gorena, and Sebastian Montagnino for FACS sorting. We thank Drs. Zhao Lai, Yi Zou, and Yidong Chen for RNA-seq analysis and informatics assistance.
This work is supported by National Institutes of Health grants AI125701 and AI139721, the Cancer Research Institute Clinic and Laboratory Integration Program, and American Cancer Society grant RSG-18-222-01-LIB to N. Zhang; and National Natural Science Foundation of China grants 81522038, 81270024, and 81220108017 to Q. Lu. Flow cytometry data were generated in the University of Texas Health Science Center at San Antonio Flow Cytometry Shared Resource Facility, which is supported in part by the University of Texas Health Science Center at San Antonio, the Mays Cancer Center P30 Cancer Center Support Grant (NIH-NCI P30 CA054174), and the National Institutes of Health National Center for Advancing Translational Sciences Clinical Translational Science Award (NIH-NCATS UL1 TR002645). RNA-seq analysis of WT and Tgfbr2−/−Eomes−/− CD8+ T reg cells was performed by the Genome Sequencing Core Facility at University of Texas Health Science Center at San Antonio, which is supported by National Institutes of Health/National Cancer Institute Cancer Center Support Grant P30 CA054174, National Institutes of Health Shared Instrument grant 1S10OD021805-01, and Cancer Prevention and Research Institute of Texas Core Facility grant RP160732.
Author contributions: N. Zhang and S. Mishra designed mouse experiments. S. Mishra, W. Liao, Y. Liu, and C. Ma performed mouse experiments. Q. Lu, H. Wu, M. Zhao, W. Liao, and M. Yang designed and performed human experiments. S. Mishra, W. Liao, H. Wu, Q. Lu, and N. Zhang analyzed the results. X. Zhang and Y. Qiu contributed to overall experimental design and analysis. S. Mishra, Q. Lu, and N. Zhang wrote the manuscript.
References
- Botta D., Fuller M.J., Marquez-Lago T.T., Bachus H., Bradley J.E., Weinmann A.S., Zajac A.J., Randall T.D., Lund F.E., León B., et al. . 2017. Dynamic regulation of T follicular regulatory cell responses by interleukin 2 during influenza infection. Nat. Immunol. 18:1249–1260. 10.1038/ni.3837 [DOI] [PMC free article] [PubMed] [Google Scholar]
- Chung Y., Tanaka S., Chu F., Nurieva R.I., Martinez G.J., Rawal S., Wang Y.H., Lim H., Reynolds J.M., Zhou X.H., et al. . 2011. Follicular regulatory T cells expressing Foxp3 and Bcl-6 suppress germinal center reactions. Nat. Med. 17:983–988. 10.1038/nm.2426 [DOI] [PMC free article] [PubMed] [Google Scholar]
- Fontenot J.D., Gavin M.A., and Rudensky A.Y.. 2003. Foxp3 programs the development and function of CD4+CD25+ regulatory T cells. Nat. Immunol. 4:330–336. 10.1038/ni904 [DOI] [PubMed] [Google Scholar]
- Fu W., Liu X., Lin X., Feng H., Sun L., Li S., Chen H., Tang H., Lu L., Jin W., et al. . 2018. Deficiency in T follicular regulatory cells promotes autoimmunity. J. Exp. Med. 215:815–825. 10.1084/jem.20170901 [DOI] [PMC free article] [PubMed] [Google Scholar]
- Georgopoulos K. 2017. The making of a lymphocyte: the choice among disparate cell fates and the IKAROS enigma. Genes Dev. 31:439–450. 10.1101/gad.297002.117 [DOI] [PMC free article] [PubMed] [Google Scholar]
- Gerlach C., Moseman E.A., Loughhead S.M., Alvarez D., Zwijnenburg A.J., Waanders L., Garg R., de la Torre J.C., and von Andrian U.H.. 2016. The Chemokine Receptor CX3CR1 Defines Three Antigen-Experienced CD8 T Cell Subsets with Distinct Roles in Immune Surveillance and Homeostasis. Immunity. 45:1270–1284. 10.1016/j.immuni.2016.10.018 [DOI] [PMC free article] [PubMed] [Google Scholar]
- Hochberg M.C. 1997. Updating the American College of Rheumatology revised criteria for the classification of systemic lupus erythematosus. Arthritis Rheum. 40:1725 10.1002/art.1780400928 [DOI] [PubMed] [Google Scholar]
- Ichiyama K., Sekiya T., Inoue N., Tamiya T., Kashiwagi I., Kimura A., Morita R., Muto G., Shichita T., Takahashi R., et al. . 2011. Transcription factor Smad-independent T helper 17 cell induction by transforming-growth factor-β is mediated by suppression of eomesodermin. Immunity. 34:741–754. 10.1016/j.immuni.2011.02.021 [DOI] [PubMed] [Google Scholar]
- Intlekofer A.M., Banerjee A., Takemoto N., Gordon S.M., Dejong C.S., Shin H., Hunter C.A., Wherry E.J., Lindsten T., and Reiner S.L.. 2008. Anomalous type 17 response to viral infection by CD8+ T cells lacking T-bet and eomesodermin. Science. 321:408–411. 10.1126/science.1159806 [DOI] [PMC free article] [PubMed] [Google Scholar]
- Jacomet F., Cayssials E., Basbous S., Levescot A., Piccirilli N., Desmier D., Robin A., Barra A., Giraud C., Guilhot F., et al. . 2015. Evidence for eomesodermin-expressing innate-like CD8(+) KIR/NKG2A(+) T cells in human adults and cord blood samples. Eur. J. Immunol. 45:1926–1933. 10.1002/eji.201545539 [DOI] [PubMed] [Google Scholar]
- Josefowicz S.Z., Lu L.F., and Rudensky A.Y.. 2012. Regulatory T cells: mechanisms of differentiation and function. Annu. Rev. Immunol. 30:531–564. 10.1146/annurev.immunol.25.022106.141623 [DOI] [PMC free article] [PubMed] [Google Scholar]
- Kim H.J., Verbinnen B., Tang X., Lu L., and Cantor H.. 2010. Inhibition of follicular T-helper cells by CD8(+) regulatory T cells is essential for self tolerance. Nature. 467:328–332. 10.1038/nature09370 [DOI] [PMC free article] [PubMed] [Google Scholar]
- Kim H.J., Wang X., Radfar S., Sproule T.J., Roopenian D.C., and Cantor H.. 2011. CD8+ T regulatory cells express the Ly49 Class I MHC receptor and are defective in autoimmune prone B6-Yaa mice. Proc. Natl. Acad. Sci. USA. 108:2010–2015. 10.1073/pnas.1018974108 [DOI] [PMC free article] [PubMed] [Google Scholar]
- Kim H.J., Barnitz R.A., Kreslavsky T., Brown F.D., Moffett H., Lemieux M.E., Kaygusuz Y., Meissner T., Holderried T.A., Chan S., et al. . 2015. Stable inhibitory activity of regulatory T cells requires the transcription factor Helios. Science. 350:334–339. 10.1126/science.aad0616 [DOI] [PMC free article] [PubMed] [Google Scholar]
- Laidlaw B.J., Lu Y., Amezquita R.A., Weinstein J.S., Vander Heiden J.A., Gupta N.T., Kleinstein S.H., Kaech S.M., and Craft J.. 2017. Interleukin-10 from CD4+ follicular regulatory T cells promotes the germinal center response. Sci. Immunol. 2 eaan4767 10.1126/sciimmunol.aan4767 [DOI] [PMC free article] [PubMed] [Google Scholar]
- Levéen P., Carlsén M., Makowska A., Oddsson S., Larsson J., Goumans M.J., Cilio C.M., and Karlsson S.. 2005. TGF-beta type II receptor-deficient thymocytes develop normally but demonstrate increased CD8+ proliferation in vivo. Blood. 106:4234–4240. 10.1182/blood-2005-05-1871 [DOI] [PubMed] [Google Scholar]
- Lewis G.M., Wehrens E.J., Labarta-Bajo L., Streeck H., and Zuniga E.I.. 2016. TGF-β receptor maintains CD4 T helper cell identity during chronic viral infections. J. Clin. Invest. 126:3799–3813. 10.1172/JCI87041 [DOI] [PMC free article] [PubMed] [Google Scholar]
- Li W., Titov A.A., and Morel L.. 2017. An update on lupus animal models. Curr. Opin. Rheumatol. 29:434–441. 10.1097/BOR.0000000000000412 [DOI] [PMC free article] [PubMed] [Google Scholar]
- Lin W., Haribhai D., Relland L.M., Truong N., Carlson M.R., Williams C.B., and Chatila T.A.. 2007. Regulatory T cell development in the absence of functional Foxp3. Nat. Immunol. 8:359–368. 10.1038/ni1445 [DOI] [PubMed] [Google Scholar]
- Linterman M.A., Pierson W., Lee S.K., Kallies A., Kawamoto S., Rayner T.F., Srivastava M., Divekar D.P., Beaton L., Hogan J.J., et al. . 2011. Foxp3+ follicular regulatory T cells control the germinal center response. Nat. Med. 17:975–982. 10.1038/nm.2425 [DOI] [PMC free article] [PubMed] [Google Scholar]
- Locci M., Wu J.E., Arumemi F., Mikulski Z., Dahlberg C., Miller A.T., and Crotty S.. 2016. Activin A programs the differentiation of human TFH cells. Nat. Immunol. 17:976–984. 10.1038/ni.3494 [DOI] [PMC free article] [PubMed] [Google Scholar]
- Ma C., and Zhang N.. 2015. Transforming growth factor-β signaling is constantly shaping memory T-cell population. Proc. Natl. Acad. Sci. USA. 112:11013–11017. 10.1073/pnas.1510119112 [DOI] [PMC free article] [PubMed] [Google Scholar]
- Mackay L.K., Wynne-Jones E., Freestone D., Pellicci D.G., Mielke L.A., Newman D.M., Braun A., Masson F., Kallies A., Belz G.T., et al. . 2015. T-box Transcription Factors Combine with the Cytokines TGF-β and IL-15 to Control Tissue-Resident Memory T Cell Fate. Immunity. 43:1101–1111. 10.1016/j.immuni.2015.11.008 [DOI] [PubMed] [Google Scholar]
- Marshall H.D., Ray J.P., Laidlaw B.J., Zhang N., Gawande D., Staron M.M., Craft J., and Kaech S.M.. 2015. The transforming growth factor beta signaling pathway is critical for the formation of CD4 T follicular helper cells and isotype-switched antibody responses in the lung mucosa. eLife. 4 e04851 10.7554/eLife.04851 [DOI] [PMC free article] [PubMed] [Google Scholar]
- Omilusik K.D., Nadjsombati M.S., Shaw L.A., Yu B., Milner J.J., and Goldrath A.W.. 2018. Sustained Id2 regulation of E proteins is required for terminal differentiation of effector CD8+ T cells. J. Exp. Med. 215:773–783. 10.1084/jem.20171584 [DOI] [PMC free article] [PubMed] [Google Scholar]
- Rifa’i M., Kawamoto Y., Nakashima I., and Suzuki H.. 2004. Essential roles of CD8+CD122+ regulatory T cells in the maintenance of T cell homeostasis. J. Exp. Med. 200:1123–1134. 10.1084/jem.20040395 [DOI] [PMC free article] [PubMed] [Google Scholar]
- Ritvo P.G., Churlaud G., Quiniou V., Florez L., Brimaud F., Fourcade G., Mariotti-Ferrandiz E., and Klatzmann D.. 2017. Tfr cells lack IL-2Rα but express decoy IL-1R2 and IL-1Ra and suppress the IL-1-dependent activation of Tfh cells. Sci. Immunol. 2 eaan0368 10.1126/sciimmunol.aan0368 [DOI] [PubMed] [Google Scholar]
- Sage P.T., Paterson A.M., Lovitch S.B., and Sharpe A.H.. 2014. The coinhibitory receptor CTLA-4 controls B cell responses by modulating T follicular helper, T follicular regulatory, and T regulatory cells. Immunity. 41:1026–1039. 10.1016/j.immuni.2014.12.005 [DOI] [PMC free article] [PubMed] [Google Scholar]
- Sage P.T., Ron-Harel N., Juneja V.R., Sen D.R., Maleri S., Sungnak W., Kuchroo V.K., Haining W.N., Chevrier N., Haigis M., et al. . 2016. Suppression by TFR cells leads to durable and selective inhibition of B cell effector function. Nat. Immunol. 17:1436–1446. 10.1038/ni.3578 [DOI] [PMC free article] [PubMed] [Google Scholar]
- Saligrama N., Zhao F., Sikora M.J., Serratelli W.S., Fernandes R.A., Louis D.M., Yao W., Ji X., Idoyaga J., Mahajan V.B., et al. . 2019. Opposing T cell responses in experimental autoimmune encephalomyelitis. Nature. 572:481–487. 10.1038/s41586-019-1467-x [DOI] [PMC free article] [PubMed] [Google Scholar]
- Schmitt N., Liu Y., Bentebibel S.E., Munagala I., Bourdery L., Venuprasad K., Banchereau J., and Ueno H.. 2014. The cytokine TGF-β co-opts signaling via STAT3-STAT4 to promote the differentiation of human TFH cells. Nat. Immunol. 15:856–865. 10.1038/ni.2947 [DOI] [PMC free article] [PubMed] [Google Scholar]
- Śledzińska A., Hemmers S., Mair F., Gorka O., Ruland J., Fairbairn L., Nissler A., Müller W., Waisman A., Becher B., et al. . 2013. TGF-β signalling is required for CD4+ T cell homeostasis but dispensable for regulatory T cell function. PLoS Biol. 11 e1001674 10.1371/journal.pbio.1001674 [DOI] [PMC free article] [PubMed] [Google Scholar]
- Thornton A.M., and Shevach E.M.. 2019. Helios: still behind the clouds. Immunology. 158:161–170. 10.1111/imm.13115 [DOI] [PMC free article] [PubMed] [Google Scholar]
- White J.T., Cross E.W., Burchill M.A., Danhorn T., McCarter M.D., Rosen H.R., O’Connor B., and Kedl R.M.. 2016. Virtual memory T cells develop and mediate bystander protective immunity in an IL-15-dependent manner. Nat. Commun. 7:11291 10.1038/ncomms11291 [DOI] [PMC free article] [PubMed] [Google Scholar]
- Wing J.B., Ise W., Kurosaki T., and Sakaguchi S.. 2014. Regulatory T cells control antigen-specific expansion of Tfh cell number and humoral immune responses via the coreceptor CTLA-4. Immunity. 41:1013–1025. 10.1016/j.immuni.2014.12.006 [DOI] [PubMed] [Google Scholar]
- Wu H., Chen Y., Liu H., Xu L.L., Teuscher P., Wang S., Lu S., and Dent A.L.. 2016. Follicular regulatory T cells repress cytokine production by follicular helper T cells and optimize IgG responses in mice. Eur. J. Immunol. 46:1152–1161. 10.1002/eji.201546094 [DOI] [PMC free article] [PubMed] [Google Scholar]
- Xu L., Huang Q., Wang H., Hao Y., Bai Q., Hu J., Li Y., Wang P., Chen X., He R., et al. . 2017. The Kinase mTORC1 Promotes the Generation and Suppressive Function of Follicular Regulatory T Cells. Immunity. 47:538–551.e5. 10.1016/j.immuni.2017.08.011 [DOI] [PubMed] [Google Scholar]
- Zhang N., and Bevan M.J.. 2012. TGF-β signaling to T cells inhibits autoimmunity during lymphopenia-driven proliferation. Nat. Immunol. 13:667–673. 10.1038/ni.2319 [DOI] [PMC free article] [PubMed] [Google Scholar]
- Zhang D.J., Wang Q., Wei J., Baimukanova G., Buchholz F., Stewart A.F., Mao X., and Killeen N.. 2005. Selective expression of the Cre recombinase in late-stage thymocytes using the distal promoter of the Lck gene. J. Immunol. 174:6725–6731. 10.4049/jimmunol.174.11.6725 [DOI] [PubMed] [Google Scholar]
- Zhu Y., Ju S., Chen E., Dai S., Li C., Morel P., Liu L., Zhang X., and Lu B.. 2010. T-bet and eomesodermin are required for T cell-mediated antitumor immune responses. J. Immunol. 185:3174–3183. 10.4049/jimmunol.1000749 [DOI] [PubMed] [Google Scholar]
Associated Data
This section collects any data citations, data availability statements, or supplementary materials included in this article.
Supplementary Materials
lists differentially expressed genes between WT and Tgfbr2−/−Eomes−/− CD8+ T reg cells.


