Abstract.
Purpose: Conventional stenosis quantification from single-energy computed tomography (SECT) images relies on segmentation of lumen boundaries, which suffers from partial volume averaging and calcium blooming effects. We present and evaluate a method for quantifying percent area stenosis using multienergy CT (MECT) images.
Approach: We utilize material decomposition of MECT images to measure stenosis based on the ratio of iodine mass between vessel locations with and without a stenosis, thereby eliminating the requirement for segmentation of iodinated lumen. The method was first assessed using simulated MECT images created with different spatial resolutions. To experimentally assess this method, four phantoms with different stenosis severity (30% to 51%), vessel diameters (5.5 to 14 mm), and calcification densities (700 to ) were fabricated. Conventional SECT images were acquired using a commercial CT system and were analyzed with commercial software. MECT images were acquired using a commercial dual-energy CT (DECT) system and also from a research photon-counting detector CT (PCD-CT) system. Three-material-decomposition was performed on MECT data, and iodine density maps were used to quantify stenosis. Clinical radiation doses were used for all data acquisitions.
Results: Computer simulation verified that this method reduced partial volume and blooming effects, resulting in consistent stenosis measurements. Phantom experiments showed accurate and reproducible stenosis measurements from MECT images. For DECT and two-threshold PCD-CT images, the estimation errors were 4.0% to 7.0%, 2.0% to 9.0%, 10.0% to 18.0%, and to (ground truth: 51%, 51%, 51%, and 30%). For four-threshold PCD-CT images, the errors were 1.0% to 3.0%, 4.0% to 6.0%, to 9.0%, and 0.0% to 6.0%. Errors using SECT were much larger, ranging from 4.4% to 46%, and were especially worse in the presence of dense calcifications.
Conclusions: The proposed approach was shown to be insensitive to acquisition parameters, demonstrating the potential to improve the accuracy and precision of stenosis measurements in clinical practice.
Keywords: computed tomography, CT angiography, stenosis, atherosclerosis, material decomposition, calcium blooming
1. Introduction
Luminal stenosis is an important parameter used in determining patient management for patients with atherosclerotic plaques.1–5 Accurate quantification of stenosis severity by imaging techniques is, therefore, fundamental to planning a correct therapeutic approach.6–8 Conventional angiography is considered the “gold standard” for the evaluation of stenosis severity.6,7 However, it relies on a limited number of views (projections through the patient) and is known to have poor intra- and inter-rater agreement with regard to stenosis severity.9,10 Furthermore, it is an invasive test associated with a small risk of infection, bleeding, stroke, or even death.11–13 Noninvasive imaging techniques can avoid the risks of catheterization and are cost effective.14,15
Computed tomography angiography (CTA) is a sensitive, specific, and fast quantitative imaging technique with high spatial resolution. It has high interoperator reproducibility and high sensitivity and specificity for detecting high-grade stenoses compared with catheter angiography and is more accurate than magnetic resonance angiography and ultrasound.6,16–20 For mild stenosis, it was reported to achieve very high sensitivity, specificity, and accuracy.16,21 In addition, CTA allows for three-dimensional imaging of stenoses from which percent area stenosis can be measured. In contrast to the lumen diameter measurements from conventional two-dimensional catheter angiography, area stenosis works for both circular and noncircular transverse luminal profiles and reduces the underestimation of stenosis degree.22,23 Furthermore, area stenosis was reported to correlate better with hemodynamics of stenosis.24 Hence, it has been proposed as a more accurate way to quantify arterial stenosis.25–27
However, current CTA-based stenosis measurements rely primarily on the segmentation of the iodinated lumen, the accuracy of which suffers from errors due to partial volume averaging and, when dense calcification is present, calcium blooming effects, resulting in highly variable results that are dependent on both operator and analysis software.28–33 In addition, due to limitations in spatial resolution, the bright signal from dense calcifications alters the signal of the adjacent iodinated lumen. This effect is referred to as calcium blooming and describes the contamination of the iodine signal with the calcium signal due to the system blurring caused by limited spatial resolution (i.e., linear and nonlinear partial volume effects). In addition, calcifications and the iodinated lumen may have similar attenuation properties (and therefore, similar pixel intensities). These two effects make it challenging to accurately detect lumen boundaries using segmentation-based methods and conventional CTA images.30,32 Although substantial work has been performed to develop semiautomated lumen segmentation software to improve reproducibility,32,34–37 commercial software generally yields lower sensitivity than manual measurements,21,32,34 and accuracy is degraded in the presence of calcified plaques.21,29,32,34,36 Incorrect assessment of calcification and lumen boundaries result in erroneous stenosis measurements and incorrect centerlines.32,38 Hence, overcoming the accuracy-degrading effects of vascular calcifications is essential for accurate and reproducible stenosis quantification and, by extension, appropriate disease management.
To overcome these limitations, we propose a method that utilizes material decomposition of dual-energy CT (DECT) and multiple-energy CT (MECT) images to quantify percent area stenosis (more simply referred to as stenosis hereafter). The stenosis measurements were performed on iodine density maps derived from the DECT or MECT image data, thereby eliminating the requirement of laborious and subjective segmentation of the iodinated lumen. Computer simulations were performed to verify the premise of the proposed method and to assess the impact of partial volume effects on the stenosis measurements. Accuracy and precision of the measurements were experimentally assessed by phantom studies on a commercial dual-source system (DSCT) and a whole-body research photon counting detector CT (PCD-CT) system. The accuracy and precision of this method were compared to the conventional technique based on single-energy CT (SECT) images.
2. Method and Materials
2.1. Proposed Method to Determine Percent Area Stenosis
Our hypothesis is that percent area stenosis can be accurately and reproducibly estimated by calculating the ratio between the lumen iodine mass at the point of the stenosis and that at a proximal normal portion of the vessel. The measured attenuation in a DECT or MECT CTA exam reflects the cumulative attenuation of primarily three different materials, referred to as basis materials: calcium (calcifications), iodine (iodinated lumen), and water (surrogate for blood, soft tissue/vascular wall, and fat). DECT or MECT CTA can exploit the energy-dependent attenuation properties of the basis materials to extract the iodine signal and create quantitative iodine density maps.39,40 By neglecting the iodine signal outside the blood vessels (e.g., small amount of iodine in the myocardium), it can be mathematically proven that accurate stenosis quantification can be achieved by taking the ratio of the iodine mass at vessel locations with and without a stenosis (see Appendix). This method not only provides accurate stenosis quantification, but also it is highly reproducible and has negligible dependence on scan acquisition and reconstruction parameters, applied radiation dose, iodine concentrations achieved in the vessels, image noise, spatial resolution, or user-drawn regions-of-interest (ROIs).
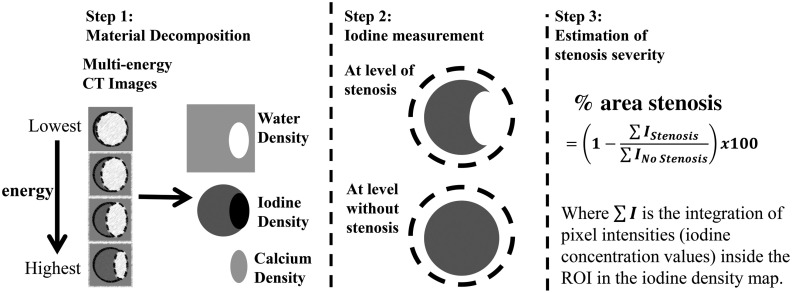
Figure 1 shows the proposed method for the quantification of percent area stenosis.41,42
Fig. 1.
Flowchart of the proposed method for the measurement of percent area luminal stenosis, which uses the iodine density maps generated from material decomposition of DECT or MECT images. ROIs are drawn surrounding the vessel cross sections at locations with and without a stenosis and iodine mass is calculated as the sum of all iodine density values multiplied by pixel volume. Finally, the percent area luminal stenosis is calculated as the ratio of the iodine mass at vessel locations sites with and without a stenosis.
The process is described below:
-
Step 1:
Perform material decomposition of DECT or MECT CTA data to obtain basis material density maps (calcium, iodine, and water);
-
Step 2:
Draw coarse ROIs in iodine density maps to surround vessel cross sections with and without the stenosis and calculate the iodine mass at each location (the sum of all iodine density pixel values multiplied by pixel volume);
-
Step 3:
Quantify the percent area stenosis by calculating the ratio of the iodine mass at the location with the stenosis to that at the location without the stenosis.
2.2. Computer Simulation
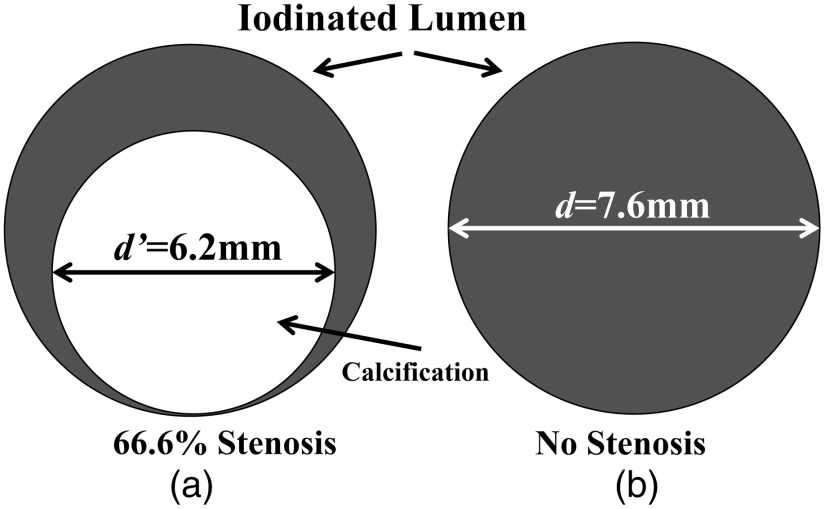
We first verified our hypothesis by computer simulation. Figure 2 is an illustration of the digital phantom used to simulate a cross section of a carotid artery with area stenosis and a reference blood vessel without a stenosis. The degree of stenosis was chosen to simulate a high-grade stenosis (i.e., diameter stenosis) with an diameter stenosis, where the diameter stenosis is calculated by the ratio between the residual luminal diameter of stenotic segment (A) and the reference luminal diameter within a normal segment (B) and calculated by .43,44 The vessels were filled with a iodine solution, which yielded contrast levels relevant to clinical contrast-enhanced CT exams (around 350 HU at 120 kV). A cylinder containing of calcium chloride was placed in the vessel to mimic a high-density calcification (around 1300 HU at 120 kV) and create a severe stenosis.
Fig. 2.
Illustration of the digital phantom used to simulate a cross section of (a) a blood vessel having a area stenosis and (b) a reference blood vessel without a stenosis. The outer diameters of the lumen and calcification were 7.6 and 6.2 mm, respectively.
A CT simulation software package (DRASIM, Siemens Healthcare, Forchheim, Germany) was used to generate projection data at four monoenergetic photon energies (30, 50, 70, and 90 keV). To assess the impact of the point spread function on the stenosis measurement accuracy, images with four different sharpness levels (i.e., spatial resolutions) were reconstructed using a filtered-backprojection algorithm and different reconstruction kernels.
Material decomposition was performed on the four monochromatic, MECT images using an in-house, image-based material decomposition method.45 Two circular ROIs of the same size were coarsely drawn around the vessels in the iodine density maps to calculate the iodine mass. Finally, the percent area stenosis was determined as the ratio between the iodine mass value in the stenotic vessel containing the calcium to that in the vessel without a stenosis.
The same analysis was performed on the three remaining data sets having different sharpness levels and the accuracy of stenosis measurements was assessed.
2.3. Phantom Experiments
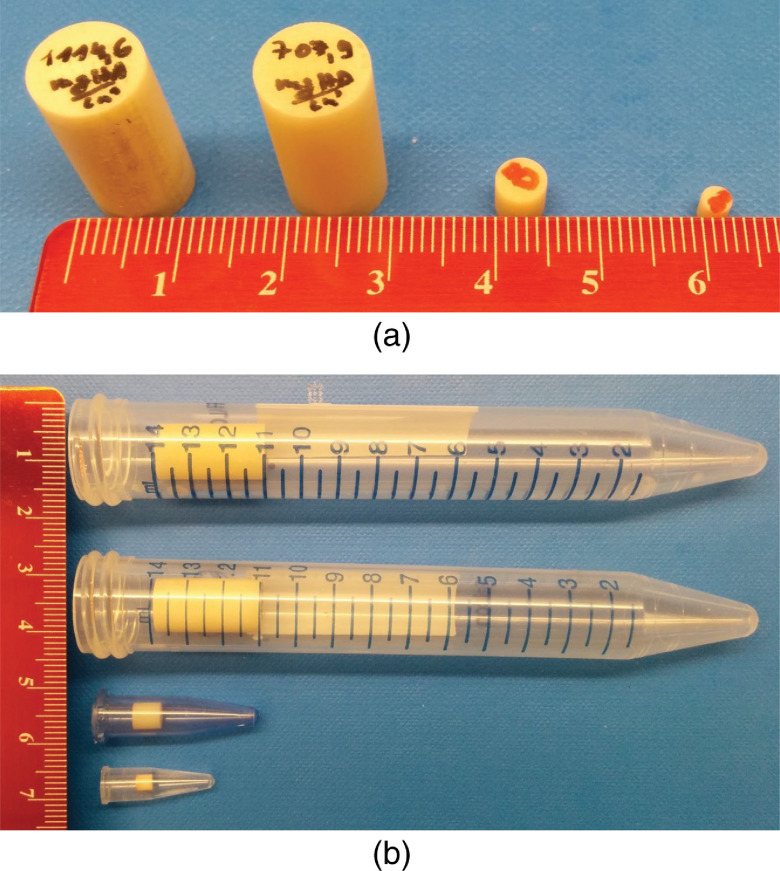
In this study, we performed a series of phantom experiments to test the proposed method. Four phantoms with different degrees of percent area stenosis (30% to 51%), vessel diameter (5.5 to 14 mm), and calcification densities (700 to ) were fabricated using hydroxyapatite (HA) cylinders and plastic tubes filled with iodinated solutions (see Table 1, Fig. 3). Three phantoms with 51% area stenosis (corresponding diameter stenosis: 71.4%) were used to mimic hemodynamically significant lesions ( diameter stenosis) reported in various CTA studies.7,26,46,47 In addition, a nonsevere stenosis with 30% area stenosis (lumen diameter reduction of 45.5%) was included to evaluate the performance of the proposed method on lower degrees of arterial stenosis.48 The luminal diameters were chosen to represent a wide range of relevant arteries, such as pulmonary artery (14.7 to 22.9 mm), iliac (7.5 to 11.8 mm), femoral artery (8 to 10 mm), carotid artery (4.7 to 6.5 mm), etc.49–52 We purposely chose four high-density HA cylinders (at 120 kV, the CT numbers were 1478, 972, 1108, and 1108 Hounsfield unit (HU), respectively, for phantoms A, B, C, and D) to demonstrate that the proposed method could accurately measure stenosis severity, even in the presence of very dense calcifications. The tubes were filled with Iohexol solution (Iohexol, [Omnipaque; GE Healthcare]) to approximate the attenuation of clinical contrast-enhanced CT exams (e.g., about 350 HU contrast enhancement at 120 kV) and placed within a water-filled, 20-cm-wide, acrylic phantom.
Table 1.
Information about calcified stenosis phantoms used to experimentally validate the proposed method.
| Phantom # | HA cylinder | Lumen diameter (mm) | Area stenosis (%) | ||
|---|---|---|---|---|---|
| HA density (mg/cc) | Diameter (mm) | Height (mm) | |||
| A | 1100 | 10 | 19 | 14 | 51 |
| B | 700 | 10 | 19 | 14 | 51 |
| C | 800 | 5 | 5 | 7 | 51 |
| D | 800 | 3 | 3 | 5.5 | 30 |
Fig. 3.
(a) Four high-density HA cylinders used in the vessel phantoms. (b) HA cylinders were placed in four plastic tubes, which were filled with an iodine solution and scanned in a 20-cm wide torso-shaped water phantom.
Conventional SECT images were acquired using a commercial DSCT system (SOMATOM Definition Flash, Siemens Healthcare) operated in single-source mode and the routine carotid CTA single-energy protocol used in our clinical practice. In addition, DECT images were acquired using the same CT system, but operated in dual-energy mode at two different tube-potential/beam filtration settings (Table 2).
Table 2.
Acquisition and reconstruction parameters used in the phantom experiments.
| Scan parameters | SECT | DECT | PCD-CT |
PCD-CT |
|
|---|---|---|---|---|---|
| Four-energy mode | Two-energy mode | ||||
| kV | 120 | 80/Sn140 | 100/Sn140 | 140 | 140 |
| Detector type | EID | EID | PCD | PCD | |
| Collimation (mm) | |||||
| Pitch | 0.7 | 0.6 | 0.6 | 0.6 | |
| Thresholds (keV) | N/A | N/A | [20,31,55,90] | [25, 65] | |
| [20,25,57,77] | |||||
| [20,39,64,89] | |||||
| [25,45,65,85] | |||||
| Image thickness/interval (mm) | 1.5/1.0 | 1.5/1.0 | 1.5/1.0 | 1.5/1.0 | |
| Recon kernel | B40 | D30 | D30 | D30 | |
| Recon FOV (mm) | 200 | 200 | 200 | 200 | |
| CTDIvol (mGy) | RD: 3.82 | RD: 3.52 | RD: 3.53 | RD: 8.68 | RD: 3.88 |
| HD: 18.50 | HD: 28.13 | HD: 60.74 | HD: 60.74 | ||
Note: EID, energy integrating detector; PCD, photon-counting detector; FOV, field of view; RD, routine radiation dose; HD, highest radiation dose. Dose values are in terms of volume CT dose index (CTDIvol) and are based on the 32-cm diameter phantom.
MECT images were also acquired using a research PCD-CT scanner (SOMATOM CounT, Siemens Healthcare) using two different acquisition modes. The two-threshold mode simultaneously measures all photons above each of two different thresholds for each detector pixel with a single exposure. The four-threshold mode simultaneously measures all photons above each of two different thresholds for every other detector pixel. Using different threshold values for every other detector pixel allows simultaneous measurement of all photons above four different threshold values with a single exposure, albeit at only half of the dose efficiency of the two-threshold mode. Detailed information about the research PCD-CT system can be found elsewhere.42,53,54
The radiation dose levels for DECT and PCD-CT two-energy-threshold acquisitions matched the routine dose (RD) level used in our clinical SECT exam (Table 2). For the PCD-CT four-energy-threshold acquisitions, the radiation dose was doubled to account for the 50% detector dose efficiency of this mode.42 This delivered the same photon fluence to the detector as the other acquisitions in order to allow a fair comparison. A commercial PCD-CT system would not use this dose-inefficient research mode and hence would not require this dose doubling. We assessed the impact of image noise on the estimation accuracy using two different approaches. First, an in-house image-domain noise reduction method, multienergy nonlocal means (MENLM),55 was applied to the RD images to achieve around 80% to 90% noise reduction. Second, additional scans with the highest dose (HD) levels achievable were performed for the DECT and PCD-CT scan data.
For the SECT images, stenosis severity was analyzed with a commercial stenosis analysis software package (Syngo Via CT vascular, Siemens Healthcare). This approach (also using different software tools from other manufacturers) is currently considered the clinical reference standard for noninvasive assessment of stenosis severity. After loading CTA images, multiplanar reformations images and volume rendering techniques images were created and displayed to the operator. The evaluation of the vessel lumen was performed on the curved planar reformations view. Digital calipers were used to quantify stenosis severity using default parameter settings (lower threshold: 50 HU; upper threshold: 940 HU). One digital pointer was used to mark the stenosis, and two reference pointers were used to mark normal regions proximal and distal to the stenosis. Percentage area stenosis was then automatically calculated.
The proposed method was applied to all DECT and PCD-CT data: RD, MENLM-filtered RD, and HD images. For DECT data and PCD-CT acquired with two energy thresholds, three-material decomposition was performed using the assumption of volume conservation to decompose the images into three basis materials (calcium, iodine, and water) from measurements using only two energies.45 Three-basis-material decomposition was performed directly on PCD-CT four-energy-threshold images to generate calcium, iodine, and water image maps. For DECT and PCD-CT data, the iodine density maps were used for stenosis measurements, which were performed at several slices along the long axis of the calcium cylinder. The accuracy of the measurements was determined by comparing the calculated and known values, and the precision was estimated using the variation in calculated values along the long axis of the phantoms.
3. Results
3.1. Computer Simulation
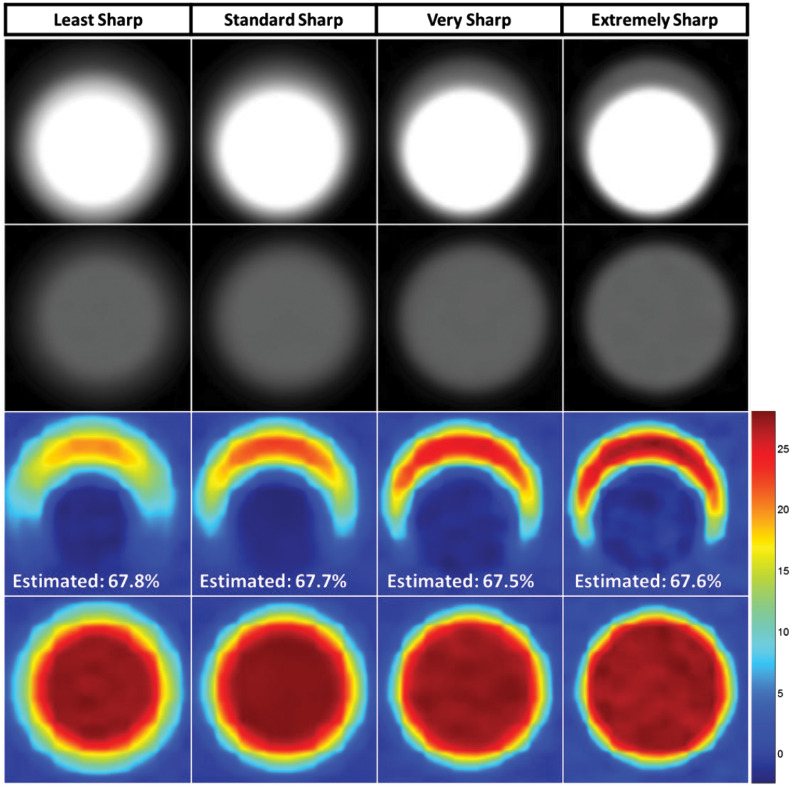
Computer simulation results showed that MECT images with different levels of spatial resolution caused large variations in the visual appearance of the same stenosis (Fig. 4). However, the proposed method consistently estimated stenosis severity, with errors below 1.2% in all cases. The consistency of the calculated values for the four different levels of spatial resolution demonstrated that the partial volume effect had negligible impact on the stenosis severity measurements using the proposed method. For the lowest spatial resolution, i.e., first column of Fig. 4, the iodine concentration value in the iodine map is lower (yellow color coding rather than red) than for the images with better spatial resolution. However, the iodine-containing pixels in the first column cover a larger area than for sharper images. For the sharpest kernel, e.g., the fourth column in Fig. 4, the opposite behavior is observed (higher iodine concentration over a smaller area). The complementary nature of these effects of partial volume averaging is responsible for the insensitivity of the total iodine mass to image sharpness.
Fig. 4.
Validation simulation results. First row: MECT images with four different degrees of sharpness. Second row: Corresponding images of the stenosis-free reference vessel. Third row: Iodine density maps (in mg/ml) were generated from material decomposition at the level of a stenosis and without a stenosis. As spatial resolution was varied (from left to right), the size and densities of the iodine map also varied. However, for all four sharpness levels, the proposed method achieved accurate measurement of the percent area stenosis, with errors below 1.2% across all sharpness levels (true percent area stenosis = 66.6%).
3.2. Stenosis Quantification Accuracy
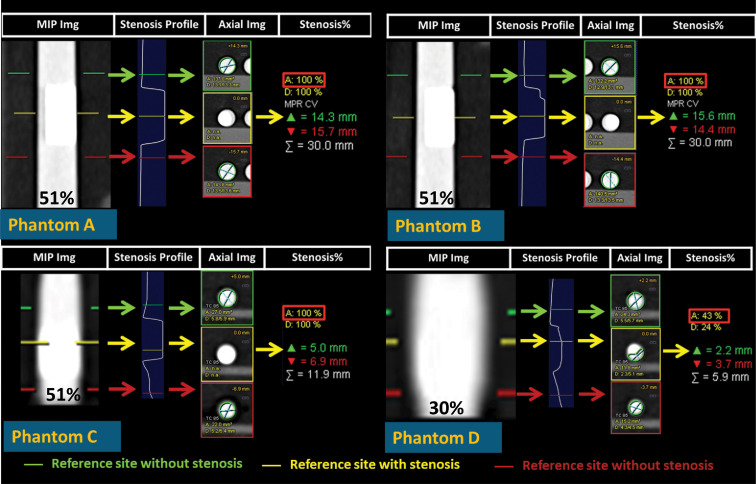
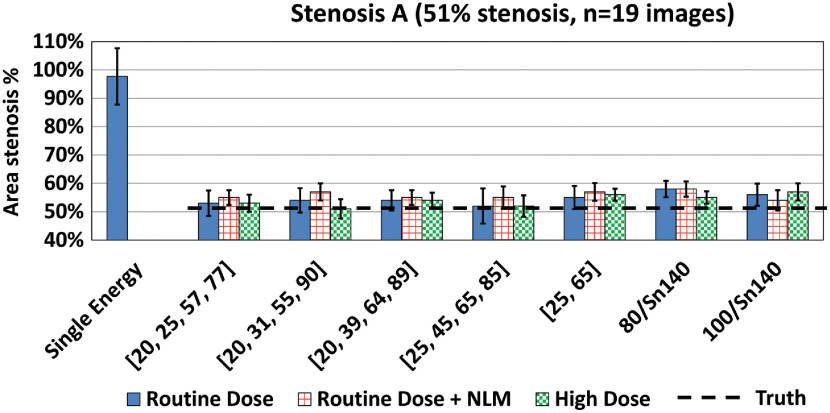
With the presence of heavy calcifications, errors in the percent area stenosis measurements using SECT and the commercial software were very large (Fig. 5), ranging from 4.4% to 46%; these were especially worse in the presence of heavier and larger calcifications, resulting in serious misinterpretation of phantoms A, B, and C as being completely blocked, even though the actual percent area stenosis values for all three phantoms were (Fig. 5).
Fig. 5.
Stenosis quantification using the commercial stenosis quantification software and conventional SECT angiographic data. The yellow lines on the grayscale maximum intensity projection (MIP) images (far left of each panel) mark the location of the stenosis, whereas the green and red lines mark the reference locations where a stenosis is not present. The software reported a one-dimensional vessel profile as well as the percent area stenosis relative to the reference location (red rectangular boxes).
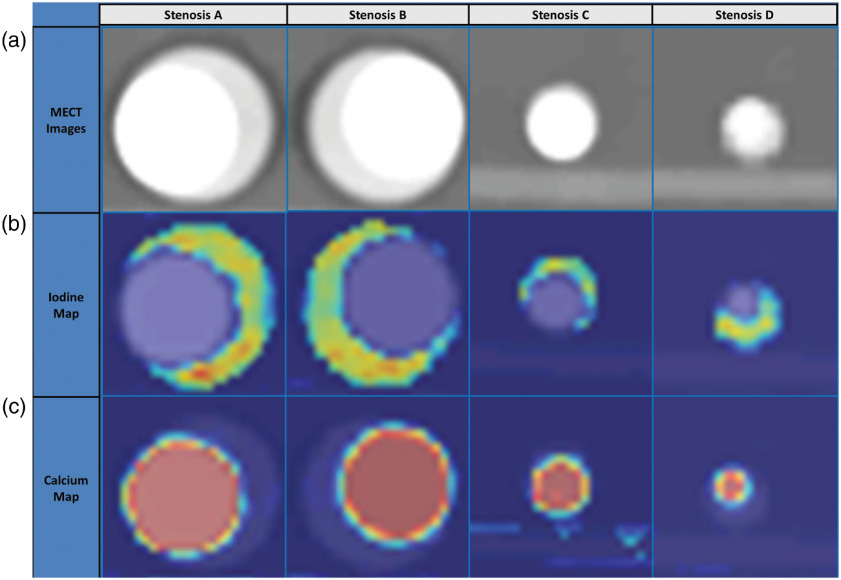
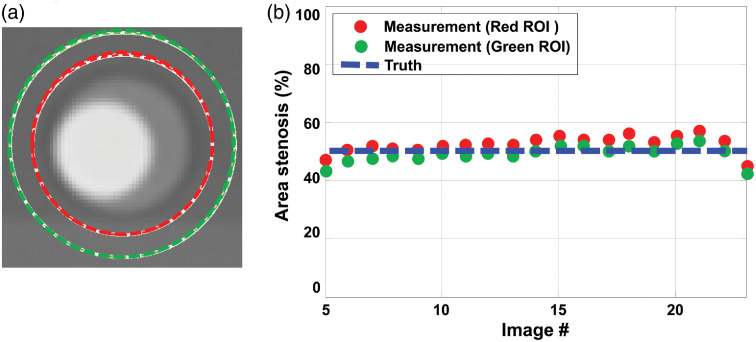
The material decomposition method achieved good separation between iodine, calcium, and water for both DECT and PCD-CT data, thereby facilitating the use of iodine density maps for the quantification of stenosis severity; sample PCD-CT images are shown in Fig. 6. Stenosis severity was calculated as the ratio of the iodine mass value at the location of the stenosis to that of an adjacent nonstenotic location. As shown in Fig. 7, accurate and reproducible measurements of stenosis severity were achieved using this method. For example, in phantom A (51% area stenosis), percent area stenosis using PCD-CT images acquired with four-energy thresholds [20, 25, 57, 77] keV yield was over 19 adjacent images.
Fig. 6.
Material decomposition of MECT images yielded good separation between iodine and calcium, thereby facilitating the quantification of stenosis severity. (a) Low-energy-threshold CT images of the four stenosis phantoms after MENLM filtering. (b) Corresponding color-coded iodine density maps in the unit of mg/ml from the material decomposition (blue = background signal containing no iodine). (c) Corresponding color-coded calcium density maps (blue = background signal containing no calcium).
Fig. 7.
(a) Use of different diameter ROIs resulted in negligible variation in (b) stenosis severity measurements, demonstrating that the proposed method does not rely on accurate delineation of the lumen boundaries.
Further, stenosis severity measurements based on iodine density maps showed no dependence on ROI size, providing that the ROI included the entire vessel. This demonstrates the independence of the proposed method on lumen segmentation, which is a major source of variability in current measurement techniques using SECT data. As shown in Fig. 7, the percent area stenosis estimated using two different ROI sizes yielded almost identical results, both of which agreed very well with the true stenosis severity.
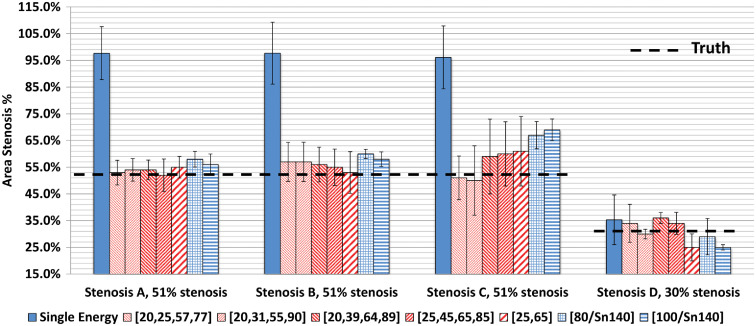
Compared to the SECT results (Fig. 5), the proposed method achieved more accurate estimation of stenosis severity from DECT and PCD-CT images at RD levels (Fig. 8). For PCD-CT four-energy-threshold images, the mean estimation errors were 1.0% to 3.0%, 4.0% to 6.0%, to 9.0%, and 0.0% to 6.0% for the four stenosis phantoms: A, B, C, and D, respectively. For PCD-CT two-energy-threshold and DECT images, the errors were 4.0% to 7.0%, 2.0% to 9.0%, 10.0% to 18.0%, and to , for the four stenosis phantoms, A, B, C, and D, respectively. The differences in errors across the four PCD-CT four-energy-threshold configurations () were small; the average errors were 0.0% to 6.0%, to 6.0%, 3.0% to 8.0%, and 1.0% to 9.0% for the four configurations. However, estimations based on material decomposition using a volume conservation assumption (PCD-CT two-energy-threshold mode and DECT) generally yielded higher or more variable estimation errors. The average estimation error for PCD-CT images acquired using four energy thresholds at the RD level was (); for RD PCD-CT images acquired using two energy thresholds and RD DECT images, the average estimation errors were () and (), respectively.
Fig. 8.
The proposed method yielded more accurate estimation of percent area stenosis for both DECT and PCD-CT images compared to the measurements made using conventional SECT images and a commercial stenosis quantification software application. Data shown are for RD levels.
Finally, differences in image noise levels, achieved using image-based denoising or higher radiation dose levels, had minimal impact on estimation accuracy (Fig. 9). For RD images (including both PCD-CT and DECT images), the mean estimation errors were 1.0% to 7.0%, 2.0% to 9.0%, to 18.0%, and to 6.0% for the four stenosis phantoms, A through D, respectively. The errors for MENLM-filtered RD images for the four phantoms were 3.0% to 7.0%, 6.0% to 9.0%, 1.0% to 19.0%, and to 10.0%, respectively. For high dose images, the errors for the four phantoms were 0.0% to 6.0%, 0.0% to 10.0%, 7.0% to 14.0%, and 3.0% to 11.0%, respectively.
Fig. 9.
The proposed method achieved reproducible measurement of percent area stenosis from DECT and PCD-CT images, which was not strongly affected by image noise levels. The estimation accuracy was similar for routine-dose, RD with MENLM filtering, and high-dose images.
4. Discussion
For both DECT and PCD-CT systems, the proposed method achieved accurate measurements of the percent area stenosis at clinically relevant dose levels. For the four stenosis phantoms containing dense calcifications, estimation errors were below 9% and 18% for PCD-CT four-energy-threshold and DECT or PCD-CT two-energy-threshold images, respectively. These errors were considerably lower than that achieved from conventional single-energy CTA exams and segmentation-based analysis measurements. The proposed approach addresses variations due to changes in spatial resolution or due to lumen edge blurring caused by postprocessing (e.g., digital reformatting) to reorient the vessel for analysis. Our approach does not require manual segmentation (tedious and subject to high interoperator variations) or use of semiautomated segmentation methods, which, while efficient, are also subject to variations due to changes in segmentation thresholds or operators. This makes the proposed method accurate, robust, practical, and efficient. Finally, because the proposed method measures stenosis severity based on the integration of iodine densities over ROIs, the influence of noise is mitigated by the integration. Hence, reducing image noise or increasing radiation dose did not affect the estimation accuracy. In the study, we demonstrated that the proposed method is highly reproducible and robust for different CT systems, i.e., DECT and PCD-CT systems; different scan mode (dual- and multi-energy); different but clinically relevant radiation dose levels; different image slice locations; and different phantom/vessel sizes and stenosis degree.
It should be noted that conventional single-energy CTA can already achieve high sensitivity, specificity, and accuracy for mild stenosese ( diameter stenosis). As shown in Fig. 9, the performance of the proposed method was actually on par with the existing SECT method for the 5.5-mm-diameter phantom with 30% area stenosis (45.5% diameter stenosis). However, for more significant stenosis ( diameter stenosis) with heavy calcifications (i.e., similar to those in phantoms A to C), the proposed method improved the performance over the existing SECT method.
Although the proposed method demonstrated more accurate and reproducible stenosis measurements than the conventional approach, estimation error still existed and was higher than that of the computer simulation results, which were performed with monochromatic x-ray beams. This error may have been caused by several possible sources. First, the CT numbers of the HA cylinders used in this study were higher than those reported from dense calcifications that caused overestimation of stenosis severity in clinical exams.56–59 The high-density calcifications also likely caused beam hardening, which would degrade CT number accuracy. As a result, the accuracy of the iodine map would be degraded, which would impact the accuracy of the stenosis severity measurement. For the evaluated images, only the standard water beam hardening correction available on the systems was performed. We expect that use of second-order beam hardening corrections might improve the accuracy of the stenosis measurements. Second, accurate material decomposition is essential to separate calcium and iodine for the stenosis severity measurements. Material decomposition with an incorrect volume conservation assumption can cause bias in the basis material estimation.45 In this study, we observed that stenosis measurements based on only two unique energy measurements (DECT and PCD-CT with two-energy thresholds), which required a volume conservation assumption for material decomposition, generally yielded higher estimation error. Finally, small errors might have been caused by slight misalignment of stenosis phantoms relative to the axial plane. In spite of these potential sources of error, measured stenosis severity was markedly more accurate using the proposed method relative to use of SECT data and analysis tools that rely on lumen segmentation.
Validation of the accuracy of stenosis quantification is best performed in a phantom model, where truth can be accurately established. Histomorphological estimation of stenosis severity is itself limited due to the tearing/stretching/deformation of the vessel during the explantation, slicing, and staining procedures. Clinical translation of the developed method can be readily achieved by combining existing commercial software tools (e.g., for material decomposition and for centerline tracing and stenosis quantification). With only small changes to existing software packages, accurate and reproducible assessment of stenosis severity can be achieved using DECT or MECT systems, providing more reliable information for the assessment and management of patients with stenotic plaques secondary to coronary artery disease.
5. Conclusions
For both dual-source DECT and PCD-CT systems, the proposed method accurately and reproducibly estimated the percent area stenosis for a variety of vessel sizes, calcification densities, and stenosis degrees using clinically relevant dose levels. This approach requires no lumen segmentation and is, therefore, independent of operator- and software-induced variations. It was also insensitive to variations in important acquisition parameters and generated highly reproducible quantitative assessment of vascular stenosis values, demonstrating the potential to improve the accuracy and precision of stenosis severity measurements in clinical practice.
6. Appendix
Below is the mathematical derivation of the proposed method for the determination of percent area stenosis from iodine density map:
-
1.MECT measures the material-specific and energy-dependent attenuation properties of materials with different elemental compositions and densities. From a material decomposition point of view, the CT measurement of a pixel with a spatial coordinate at different energies , , can be expressed as45
(1)
Here, is a material matrix of size and it only depends on the basis material, the x-ray spectrum, and the detector response. Here, we assume that does not change with spatial coordinates . is an a vector and represents the measured densities for basis materials.
-
2.Here we assume that MECT systems can be treated as linear, shift-invariant (LSI) systems or at least locally LSI.60 Therefore, the MECT measurement, , can be expressed as
(2)
Here, is the corresponding point spread function. and represent the true signal of MECT numbers and basis material densities.
-
3.By combining Eqs. (1) and (2)
(3)
With accurate material decomposition
| (4) |
-
4.In the iodine density map , we can measure the iodine mass inside an ROI, which is equal to the integral of the iodine density inside the ROI multiplied by the pixel volume :
where is the integral of point spread function inside the ROI and represents the true iodine density. Here, for simplicity, the ROI is defined as a rectangle with dimensions () but Eq. (5) can be generalized for any shape ROIs.(5) -
5.If we assume that iodine exists only inside the lumen and is uniformly distributed, the iodine mass can be expressed as
where represents the total number of iodine-containing pixels inside the lumen (or iodine pixels) in the ROI.(6) -
6.From Eq. (6), we can demonstrate that the percent area stenosis (or %stenosis) can be obtained using the ratio of the measured iodine mass between vessel locations with and without a stenosis
(7)
Hence, the proposed approach is equivalent to accurate segmentation of iodine pixels (or luminal area) for the measurement of percent area stenosis.
Biographies
Zhoubo Li received his PhD in biomedical engineering from Mayo Graduate School in July 2016. He completed his graduate studies in the CT Clinical Innovation Center at Mayo Clinic, in Rochester, Minnesota. His research interests include CT physics, image quality, and dual- or multi-energy CT applications.
Shuai Leng received his BS and MS degrees in engineering physics from Tsinghua University in 2001 and 2003, respectively, and his PhD in medical physics in 2008 from the University of Wisconsin Madison. He is a professor of medical physics at Mayo Clinic, Rochester, Minnesota, USA. He has authored over 100 peer-reviewed articles. His research interest is in technical development and clinical application of x-ray and CT imaging.
Lifeng Yu is a professor of medical physics at Mayo Clinic and a fellow of the AAPM. He received his BS degree in nuclear physics in 1997 and an MEng degree in nuclear technology in 2000, both from Beijing University, and his PhD in medical physics from the University of Chicago in 2006. His research interests include CT physics, image quality assessment, radiation dose reduction, and spectral CT.
Cynthia H. McCollough received her doctorate degree from the University of Wisconsin in 1991. She is a professor of radiological physics and biomedical engineering at Mayo Clinic, where she directs the CT Clinical Innovation Center. Her research interests include CT dosimetry, advanced CT technology, and new clinical applications, such as dual-energy and multispectral CT. She is an NIH-funded investigator and is active in numerous professional organizations. She is a fellow of the AAPM and ACR.
Biographies of the other authors are not available.
Disclosures
Research reported in this publication was supported by the National Institutes of Health under grant numbers R01 EB016966. The content was solely the responsibility of the authors and does not necessarily represent the official views of the National Institutes of Health. This work was supported in part by the Mayo Clinic X-ray Imaging Research Core. Dr. McCollough receives industry grant support from Siemens. Dr. Halaweish is an employee of Siemens Healthineers.
Contributor Information
Zhoubo Li, Email: lizhoubo@gmail.com.
Shuai Leng, Email: leng.shuai@mayo.edu.
Ahmed F. Halaweish, Email: ahmed.halaweish@siemens.com.
Zhicong Yu, Email: zhicongyu@gmail.com.
Lifeng Yu, Email: yu.lifeng@mayo.edu.
Erik L. Ritman, Email: elran@mayo.edu.
Cynthia H. McCollough, Email: mccollough.cynthia@mayo.edu.
References
- 1.Walker M. D., et al. , “Endarterectomy for asymptomatic carotid artery stenosis. Executive Committee for the Asymptomatic Carotid Atherosclerosis Study,” JAMA 273(18), 1421–1428 (1995). 10.1001/jama.1995.03520420037035 [DOI] [PubMed] [Google Scholar]
- 2.European Carotid Surgery Trialists’ Collaborative Group, “Randomised trial of endarterectomy for recently symptomatic carotid stenosis: final results of the MRC European Carotid Surgery Trial (ECST),” Lancet 351(9113), 1379–1387 (1998). 10.1016/S0140-6736(97)09292-1 [DOI] [PubMed] [Google Scholar]
- 3.Barnett H. J. M., et al. , “Beneficial effect of carotid endarterectomy in symptomatic patients with high-grade carotid stenosis,” N. Engl. J. Med. 325(7), 445–453 (1991). 10.1056/NEJM199108153250701 [DOI] [PubMed] [Google Scholar]
- 4.Liu Q., et al. , “Comparison of high-resolution MRI with CT angiography and digital subtraction angiography for the evaluation of middle cerebral artery atherosclerotic steno-occlusive disease,” Int. J. Cardiovasc. Imaging 29(7), 1491–1498 (2013). 10.1007/s10554-013-0237-3 [DOI] [PubMed] [Google Scholar]
- 5.Saba L., Mallarini G., “A comparison between NASCET and ECST methods in the study of carotids: evaluation using multi-detector-row CT angiography,” Eur. J. Radiol. 76(1), 42–47 (2010). 10.1016/j.ejrad.2009.04.064 [DOI] [PubMed] [Google Scholar]
- 6.Jauch E. C., et al. , “Guidelines for the early management of patients with acute ischemic stroke: a guideline for healthcare professionals from the American Heart Association/American Stroke Association,” Stroke 44(3), 870–947 (2013). 10.1161/STR.0b013e318284056a [DOI] [PubMed] [Google Scholar]
- 7.Ricotta J. J., et al. , “Updated Society for Vascular Surgery guidelines for management of extracranial carotid disease,” J. Vasc. Surg. 54(3), e1–e31 (2011). 10.1016/j.jvs.2011.07.031 [DOI] [PubMed] [Google Scholar]
- 8.Saba L., et al. , “Imaging of the carotid artery,” Atherosclerosis 220(2), 294–309 (2012). 10.1016/j.atherosclerosis.2011.08.048 [DOI] [PubMed] [Google Scholar]
- 9.Anzalone N., et al. , “Carotid artery stenosis: intraindividual correlations of 3D time-of-flight MR angiography, contrast-enhanced MR angiography, conventional DSA, and rotational angiography for detection and grading,” Radiology 236(1), 204–213 (2005). 10.1148/radiol.2361032048 [DOI] [PubMed] [Google Scholar]
- 10.Zhang Z., et al. , “Carotid stenosis degree in CT angiography: assessment based on luminal area versus luminal diameter measurements,” Eur. Radiol. 15(11), 2359–2365 (2005). 10.1007/s00330-005-2801-2 [DOI] [PubMed] [Google Scholar]
- 11.Hankey G. J., Warlow C. P., Sellar R. J., “Cerebral angiographic risk in mild cerebrovascular disease,” Stroke 21(2), 209–222 (1990). 10.1161/01.STR.21.2.209 [DOI] [PubMed] [Google Scholar]
- 12.Kaufmann T. J., et al. , “Complications of diagnostic cerebral angiography: evaluation of 19,826 consecutive patients,” Radiology 243(3), 812–819 (2007). 10.1148/radiol.2433060536 [DOI] [PubMed] [Google Scholar]
- 13.Willinsky R. A., et al. , “Neurologic complications of cerebral angiography: prospective analysis of 2,899 procedures and review of the literature,” Radiology 227(2), 522–528 (2003). 10.1148/radiol.2272012071 [DOI] [PubMed] [Google Scholar]
- 14.Johnston D. C., Goldstein L. B., “Clinical carotid endarterectomy decision making: noninvasive vascular imaging versus angiography,” Neurology 56(8), 1009–1015 (2001). 10.1212/WNL.56.8.1009 [DOI] [PubMed] [Google Scholar]
- 15.Nederkoorn P. J., et al. , “Preoperative diagnosis of carotid artery stenosis: accuracy of noninvasive testing,” Stroke 33(8), 2003–2008 (2002). 10.1161/01.STR.0000021900.58396.44 [DOI] [PubMed] [Google Scholar]
- 16.Anderson G. B., et al. , “CT angiography for the detection and characterization of carotid artery bifurcation disease,” Stroke 31(9), 2168–2174 (2000). 10.1161/01.STR.31.9.2168 [DOI] [PubMed] [Google Scholar]
- 17.Bash S., et al. , “Intracranial vascular stenosis and occlusive disease: evaluation with CT angiography, MR angiography, and digital subtraction angiography,” AJNR Am. J. Neuroradiol. 26(5), 1012–1021 (2005). [PMC free article] [PubMed] [Google Scholar]
- 18.Lev M. H., et al. , “Total occlusion versus hairline residual lumen of the internal carotid arteries: accuracy of single section helical CT angiography,” AJNR Am. J. Neuroradiol. 24(6), 1123–1129 (2003). [PMC free article] [PubMed] [Google Scholar]
- 19.Lubezky N., et al. , “Duplex scanning and CT angiography in the diagnosis of carotid artery occlusion: a prospective study,” Eur. J. Vasc. Endovasc. Surg. 16(2), 133–136 (1998). 10.1016/S1078-5884(98)80154-8 [DOI] [PubMed] [Google Scholar]
- 20.Randoux B., et al. , “Carotid artery stenosis: prospective comparison of CT, three-dimensional gadolinium-enhanced MR, and conventional angiography,” Radiology 220(1), 179–185 (2001). 10.1148/radiology.220.1.r01jl35179 [DOI] [PubMed] [Google Scholar]
- 21.Silvennoinen H. M., et al. , “CT angiographic analysis of carotid artery stenosis: comparison of manual assessment, semiautomatic vessel analysis, and digital subtraction angiography,” AJNR Am. J. Neuroradiol. 28(1), 97–103 (2007). [PMC free article] [PubMed] [Google Scholar]
- 22.Bartlett E. S., Symons S. P., Fox A. J., “Correlation of carotid stenosis diameter and cross-sectional areas with CT angiography,” AJNR Am. J. Neuroradiol. 27(3), 638–642 (2006). [PMC free article] [PubMed] [Google Scholar]
- 23.Porsche C., et al. , “Evaluation of cross-sectional luminal morphology in carotid atherosclerotic disease by use of spiral CT angiography,” Stroke 32(11), 2511–2515 (2001). 10.1161/hs1101.098153 [DOI] [PubMed] [Google Scholar]
- 24.Dodds S. R., “The haemodynamics of asymmetric stenoses,” Eur. J. Vasc. Endovasc. Surg. 24(4), 332–337 (2002). 10.1053/ejvs.2002.1729 [DOI] [PubMed] [Google Scholar]
- 25.Morasch M. D., et al. , “Cross-sectional magnetic resonance angiography is accurate in predicting degree of carotid stenosis,” Ann. Vasc. Surg. 16(3), 266–272 (2002). 10.1007/s10016-001-0102-z [DOI] [PubMed] [Google Scholar]
- 26.Ota H., et al. , “Quantitative vascular measurements in arterial occlusive disease,” Radiographics 25(5), 1141–1158 (2005). 10.1148/rg.255055014 [DOI] [PubMed] [Google Scholar]
- 27.Samarzija K., et al. , “Grading of carotid artery stenosis with computed tomography angiography: whether to use the narrowest diameter or the cross-sectional area,” Insights Imaging 9(4), 527–534 (2018). 10.1007/s13244-018-0622-5 [DOI] [PMC free article] [PubMed] [Google Scholar]
- 28.Bleeker L., et al. , “Semi-automatic quantitative measurements of intracranial internal carotid artery stenosis and calcification using CT angiography,” Neuroradiology 54(9), 919–927 (2012). 10.1007/s00234-011-0998-0 [DOI] [PMC free article] [PubMed] [Google Scholar]
- 29.Borst J., et al. , “Diagnostic accuracy of 4 commercially available semiautomatic packages for carotid artery stenosis measurement on CTA,” AJNR Am. J. Neuroradiol. 36(10), 1978–1987 (2015). 10.3174/ajnr.A4400 [DOI] [PMC free article] [PubMed] [Google Scholar]
- 30.Hameeteman K., et al. , “Evaluation framework for carotid bifurcation lumen segmentation and stenosis grading,” Med. Image Anal. 15(4), 477–488 (2011). 10.1016/j.media.2011.02.004 [DOI] [PubMed] [Google Scholar]
- 31.Manniesing R., et al. , “Robust CTA lumen segmentation of the atherosclerotic carotid artery bifurcation in a large patient population,” Med. Image Anal. 14(6), 759–769 (2010). 10.1016/j.media.2010.05.001 [DOI] [PubMed] [Google Scholar]
- 32.Marquering H. A., et al. , “Performance of semiautomatic assessment of carotid artery stenosis on CT angiography: clarification of differences with manual assessment,” AJNR Am. J. Neuroradiol. 33(4), 747–754 (2012). 10.3174/ajnr.A2838 [DOI] [PMC free article] [PubMed] [Google Scholar]
- 33.Scherl H., et al. , “Semi-automatic level-set based segmentation and stenosis quantification of the internal carotid artery in 3D CTA data sets,” Med. Image Anal. 11(1), 21–34 (2007). 10.1016/j.media.2006.09.004 [DOI] [PubMed] [Google Scholar]
- 34.Biermann C., et al. , “Evaluation of computer-assisted quantification of carotid artery stenosis,” J. Digital Imaging 25(2), 250–257 (2012). 10.1007/s10278-011-9413-y [DOI] [PMC free article] [PubMed] [Google Scholar]
- 35.Saba L., et al. , “Carotid artery stenosis quantification: concordance analysis between radiologist and semi-automatic computer software by using multi-detector-row CT angiography,” Eur. J. Radiol. 79(1), 80–84 (2011). 10.1016/j.ejrad.2009.11.025 [DOI] [PubMed] [Google Scholar]
- 36.Tsiflikas I., et al. , “Carotid artery stenosis: performance of advanced vessel analysis software in evaluating CTA,” Eur. J. Radiol. 81(9), 2255–2259 (2012). 10.1016/j.ejrad.2011.08.011 [DOI] [PubMed] [Google Scholar]
- 37.Zhu C., et al. , “Carotid stenosis assessment with multi-detector CT angiography: comparison between manual and automatic segmentation methods,” Int. J. Cardiovasc. Imaging 29(4), 899–905 (2013). 10.1007/s10554-012-0148-8 [DOI] [PubMed] [Google Scholar]
- 38.Bartlett E. S., et al. , “Quantification of carotid stenosis on CT angiography,” AJNR Am. J. Neuroradiol. 27(1), 13–19 (2006). [PMC free article] [PubMed] [Google Scholar]
- 39.Buerke B., et al. , “Dual-energy CTA with bone removal for transcranial arteries: intraindividual comparison with standard CTA without bone removal and TOF-MRA,” Acad. Radiol. 16(11), 1348–1355 (2009). 10.1016/j.acra.2009.05.007 [DOI] [PubMed] [Google Scholar]
- 40.McCollough C. H., et al. , “Dual- and multi-energy CT: principles, technical approaches, and clinical applications,” Radiology 276(3), 637–653 (2015). 10.1148/radiol.2015142631 [DOI] [PMC free article] [PubMed] [Google Scholar]
- 41.Gutjahr R., et al. , “Human imaging with photon counting-based computed tomography at clinical dose levels: contrast-to-noise ratio and cadaver studies,” Invest. Radiol. 51(7), 421–429 (2016). 10.1097/RLI.0000000000000251 [DOI] [PMC free article] [PubMed] [Google Scholar]
- 42.Yu Z., et al. , “Evaluation of conventional imaging performance in a research whole-body CT system with a photon-counting detector array,” Phys. Med. Biol. 61(4), 1572–1595 (2016). 10.1088/0031-9155/61/4/1572 [DOI] [PMC free article] [PubMed] [Google Scholar]
- 43.Eklof H., et al. , “A prospective comparison of duplex ultrasonography, captopril renography, MRA, and CTA in assessing renal artery stenosis,” Acta Radiol. 47(8), 764–774 (2006). 10.1080/02841850600849092 [DOI] [PubMed] [Google Scholar]
- 44.Saba L., et al. , “Multidetector-row CT angiography in the study of atherosclerotic carotid arteries,” Neuroradiology 49(8), 623–637 (2007). 10.1007/s00234-007-0244-y [DOI] [PubMed] [Google Scholar]
- 45.Li Z., et al. , “Image-based material decomposition with a general volume constraint for photon-counting CT,” Proc. SPIE 9412, 94120T (2015). 10.1117/12.2082069 [DOI] [PMC free article] [PubMed] [Google Scholar]
- 46.Koch C., et al. , “Exercise transcutaneous oxygen pressure measurement has good sensitivity and specificity to detect lower extremity arterial stenosis assessed by computed tomography angiography,” Medicine 95(36), e4522 (2016). 10.1097/MD.0000000000004522 [DOI] [PMC free article] [PubMed] [Google Scholar]
- 47.Portugaller H. R., et al. , “Multislice spiral CT angiography in peripheral arterial occlusive disease: a valuable tool in detecting significant arterial lumen narrowing?” Eur. Radiol. 14(9), 1681–1687 (2004). 10.1007/s00330-004-2289-1 [DOI] [PubMed] [Google Scholar]
- 48.Tian J., et al. , “Prevalence and characteristics of TCFA and degree of coronary artery stenosis: an OCT, IVUS, and angiographic study,” J. Am. Coll. Cardiol. 64(7), 672–680 (2014). 10.1016/j.jacc.2014.05.052 [DOI] [PubMed] [Google Scholar]
- 49.Burman E. D., Keegan J., Kilner P. J., “Pulmonary artery diameters, cross sectional areas and area changes measured by cine cardiovascular magnetic resonance in healthy volunteers,” J. Cardiovasc. Magn. Reson. 18, 12 (2016). 10.1186/s12968-016-0230-9 [DOI] [PMC free article] [PubMed] [Google Scholar]
- 50.Dodge J. T., Jr., et al. , “Lumen diameter of normal human coronary arteries. Influence of age, sex, anatomic variation, and left ventricular hypertrophy or dilation,” Circulation 86(1), 232–246 (1992). 10.1161/01.CIR.86.1.232 [DOI] [PubMed] [Google Scholar]
- 51.Krejza J., et al. , “Carotid artery diameter in men and women and the relation to body and neck size,” Stroke 37(4), 1103–1105 (2006). 10.1161/01.STR.0000206440.48756.f7 [DOI] [PubMed] [Google Scholar]
- 52.Lorbeer R., et al. , “Reference values of vessel diameters, stenosis prevalence, and arterial variations of the lower limb arteries in a male population sample using contrast-enhanced MR angiography,” PLoS One 13(6), e0197559 (2018). 10.1371/journal.pone.0197559 [DOI] [PMC free article] [PubMed] [Google Scholar]
- 53.Kappler S., et al. , “First results from a hybrid prototype CT scanner for exploring benefits of quantum-counting in clinical CT,” Proc. SPIE 8313, 83130X (2012). 10.1117/12.911295 [DOI] [Google Scholar]
- 54.Yu Z., et al. , “Initial results from a prototype whole-body photon-counting computed tomography system,” Proc. SPIE 9412, 94120W (2015). 10.1117/12.2082739 [DOI] [PMC free article] [PubMed] [Google Scholar]
- 55.Li Z., et al. , “An effective noise reduction method for multi-energy CT images that exploit spatio-spectral features,” Med. Phys. 44(5), 1610–1623 (2017). 10.1002/mp.12174 [DOI] [PMC free article] [PubMed] [Google Scholar]
- 56.de Weert T. T., et al. , “In vivo characterization and quantification of atherosclerotic carotid plaque components with multidetector computed tomography and histopathological correlation,” Arterioscler. Thromb. Vasc. Biol. 26(10), 2366–2372 (2006). 10.1161/01.ATV.0000240518.90124.57 [DOI] [PubMed] [Google Scholar]
- 57.Katano H., Yamada K., “Analysis of calcium in carotid plaques with Agatston scores for appropriate selection of surgical intervention,” Stroke 38(11), 3040–3044 (2007). 10.1161/STROKEAHA.107.490581 [DOI] [PubMed] [Google Scholar]
- 58.Miralles M., et al. , “Quantification and characterization of carotid calcium with multi-detector CT-angiography,” Eur. J. Vasc. Endovasc. Surg. 32(5), 561–567 (2006). 10.1016/j.ejvs.2006.02.019 [DOI] [PubMed] [Google Scholar]
- 59.Saba L., Mallarin G., “Window settings for the study of calcified carotid plaques with multidetector CT angiography,” AJNR Am. J. Neuroradiol. 30(7), 1445–1450 (2009). 10.3174/ajnr.A1509 [DOI] [PMC free article] [PubMed] [Google Scholar]
- 60.Prince J. L., Jonathan M. L., Medical Imaging Signals and Systems, Prentice Hall, Upper Saddle River, New Jersey: (2006). [Google Scholar]


