

Abstract
Advances in single-cell RNA sequencing (scRNA-seq) technologies in the past 10 years have had a transformative effect on biomedical research, enabling the profiling and analysis of the transcriptomes of single cells at unprecedented resolution and throughput. Specifically, scRNA-seq has facilitated the identification of novel or rare cell types, analysis of single-cell trajectory construction and stem or progenitor cell differentiation, and comparison of healthy and disease-related tissues at single-cell resolution. These applications have been critical in advances in cardiovascular research in the past decade, as evidenced by the generation of cell atlases of mammalian heart and blood vessels and the elucidation of mechanisms involved in cardiovascular development and stem or progenitor cell differentiation. In this Review, we summarize the currently available scRNA-seq technologies and analytical tools and discuss the latest findings using scRNA-seq that have substantially improved our knowledge on the development of the cardiovascular system and the mechanisms underlying cardiovascular diseases. Furthermore, we examine emerging strategies that integrate multimodal single-cell platforms, focusing on future applications in cardiovascular precision medicine that use single-cell omics approaches to characterize cell-specific responses to drugs or environmental stimuli and to develop effective patient-specific therapeutics.
ToC blurb
Single-cell RNA sequencing (scRNA-seq) technologies have helped to identify rare cell populations and allowed the comparison of healthy and diseased tissues at single-cell resolution. This Review discusses the available scRNA-seq tools and summarizes the scRNA-seq findings that have contributed to our understanding of cardiovascular development and disease.
Introduction
The use of traditional gene-expression analysis techniques, such as quantitative PCR [G], microarray [G] and bulk RNA sequencing [G], involves pooled populations of cells, in which gene-expression levels are averaged among a heterogeneous population and reported as a single data point1. Such measurements can be misleading, especially in populations with a high degree of cellular and transcriptomic heterogeneity consisting of different cell types or indiscriminate states. In the analyses of samples comprising multiple cell types defined by established surface-membrane protein markers, target-cell populations can first be sorted using fluorescence-activated or conjugated magnetic bead-assisted methods and analysed individually2. Although these methods have indeed produced important findings, they are laborious and expensive and are not capable of completely discerning the full spectrum of cell heterogeneity, leaving some subpopulations of cells uncharacterized. The advent of single-cell RNA sequencing (scRNA-seq) technologies has addressed this limitation by facilitating the analysis of the transcriptome [G] of every cell in a given sample at a high resolution and depth3,4. Of note, scRNA-seq allows the unbiased assessment of cellular heterogeneity, identification of new cellular states and populations, and elucidation of dynamic cellular transitions during development and differentiation at unprecedented resolution and accuracy5 (Figs 1,2). For these reasons, scRNA-seq technology has had an immediate and profound effect on the field of cardiovascular research.
Fig. 1 |. Workflow of single-cell RNA sequencing.
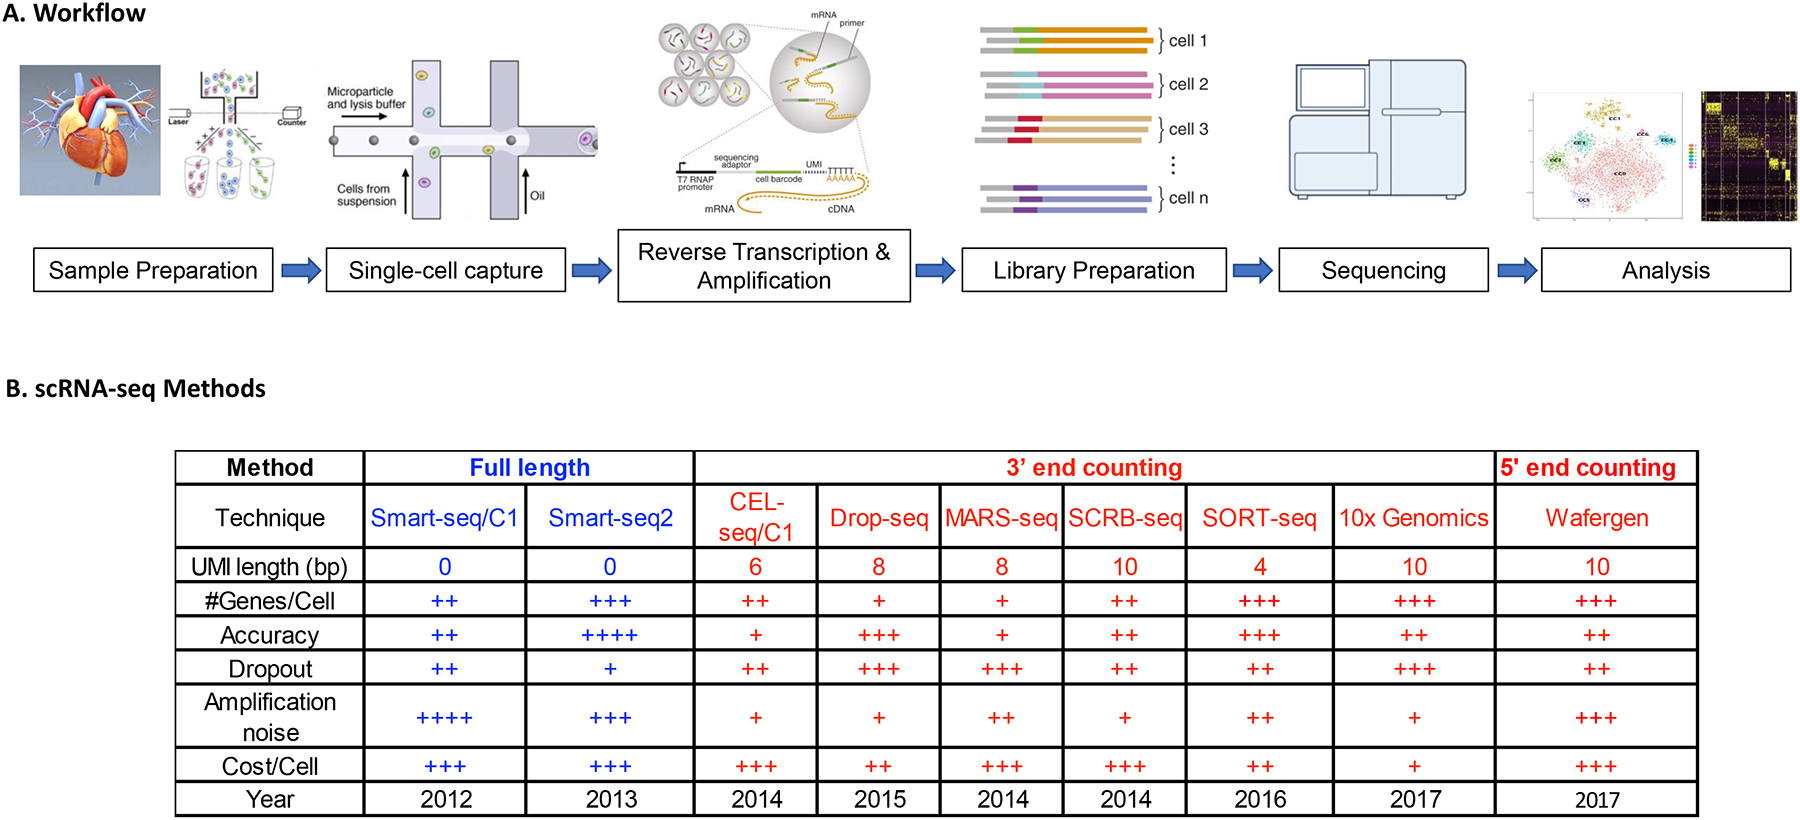
The general experimental workflow of single-cell RNA-sequencing begins with dissociation of the organ or tissue of interest to live single cells, which requires a fine-tuned digestion protocol that maximizes cell number and cell quality while minimizing the duration of digestion and cell death. Cultured cells are likewise detached and prepared as single cells. Prepared cells are then captured by various methods of single-cell capture. Reverse transcription of single-cell RNA is performed, followed by PCR amplification and library preparation of the resulting cDNA. Next-generation sequencing is subsequently performed to generate the readouts, which are aligned to a reference genome, processed for quality control and analysed by the user.
References for Fig. 1B
CEL-seq with UMI (Grün et al., 2014)
SCRB-seq (Soumillon et al., 2014)
MARS-seq (Jaitin et al., 2014)
STRT-C1 (Islam et al., 2014)
Drop-seq (Macosko et al., 2015)
CEL-seq2 (Hashimshony et al., 2016)
SORT-seq (Muraro et al., 2016)
DroNc-seq (Habib et al., 2017)
Seq-Well (Gierahn et al., 2017)
SPLiT-seq (Rosenberg et al., 2018)
sci-RNA-seq (Cao et al., 2017)
STRT-2i (Hochgerner et al., 2018)
Quartz-seq2 (Sasagawa et al., 2017)
10× Genomics Chromium (Zheng et al., 2017)
Wafergen ICELL8 (Gao et al., 2017)
Illumina ddSEQ SureCell
inDrops (Zilionis et al., 2017; Klein et al. 2015)
mcSCRB-seq (Bagnoli et al., 2018)
CEL-seq (Hashimshony et al., 2012)
Smart-seq (Ramskold et al., 2012)
Smart-seq2 (Picelli et al., 2013)
Fig. 2 |. Applications of scRNA-seq in cardiovascular research.
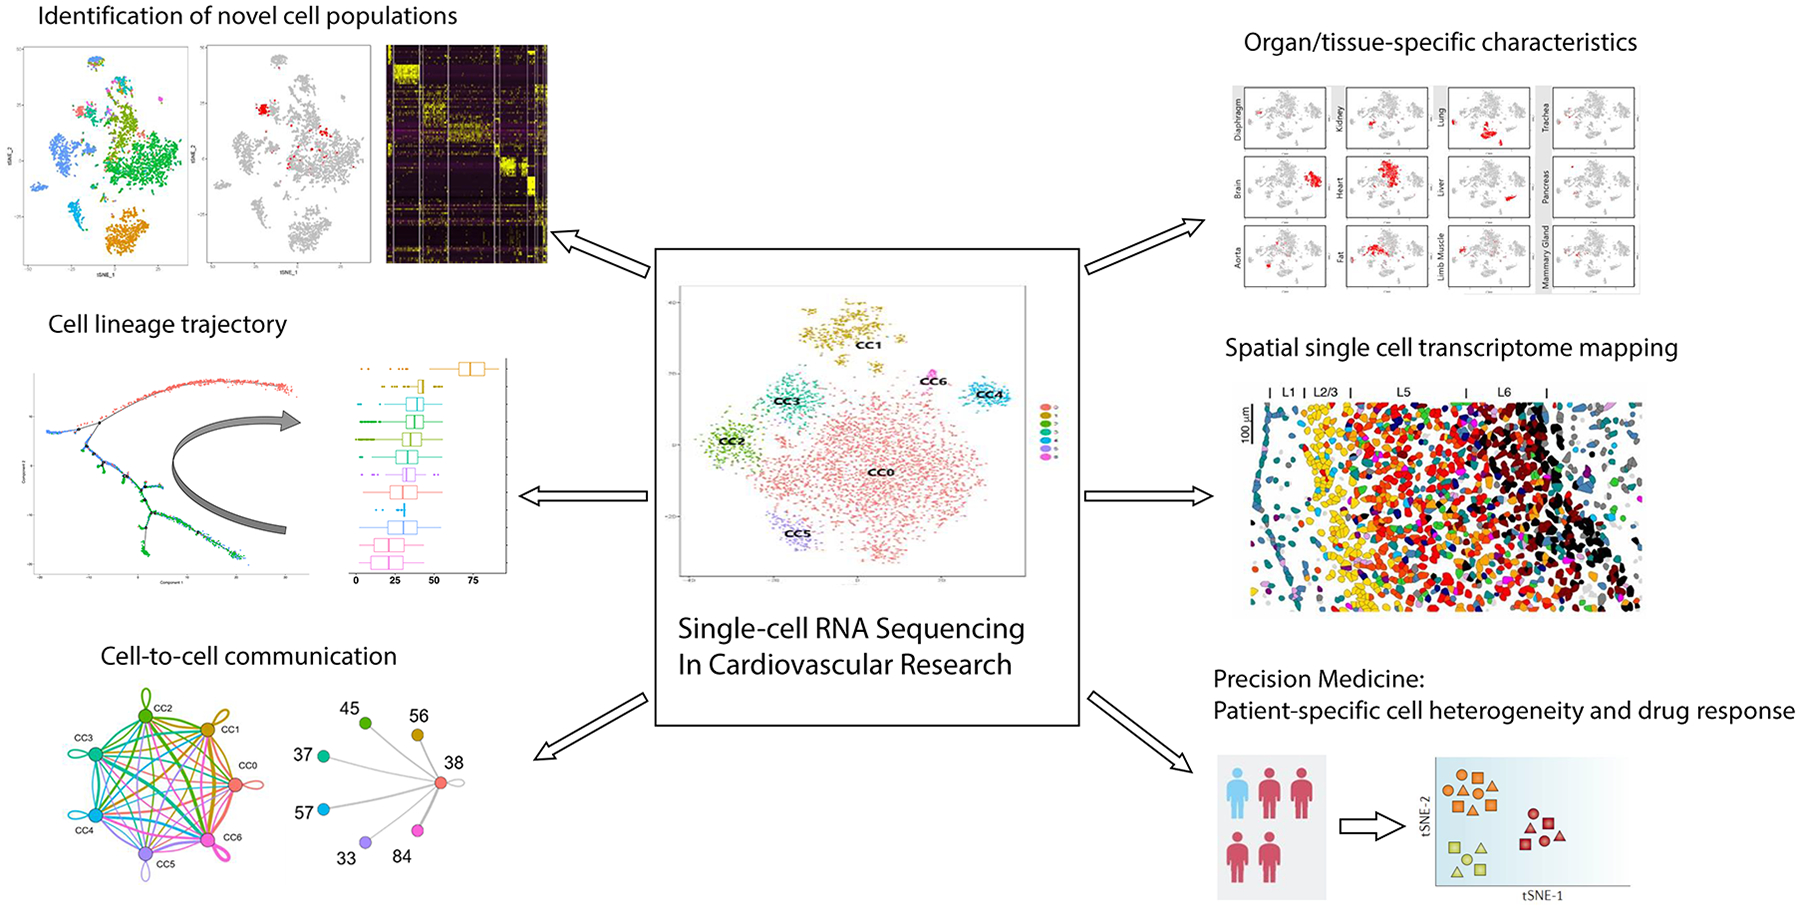
Single-cell RNA sequencing (scRNA-seq) technologies have a wide-range of advantages over conventional bulk gene analysis techniques. In cardiovascular research, scRNA-seq is especially useful for detecting rare cell populations, reconstructing cardiovascular cell trajectory, identifying cell-to-cell interactions, understanding organ-specific or tissue-specific characteristics of vascular cells, spatial transcriptomic mapping of cardiovascular organs and for developing more effective precision medicine tools for better prediction of patient-specific drug responses. All the aforementioned applications are critical to improving our understanding of cardiovascular development, organ homeostasis and disease mechanisms by deciphering cellular heterogeneity at an unprecedented resolution. GRN, gene regulatory network; t-SNE, t-distributed stochastic neighbour embedding.
Applications of scRNA-seq technology in cardiovascular research are wide-ranging (Fig. 2). Beyond the identification of rare subpopulations of cells, scRNA-seq also enables cellular trajectory analysis [G] on the basis of each cell’s transcriptome, which has proven to be particularly useful in elucidating cell state transitions during development and progenitor or stem cell differentiation. Furthermore, scRNA-seq has enabled the generation of transcriptomic and epigenetic atlases of important tissues in adult mice6–8 and human fetuses9–12, including those from the heart and the coronary vessels. With such datasets, organ-specific or tissue-specific transcriptomic features of common cardiovascular cell types, such as endothelial cells, vascular smooth muscle cells and fibroblasts, can be assessed to shed light on the functional heterogeneity of ubiquitously present cell types that underlie their organ-specific roles. Given the capacity of scRNA-seq to cross-analyse the single-cell transcriptome of multiple cell types present in a given sample, intercellular communication via ligand-to-receptor binding can also be predicted on the basis of gene expression13. These types of analyses are expected to be further complemented by advances in spatial transcriptomics14–18, notably by the use of RNA-seq with spatially barcoded primers on a fixed and permeabilized section of tissue to map the transcriptomic information from the known coordinates of the tissue. Importantly, the combination of single-cell genomics, transcriptomics, epigenomics and proteomics will be critical in evaluating cell population heterogeneity and its contributions to patient-specific drug responses and adverse effects.
In this Review, we explore the experimental workflow and applications of scRNA-seq, discuss relevant data analysis strategies and summarize published findings using scRNA-seq in cardiovascular research. In addition, we describe the potential of integrating multimodal single-cell omics platforms, which is expected to improve our ability to interrogate the gaps in our knowledge in the cardiovascular field and accelerate the advancement of precision medicine.
Single-cell RNA sequencing techniques
Experimental workflow
A variety of single-cell methods have been developed in the past 10 years with divergent approaches for cell capture and amplification, as well as differences in mRNA transcript length, number of target-cell captured and read depth per cell19. Each method has unique advantages and disadvantages, but generally, all scRNA-seq techniques developed to date share a common workflow (listed in order): sample preparation, single-cell capture, reverse transcription and amplification, library preparation, sequencing and analysis5 (Fig. 1).
Adequate sample preparation is a prerequisite in generating robust single-cell transcriptome data. Given that every biological sample has its own set of characteristics, the protocol should be optimized depending on a broad range of factors, including tissue or cell types, culture conditions (for example, suspension versus adherent), extracellular matrix content and cell viability. A critical step during sample preparation, particularly for dense tissues and 3D organoid models, is single-cell dissociation that is typically achieved enzymatically under gentle mechanical agitation (and in some cases with tissue perfusion) to limit excessive cell lysis and background noise. The choice of proteolytic enzyme (such as trypsin, collagenase and liberase) and the duration of digestion should also be carefully optimized to maximize single-cell yield while minimizing cell death. When the cells are fully dissociated, they are isolated into single cells using a variety of cell-capture techniques that range from plate-based separation of cells to microdroplet-based approaches. The maintenance of a high number of isolated viable cells, typically in the order of ≥10,000 cells, is key to improving data quality, and the method of cell capture is often determined by the properties of the sample of interest (such as cell size).
When the single cells are successfully captured, they are lysed and processed to create first-strand cDNA by reverse transcription and subsequently undergo second-strand synthesis and PCR amplification. Some scRNA-seq methods (such as the Fluidigm C1 system) require as many PCR amplification reactions as the number of cells profiled, but other techniques (such as droplet-based approaches) allow for pooled PCR using cell barcoding techniques (for example, the 10× Genomics Chromium Single Cell 3ʹ platform), which substantially reduce costs and improve throughput20. After PCR amplification and library preparation, the samples are processed for sequencing. Gene expression within single cells can be quantified by sequencing either the 3ʹ-end, the 5ʹ-end or the full-length transcript, which can retain information on splice variants and immune cell antigen repertoire diversity. Data generated from sequencing are then analysed beyond simple quantification of gene expression to include in-depth examination of cell heterogeneity, lineage transitions and intercellular communication.
Plate-based or microwell-based methods
Current scRNA-seq techniques can be categorized according to the method of single-cell isolation and capture (Table 1), which determines the throughput, depth and scale of the analysis. Plate-based or microwell-based protocols use either automated micropipettes or fluorescence-activated cell sorting [G] (FACS) to isolate individual cells into 96-well or 384-well plates containing a lysis buffer and other processing reagents. A major advantage of this method is the possibility for long-term storage of the cell sample before analysis, which provides flexibility in experimental planning and coordination. Furthermore, full-length transcript sequencing facilitates the identification of isoform splicing in single cells, and this approach also allows for the profiling of all cells independent of type or size, permitting analysis of large and rod-shaped cells, such as adult cardiomyocytes21. Plate-based platforms generally have high sensitivity and can reliably quantify up to 10,000 genes per cell. One downside of this approach, however, is that reverse transcription must be performed in individual wells, which can slow down the workflow, limit throughput and increase noise in downstream analyses.
Table 1 |.
Most common scRNA-seq techniques
| Technique | UMI length (bp) | Number of genes or cells analysed | Sensitivity | Dropout | Amplification noise | Cost per cell | Single-cell capture method | Year | Refs |
|---|---|---|---|---|---|---|---|---|---|
| Full-length transcript | |||||||||
| Smart-seq/C1 | 0 | ++ | ++ | ++ | ++++ | +++ | Plate | 2012 | 22 |
| Smart-seq2 | 0 | +++ | ++++ | + | +++ | +++ | Plate | 2014 | 23 |
| 3ʹ-end counting | |||||||||
| MARS-seq | 8 | + | + | +++ | ++ | +++ | Microfluidic | 2014 | 139 |
| Drop-seq | 8 | + | +++ | +++ | + | ++ | Droplet | 2015 | 20 |
| CEL-seq2/C1 | 6 | +++ | ++ | ++ | + | +++ | Microfluidic | 2016 | 27 |
| SORT-seq | 4 | +++ | +++ | ++ | ++ | ++ | Plate | 2016 | 71 |
| 10× Genomics | 10 | +++ | ++ | +++ | + | + | Droplet | 2017 | 28 |
| mcSCRB-seq | 10 | ++ | ++ | ++ | + | +++ | Plate | 2018 | 140 |
| 5ʹ-end counting | |||||||||
| WaferGen | 10 | +++ | ++ | ++ | +++ | +++ | Nanowell | 2017 | 141 |
CEL-seq, cell expression by linear amplification and sequencing; MARS-seq, massively parallel single-cell RNA-sequencing; mcSCRB-seq, molecular crowding single-cell RNA barcoding and sequencing; scRNA-seq, single-cell RNA sequencing; Smart-seq, switching mechanism at the 5′ end of the RNA template sequencing; SORT-seq, sorting and robot-assisted transcriptome sequencing; UMI, unique molecular identifier.
Microfluidic-based methods
Automated microfluidic-based platforms, such as the Fluidigm C1 system using Smart-seq (Switching Mechanism At the 5ʹ-end of the RNA Transcript sequencing)22–24, were among the earliest scRNA-seq techniques to be introduced and widely commercialized. The C1 system separates and isolates single cells using narrow parallel microfluidic channels, where cell capture, lysis, reverse transcription and multiplexing take place within an integrated fluidic circuit chip. A key feature of this approach is the option of viewing captured cells under the microscope before reverse transcription and amplification25. In addition, the small volumes (<150 nl per well) of cell suspension required for the technique help to reduce the risk of external contamination25. These methods are high in sensitivity and use full-length transcript sequencing, allowing the characterization of isoform slicing, single-nucleotide variants and transcription start sites, and the detection of monoallelic and imprinted genes24. However, in many cases, microfluidic-based platforms require the input of >10,000 cells and are often limited in terms of scale and throughput (~100 to ~1,000 cells per analysis) owing to the limited number of single-cell capture sites per microfluidic array. Furthermore, this approach also requires homogeneity in cell size and is costlier than other techniques, limiting its use for large-scale experiments. On the basis of the cell expression by linear amplification and sequencing (CEL-seq) method that combines linear amplification by in vitro transcription and pooling of barcoded samples to facilitate analysis of many samples in parallel26, a CEL-seq2 protocol was implemented on the Fludigm C1 platform to enable a single library construction and to increase the sensitivity of transcript and gene detection27. Compared with Smart-seq methods that can capture full-length transcripts22–24, CEL-seq2 is limited to 3ʹ-end reading and, therefore, cannot detect alternative splice forms, microRNAs or other non-polyadenylated transcripts.
Droplet-based methods
Droplet-based methods involve the analysis of single cells encapsulated in oil droplets using DNA barcoding technology, which substantially reduce the time and cost needed per analysis. Massive parallelization increases the number of cells profiled for a given run to up to ~10,000 cells per sample20,28. Of note, the commercial Chromium system (10× Genomics) enables 3ʹ-end or 5ʹ-end sequencing of single cells with increased scale and throughput compared with plate-based or microfluidic-based methods, albeit with a trade-off in sensitivity and read depth. Droplet-based methods quantify transcripts by 3ʹ-end or 5ʹ-end sequencing and have reduced transcript recovery rates (3–10%) compared with other existing methods (10–20%)29, with target read depth per cell ranging from 104 to 105 reads25. Nevertheless, the sensitivity of these protocols remains sufficient for large-scale profiling of complex heterogeneous samples and is expected to improve with continued protocol optimization and reductions in cost.
Single-cell capture and sequencing
Cell-capture and quality-control strategies as well as widely used data-analysis approaches are discussed below, as are unique features and limitations in the use of scRNA-seq for cardiovascular cells. Technical details of data-analysis pipelines and algorithms have been reviewed previously25,30.
Single-cell dissociation and preparation
Cell-capture methods differ depending on the scRNA-seq technique used and the origin of the cells. To ensure high-quality scRNA-seq data, proper tissue disaggregation into single cells before cell capture is critical. The main challenges of single-cell preparation include the fragility of the starting sample, physical stress, choice of buffers, duration of cell dissociation and yield of single cells31. Minimum handling while preserving sample integrity and standardization between experiments and runs are key to reducing data variability. Reduction in ‘hands-on’ time minimizes human error and improves consistency and quality of data. For microdroplet-based scRNA-seq, live populations of single cells need to be prepared before single-cell capture, and aggregates or clumps of cells, dead cell debris and free-floating mRNA must be eliminated. From our own experience, we believe that separation of cultured cells is fairly straightforward, given that conventional cell-dissociation methods are sufficient for single-cell preparation. By contrast, enzymatic digestion of primary tissue to single viable cells must be optimized to avoid losing populations of cells that might be more fragile or prone to cell death. Digestion methods should also be optimized according to the tissue of origin, given that the extracellular matrix composition and mechanics of the tissue type might profoundly influence the choice of digestion enzyme, as well as the temperature and duration of digestion32. The labelling of live cells with dyes such as calcein acetoxymethyl (calcein AM), followed by FACS for positive selection of live single cells, is recommended immediately after dissociation. Conversely, nucleic-acid-binding dyes, such as propidium iodide or 7-aminoactinomycin D (7-AAD), bind to free-floating, double-stranded nucleic acid, allowing the use of FACS to isolate live cells by negative selection. In our experience, the use of commercially available cell-debris removal solutions during single-cell preparation can help to increase sample cleanliness and the accuracy of target cell count, especially for cell preparations with <70% viability.
At present, microdroplet-based scRNA-seq cannot be performed in adult cardiomyocytes that measure 120–200 μm in the long axis, because the microdroplets have a diameter of 40 μm. Single-cell nuclei isolation and sequencing are alternative approaches for the analysis of adult cardiomyocytes33–35, although the diploid or multiploid nature of these cells should be taken into account. However, human fetal cardiomyocytes, which are smaller in size, can easily be captured on microdroplet-based platforms. Unlike droplet-based methods, plate-based or microfluidic-based scRNA-seq can accommodate cells of all sizes and shapes, but are limited by laborious and expensive single-cell selection and isolation12. At present, adult cardiomyocytes are typically isolated by FACS using a commercial cell sorter with a 130 μm microfluidic channel36. However, this method might induce terminal damage to the live cardiomyocytes. To that end, the isolation of viable single cardiomyocytes via large-particle FACS (using a sorter with nozzle diameter of 500 μm) has been shown to preserve the RNA quality of the adult isolated single cardiomyocytes better than with the conventional sorter (with a nozzle diameter of 70–130 μm)36.
Quality control and normalization
When single-cell capture, library preparation and sequencing are complete, read alignment can be applied to raw sequencing data to generate feature-barcode matrices with publicly available platforms (such as the Cell Ranger by 10× Genomics) using the universal RNA-seq read aligner STAR. Cell Ranger can also filter and count barcodes and unique molecular identifiers, as well as normalize data from multiple experiments to the same sequencing depth. Other pre-processing pipelines, such as dropEst, Dr.seq2 and scPipe, are also available for expression matrix generation. Existing tools used for bulk RNA-seq data for the removal of cells with low-quality reads, such as FastQC or RNA-SeQC37, can be useful in processing scRNA-seq data. Detailed quality control and normalization methods have been previously published30,38.
After alignment, a number of R packages [G] or python packages [G] can be used for quality control, visualization and analysis of data. To date, Monocle39, Scanpy40, Scater41, Scell42, Seurat43 and SINCERA44 packages are the most frequently used for user-driven, unsupervised single-cell gene-expression analyses. Using Seurat, various quality-control parameters, such as mitochondrial gene percentage, total gene count and number of unique molecular identifiers per cell, can be visualized43. Cells can subsequently be filtered on the basis of user-defined thresholds of these parameters for downstream analysis. Of note, cardiomyocytes have an exceptionally high mitochondrial gene content (58–86% of total transcripts) compared with all other cell types (5–20%)21.
Dimensionality reduction
The multidimensional nature of scRNA-seq data, in which a single dimension represents the expression of a single gene, must be reduced for interpretable visualization and analysis. To date, various algorithms for dimensionality reduction and unsupervised clustering have been developed. The computational and biological advantages and disadvantages in selecting the optimal algorithm for a dataset of interest must be considered, because no single approach is considered the gold standard. Additional details on differences and the specific nature of various algorithms have been previously published45,46.
With the advent of droplet-based scRNA-seq, datasets with ever-increasing size are generated from a greater number of cells captured, providing greater power and improving the capacity to identify rare cell populations. In addition, linear transformation such as principal component analysis [G] (PCA) cannot capture cellular relationships owing to high levels of dropout and noise46. Nonlinear dimensionality reduction algorithms, such as t-distributed stochastic neighbour embedding [G] (tSNE)47 and uniform manifold approximation and projection [G] (UMAP)48 are consequently becoming more popular given their flexibility and capacity to generate visually interpretable results.
Accordingly, publicly available packages allow for the projection and visualization of both tSNE and UMAP from the user-defined PCAs43. The resolution of nonlinear dimensionality reduction, or the k-means value, can be set and adjusted by the user. No single k-means value or the resolution, which is directly related to the number of clusters generated, is impartially correct, requiring the researcher to verify in biological and physiological terms whether the number and the types of clusters obtained from a chosen resolution are indeed valid.
Data analysis
Unsupervised cell population clustering
A prominent advantage of scRNA-seq over traditional bulk analyses is the identification and characterization of heterogeneous cell populations present in a given sample. In biological terms, cell populations in the heart represent different cell types, such as cardiomyocytes, endothelial cells, fibroblasts and immune cells, but they can also represent different functional states of identical cell types, such as ventricular, atrial or pacemaker cardiomyocytes, or angiogenic versus quiescent endothelial cells. Therefore, unsupervised clustering approaches must be performed to define cell populations and to confirm empirically whether the cell populations defined by mathematical clustering indeed represent biologically relevant or correct cell types or states (Fig. 3).
Fig. 3 |. Comparison of cell population clustering methods.
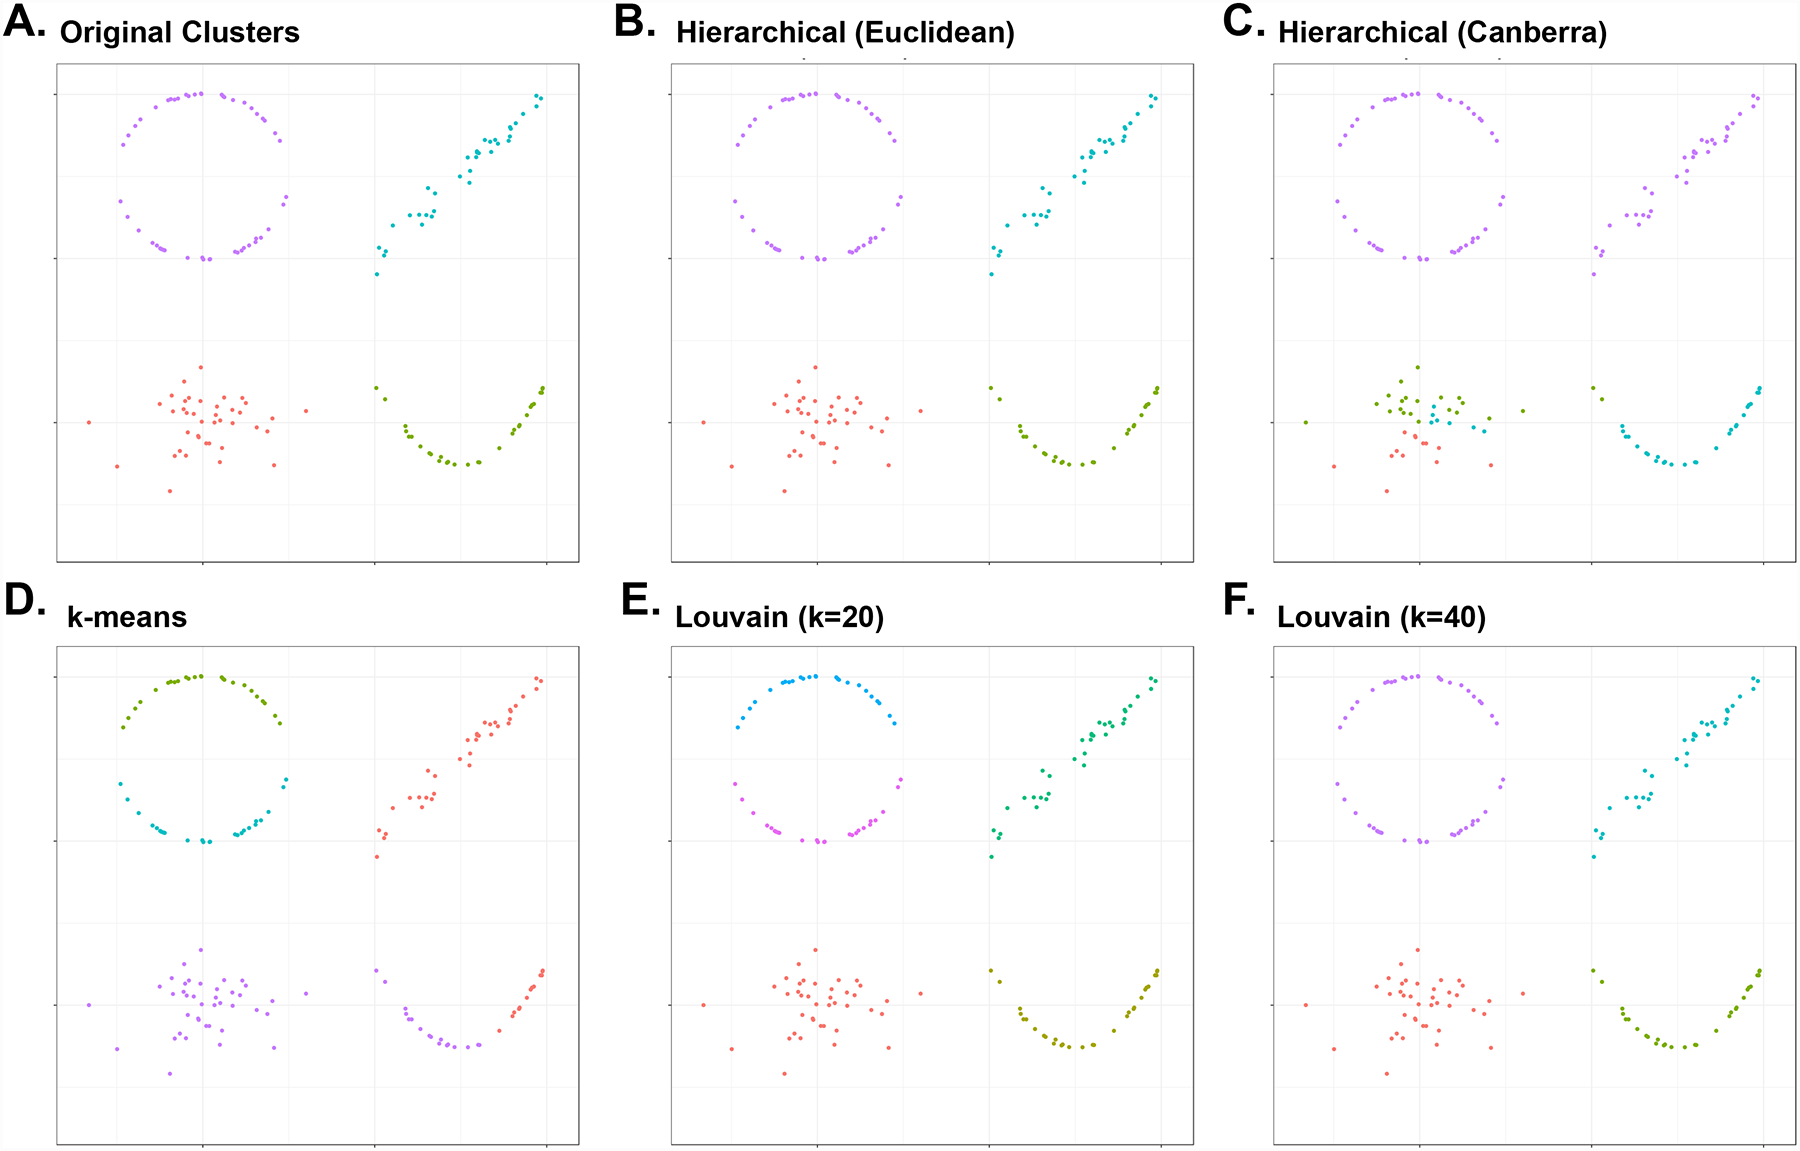
a | Simulated 2D single-cell RNA-sequencing data representing circular (top left), linear (top right), curved (bottom right) and noisy (bottom left) distribution of cells. Colours indicate clusters identified by different clustering methods. Four original clusters are shown. Clusters of the same dataset can change depending on b | hierarchical clustering on Euclidean distance, c | hierarchical clustering on Canberra distance, d | k-means (k = 4), e | Louvain clustering after converting to a 20-nearest neighbour (NN) graph and f | Louvain clustering after converting to a 40-NN graph. In our simulation, hierarchical clustering based on Canberra distance incorrectly subdivided a noisy cluster and merged two distinct clusters. The k-means approach improperly unified the linear trajectory cluster and the ascending part of curve trajectory cluster. The Louvain algorithm incorrectly divided a large cluster into several subclusters when performed with an insufficient number of NNs, whereas the algorithm provided correct clustering when performed with the sufficient number of NNs. Consequently, a universally optimal clustering method for all datasets does not exist, as different types of datasets possess intrinsically unique patterns of cell populations, such as trajectory shape, complexity and noise. Although graph-based algorithms (such as Louvain) show the best performance in general, other clustering methods are still encouraged for comparison. Biological validation must subsequently be performed for verification of the obtained results.
In single-cell studies, supervised clustering refers to the machine learning approach that dictates whether a cell belongs to a cluster on the basis of exemplary cell-to-cluster pairs. For example, MetaNeighbor allows users to assess how cell-type-specific transcriptional signatures are replicated across independent datasets49. Conversely, unsupervised clustering involves machine learning of the structure within the data itself without any intervention from other datasets.
A number of clustering strategies based on machine learning algorithms have been established50. One popular strategy is the k-means approach that iteratively identifies the closest k cluster centre to which each cell is assigned. This strategy is an example of unsupervised clustering, given that the number of clustering k is a parameter arbitrarily defined by the users and not learned from any previous datasets. This approach is generally used after feature selection and dimensionality reduction and does not require heavy computing power. The main disadvantage of the k-means approach is that it assumes a predetermined number of round, equally sized clusters, which when violated results in failure to detect possible rare cell populations.
Another widely used method is hierarchical clustering, which combines individual cells into larger clusters or divides clusters into smaller subclusters46. This strategy involves calculation of the distance between cells using measurements such as Euclidean distance tools [G]. The hierarchical clustering approach is slower than k-means, but allows the identification of relationships among clusters of different granularities. Hierarchical clustering methods include clustering through imputation and dimensionality51, pcaReduce52 and SINCERA44.
Graph clustering is a third approach involving community detection-based algorithms that is widely used for analysis of larger datasets. The advantage of community detection methods is its scalability to millions of cells. The Louvain algorithm is currently one of the most popular community detection algorithms used in scRNA-seq data analysis46. This approach first treats each individual cell as an independent cluster, then performs modularity optimization in a stepwise manner. For each cell, the algorithm checks if the network modularity can be increased by moving the cell from its current cluster to another cluster. Subsequently, the cells belonging to the same cluster are aggregated as a ‘super’ cell to form a new network. These two steps are repeated iteratively until the modularity cannot be increased any further. The Louvain algorithm can be performed using the PhenoGraph53 and Seurat43 methods. Other independent unsupervised clustering approaches include Bayesian Information Criterion and Akaike Information Criterion, which can be applied to estimate the optimal number of clusters54.
Lineage reconstruction
Cell-trajectory analysis tools enable temporal ordering of cell lineage or biological states of populations of cells from multiple time points during development or stem or progenitor cell differentiation, in the notion of ‘pseudotime’, a scalar measure of a cell’s path along time in an unsupervised manner55. In the past 5–6 years, four main types of lineage reconstruction algorithms have been developed on the basis of dimensionality reduction, the nearest neighbour graph, cluster networks and RNA velocity. The computational and biological details of each approach and how the combination of single-cell transcriptomics and genetic lineage tracing can advance our understanding of development, tissue homeostasis and disease have been described previously56. Lineage reconstruction tools have been particularly useful in delineating coronary artery development57, first and second heart field progenitor specification58, and gene-expression changes in all major cell types involved in human heart development12.
In the past year, lineage tracing beyond expression-based computational reconstruction has been made possible by tracking somatic mutations in mitochondrial DNA (mtDNA), using either scRNA-seq or an analogous method for assessing chromatin accessibility (such as a single-cell assay for transposase-accessible chromatin using sequencing (scATAC-seq))59,60. Mutation rates for mtDNA are typically 10-fold to 100-fold greater than those for nuclear DNA, and investigators in numerous studies have exploited this difference to demonstrate that the accumulation of mtDNA mutations could be used as endogenous genetic barcodes to trace cell lineages both in vitro and in vivo59,60. mtDNA sequence variations have been tracked for the reconstruction of cellular relationships in clonal mixtures of haematopoietic cells and solid tumours59. This approach enabled a 1,000-fold increase in clonal tracking scale compared with that by nuclear genome sequencing. A similar method formed on the basis of scATAC-seq (epigenome and mitochondrial barcode of lineage from endogenous mutations, or EMBLEM) was developed concurrently to facilitate the analysis of clonal evolution of haematopoietic stem cells and their progenies in patients with acute myeloid leukemia60. These single-cell methods complement the existing genetic lineage-tracing technology and extend clonal tracking studies to virtually any cell or tissue type in any eukaryotic organism, including human cardiovascular tissues.
Prediction of intercellular communication
Paracrine signalling pathways are virtually impossible to analyse and interpret among different cell and tissue types using traditional bulk analysis tools. The development of informatics tools for analysing scRNA-seq data offers a promising solution for the investigation of intercellular communication and signalling within a given sample. For example, a list of >2,000 mouse ligand–receptor pairs has been constructed on the basis of an existing human database13 to analyse the expression patterns of ligand–receptor pairs in each cell type in the adult mouse heart61. Surprisingly, the analysis revealed a dense communication network among the non-cardiomyocyte populations; cardiac fibroblasts were identified as the most trophic cell population, with intimate multicellular connections that support the survival of specific neighbouring cell populations. In the fetal mouse heart, intercellular communication analysis was performed to identify epicardium-secreted and endocardium-secreted paracrine factors that regulate cardiomyocyte proliferation and the transition of trabecular-to-compact myocardium during heart formation62. scRNA-seq of human induced pluripotent stem cells [G] (iPSCs) subjected to endothelial cell differentiation similarly revealed extensive intercellular interactions and molecular crosstalk among various cell types generated during differentiation63. However, these interaction networks do not take into account the actual anatomical positions or boundaries of cell types, nor do they provide definitive evidence of cellular crosstalk. Adequate in vivo or in vitro experiments, including but not limited to FACS, immunohistochemistry [G], in situ hybridization [G] or enzyme-linked immunosorbent assay [G] (ELISA) should be performed on the corresponding biological samples to validate in silico cell-type identification and ligand–receptor pair prediction analysis. Nevertheless, these aforementioned tools are powerful for large-scale, unsupervised prediction of multicellular signalling pathways within a heterogeneous population of cells. Intercellular communication prediction analyses using scRNA-seq can therefore complement various orthogonal methods (such as proteomics) and imaging modalities for the discovery and elucidation of new mechanisms of cellular crosstalk.
Generation of cardiovascular cell atlases
Cardiac development
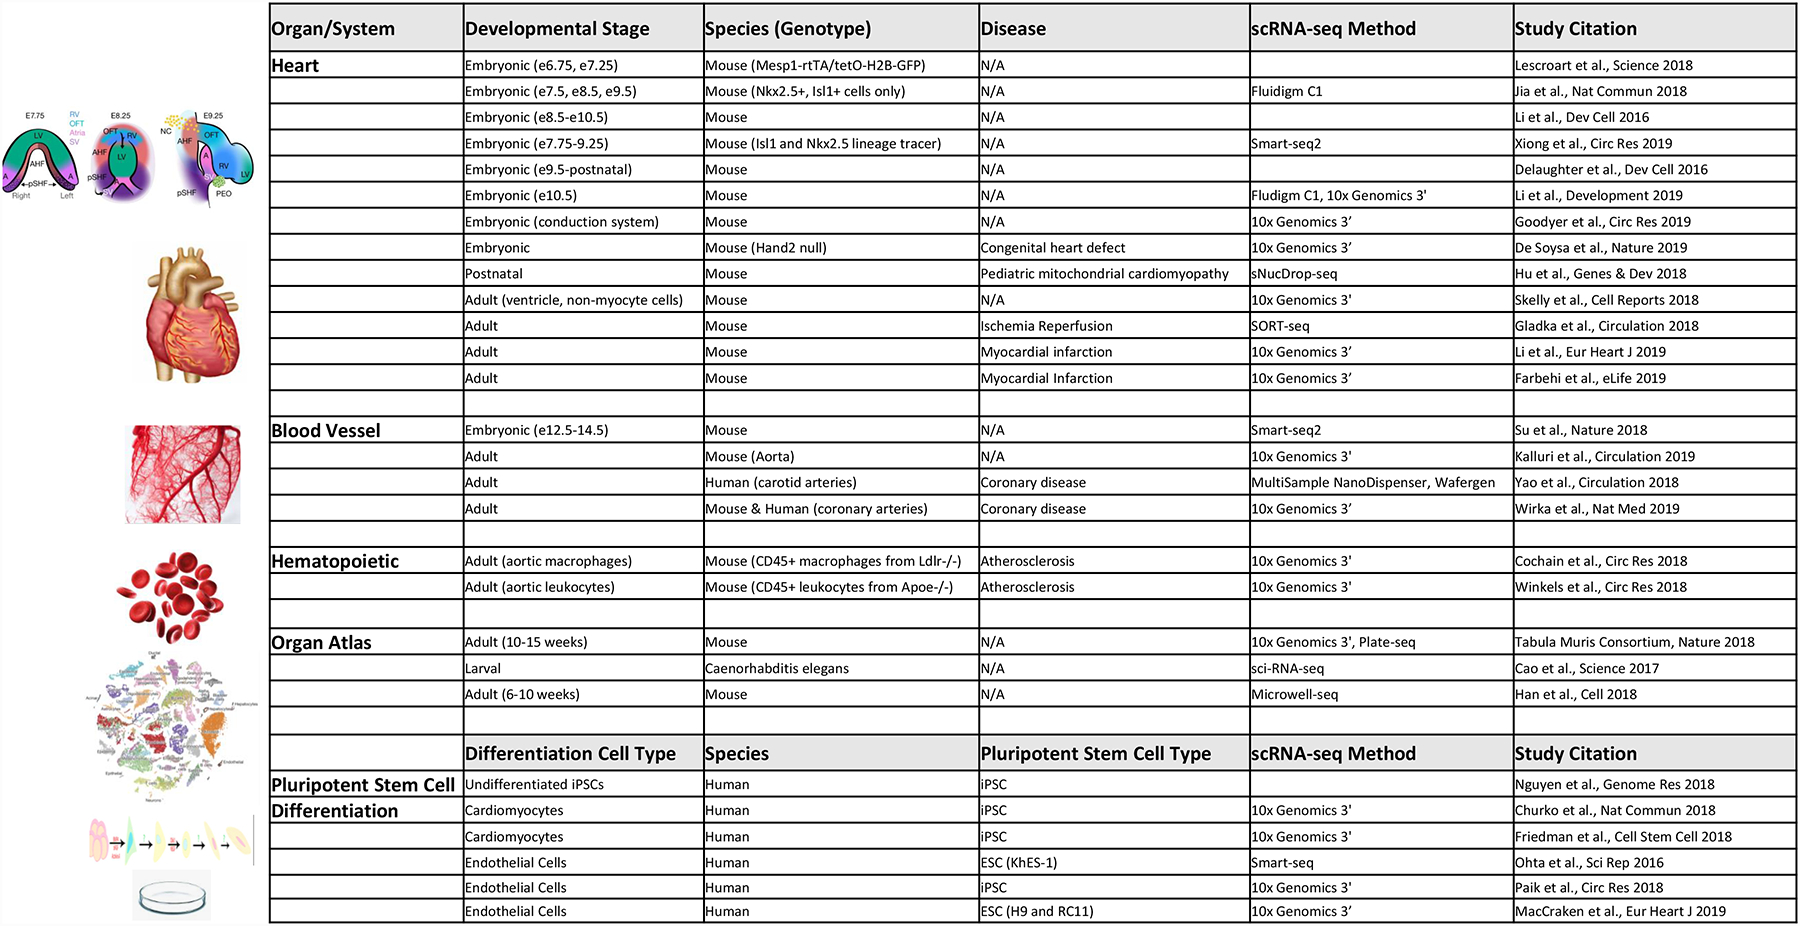
scRNA-seq has been used to profile a broad range of tissues and cell types of the cardiovascular system (Table 2). In 2016, two groups independently generated single-cell maps of all major cardiac cell types at various stages of development by profiling anatomically defined regions of the embryonic heart64,65. Li and colleagues used a random forest algorithm to analyse the transcriptional profiles of E8.5–E10.5 mouse hearts and were able to predict with >91% accuracy the anatomical locations of individual cardiomyocytes during development, including lineage-traced cells marked by islet 1 (ISL1; also known as insulin gene enhancer protein ISL1) that populate the outflow tract and right ventricle64. DeLaughter and colleagues used a similar approach, profiling cells from E9.5 to postnatal day 21 hearts to uncover stage-specific cardiomyocyte transcriptional programmes during embryonic and postnatal maturation65. Both studies found that a deficiency in homeobox protein Nkx-2.5 resulted in severe defects in cardiomyocyte maturation and described substantial heterogeneity of known cardiac cell types in the developing embryo52,53.
Table 2 |.
scRNA-seq studies of cardiovascular organs
| Organ system | Developmental stage | Species (genotype) | Disease | Single-cell capture and scRNA-seq method | Refs |
|---|---|---|---|---|---|
| Heart | Embryonic (E6.75, E7.25) | Mouse (Mesp1-rtTA/tetO-H2B-GFP) | NA | Smart-seq2 | 66 |
| Embryonic (E7.5, E8.5, E9.5) | Mouse (Nkx2–5+, Isl1+ cells only) | NA | Fluidigm C1, ICELL8 | 68 | |
| Embryonic (E8.5–E10.5) | Mouse | NA | Fluidigm C1 | 64 | |
| Embryonic (E7.75–E9.25) | Mouse (ISL1 and Nkx-2.5 lineage tracer) | NA | Smart-seq2 | 69 | |
| Embryonic (E9.5 to postnatal) | Mouse | NA | Fluidigm C1 | 65 | |
| Embryonic (E10.5) | Mouse | NA | Fluidigm C1, 10× Genomics 3ʹ | 62 | |
| Embryonic (conduction system) | Mouse | NA | 10× Genomics 3ʹ | 142 | |
| Embryonic | Mouse (Hand2-null) | Congenital heart defect | 10× Genomics 3ʹ | 70 | |
| Embryonic (5–25 weeks of gestation) | Human | NA | STRT-seq | 12 | |
| Postnatal | Mouse | Paediatric mitochondrial cardiomyopathy | sNucDrop-seq | 34 | |
| Adult (ventricle, non-myocyte cells) | Mouse | NA | 10× Genomics 3ʹ | 61 | |
| Adult | Mouse | Ischaemia–reperfusion | SORT-seq | 21 | |
| Adult | Mouse | Myocardial infarction | 10× Genomics 3ʹ | 143 | |
| Adult | Mouse | Myocardial infarction | 10× Genomics 3ʹ | 78 | |
| Adult | Zebrafish | Cryoinjury | SORT-seq | 75 | |
| Adult | Human | NA | 10× Genomics 3ʹ | 82 | |
| Blood vessels | Embryonic (E12.5–E14.5) | Mouse | NA | Smart-seq2 | 57 |
| Adult | Mouse | NA | 10× Genomics 3ʹ | 85 | |
| Adult | Human | Coronary artery disease | MultiSample NanoDispenser, WaferGen | 92 | |
| Adult | Mouse and human | Coronary artery disease | 10× Genomics 3ʹ | 91 | |
| Adult (vascular cell types in femoral artery) | Mouse (Sca1+) | NA | 10× Genomics 3ʹ | 144 | |
| Haematopoietic cells | Adult (aortic macrophages) | Mouse (CD45+ macrophages from Ldlr–/–) | Atherosclerosis | 10× Genomics 3ʹ | 93 |
| Adult (aortic leukocytes) | Mouse (CD45+ leukocytes from Apoe–/–) | Atherosclerosis | 10× Genomics 3ʹ | 94 | |
| Adult (cardiac immune cells) | Mouse (CD45+ immune cells) | Transverse aortic constriction | 10× Genomics 3ʹ | 145 | |
| Organ atlas | Larval | Caenorhabditis elegans | NA | sci-RNA-seq | 108 |
| Adult (10–15 weeks) | Mouse | NA | 10× Genomics 3ʹ, Plate-seq | 6 | |
| Adult (6–10 weeks) | Mouse | NA | Microwell-seq | 7 | |
| Adult | Mouse | NA | sci-ATAC-seq | 114 |
GFP, green fluorescent protein; NA, not applicable; rtTA, reverse tetracycline-controlled transactivator; sci-ATAC-seq, single-cell combinatorial indexing assay for transposase-accessible chromatin using sequencing; sci-RNA-seq, single-cell combinatorial indexing RNA sequencing; scRNA-seq, single-cell RNA sequencing; Smart-seq, switching mechanism at the 5′ end of the RNA template sequencing; sNucDrop-seq, single-nucleus droplet-based RNA sequencing; SORT-seq, sorting and robot-assisted transcriptome sequencing; STRT-seq, single-cell tagged reverse transcription sequencing.
scRNA-seq has also proven exceptionally useful for the identification of mechanisms that regulate the emergence and segregation of early cardiac lineages that form the heart. Single-cell transcriptome profiling of mouse wild-type and Mesp1-negative cardiovascular progenitor cells (CPCs) has shown, for example, that Mesp1 is required for progenitor cell exit from pluripotency and induction of cardiac gene-expression programmes during early gastrulation66. Distinct Mesp1 CPC populations were found to correspond to progenitors that give rise to different lineages and anatomical regions of the heart, and key molecular fingerprints associated with lineage commitment and diversification during early cardiogenesis were identified, as previously shown by Cre–loxP-mediated lineage-tracing studies67. scRNA-seq of Nkx2–5+/– and Isl1+/+ CPCs has also led to the identification of previously unknown progenitor subpopulations during the early phase of cardiac fate decision-making68. Analysis of developmental trajectories also revealed that prolonged expression of Nkx-2.5 commits CPCs to a unidirectional cardiomyocyte fate, whereas Isl1+/+ CPCs pass through an attractor state before diverging into multiple developmental branches68. Similarly, scRNA-seq of cells isolated from Nkx-2.5 and ISL1 lineage-tracing embryonic mouse hearts to assess differentiation of first and second heart field progenitors led to the identification of differences in differentiation kinetics between the two progenitor cell types and revealed the presence of intercellular communication among CPCs and the terminally differentiated cardiovascular cells69. Likewise, scRNA-seq analysis of cardiopharyngaeal development in tunicate Ciona intestinalis revealed distinct molecular signalling pathways in first and second heart lineages58. A network-based computational method has also been used to predict lineage-specifying transcription factors, from which Hand2 was identified as a marker of the presence of outflow tract cells, but not right ventricular cells70. Interestingly, the right ventricle was not properly formed in Hand2-negative mouse embryos, and subsequent scRNA-seq analysis showed that the failure of outflow tract myocardium specification, not right ventricular myocardium specification, was responsible for the congenital heart defect phenotype. These findings show that understanding the pathogenic mechanisms of congenital heart disease at the single-cell level is critical in accurately defining and locating subpopulations of cells that underlie phenotypic presentation of the disease. Moreover, future applications of single-cell sequencing will help to identify unique patient-specific aetiologies, which might vary in pathobiology owing to differential cell heterogeneity and gene-expression patterns that nonetheless elicit a shared disease phenotype.
Adult cardiac homeostasis and disease
In addition to embryonic and postnatal hearts, single-cell transcriptomics have been used to characterize cell subpopulations in the hearts of adult mice. Through scRNA-seq of non-cardiomyocyte cells from uninjured adult mouse hearts, an extensive network of intercellular communication was identified among endothelial cells, cardiac fibroblasts and immune cells that is potentially involved in the maintenance of cardiac homeostasis61. Furthermore, cardiac cell-type-specific and sex-specific differences in gene expression might also be involved in cardiac homeostasis and remodelling. Single-nucleus RNA sequencing of postnatal mouse hearts led to the discovery of cell-type-specific defects in a mouse model of paediatric mitochondrial cardiomyopathy34. Furthermore, analysis of adult hearts under both homeostatic conditions and after ischaemic injury using SORT sequencing71 revealed multiple subpopulations within known cell types21. All cells in the adult mouse heart, including cardiomyocytes, were isolated using FACS through a large nozzle measuring 130 μm in diameter; the use of a high forward scatter width led to enriched isolation of large and irregularly shaped adult cardiomyocytes, as confirmed using a tdTomato reporter lineage-tracing approach. Two independent groups were able to obtain viable adult cardiomyocytes by Langendorff-free, enzymatic dissociation of ventricular tissue21,72, whereas another research group reported difficulties in isolating viable and unfragmented ventricular cardiomyocytes without using a Langendorff apparatus72. Gladka and co-workers demonstrated that ischaemia–reperfusion triggered the emergence of a previously unknown cell subpopulation within various cell types and identified an increase in Ckap4 in activated fibroblasts21. Using Langendorff perfusion and chunk-based methods73 to dissociate mouse and human ventricles, respectively, Nomura and colleagues performed scRNA-seq of adult cardiomyocytes on the Smart-seq2 platform to identify gene modules of hypertrophic cardiomyocytes at the single-cell level74. Notably, Monocle-based cellular-trajectory analysis of cardiomyocytes at various time points from mice that had undergone transverse aortic constriction revealed the critical role of the p53–myocyte-specific enhancer factor 2–nuclear factor erythroid 2-related factor 2 signalling axis in promoting the activation of pathogenic gene programmes in a subpopulation of hypertrophic cardiomyocytes after accumulation of oxidative DNA damage. These findings were corroborated by data obtained by scRNA-seq of cardiomyocytes from patients with heart failure74. scRNA-seq of border-zone cardiomyocytes in cryoinjured zebrafish hearts revealed that the single-cell transcriptome of border-zone cardiomyocytes after injury resembled that of embryonic cardiomyocytes, which explained the observed switch of trabecular cardiomyocytes to cortical cardiomyocytes during zebrafish cardiac regeneration, giving rise to both trabecular and cortical cell types75.
To investigate endothelial cell heterogeneity in newly formed blood vessels after myocardial infarction (MI), Li and colleagues performed droplet-based scRNA-seq of endothelial cells isolated from endothelial-specific lineage-tracing mouse hearts at baseline and 7 days after MI76. Among the ten endothelial cell clusters identified by PCA, five clusters were substantially enriched in the hearts after MI compared with controls, together with an upregulation in genes associated with cardiac remodelling, endothelial cell–extracellular matrix interaction, proliferation and cell-cycle regulation. Plasmalemma vesicle-associated protein (PV1) was highly expressed in three of the five clusters in both mouse models of MI and human hearts after MI77. Interestingly, this increase in expression of PV1 was localized to the endothelial cells in the infarct border zone, a molecular pattern shared by the localization of growth factors that promote endogenous cardiac tissue repair after MI. Similar analyses in cardiac fibroblasts and immune cells 7 days after MI revealed a dynamic flux of these non-cardiomyocyte cell populations, each with their own intermediate transition states and unique transcriptional signatures78.
Taken together, an increasing number of studies have used scRNA-seq to shed light on the roles of various non-cardiomyocyte cell populations after MI, advancing our understanding of microenvironment changes during ischaemic tissue remodelling. Future studies would benefit from a more in-depth mechanistic investigation of the specific functions of these cell types and transition states, particularly at various stages after injury, such as during early acute inflammation (1 day after MI) and late remodelling (30 days after MI). Such an investigation would allow for better characterization of the dynamics of endothelial-to-mesenchymal transition during pathological cardiac fibrosis79,80 or mesenchymal-to-endothelial transition during neovascularization81. For now, transcriptomic investigation and subsequent validation of intercellular communication between non-cardiomyocyte cells and cardiomyocytes during tissue repair and remodelling have not been adequately studied, and filling in these gaps in our knowledge is critical to improving our understanding of the cellular responses involved in the different phases of cardiac injury and repair.
scRNA-seq has also been performed to profile the gene-expression landscape of cardiac cells from human embryos12. Approximately 4,000 anatomically defined cardiac cells from 18 human embryos (ranging from 5 to 25 weeks of gestation) were profiled by single-cell tagged reverse transcription sequencing to map the developmental trajectory of the human heart. Four major cardiac cell types (cardiomyocytes, endothelial cells, fibroblasts and valve interstitial cells) were identified, and both cardiomyocytes and fibroblasts were shown to undergo stepwise changes in gene expression during development12. Importantly, a comparative analysis between human and mouse hearts revealed several features unique to human heart development, suggesting the presence of interspecies differences that might not be evident in bulk analyses, but which might be discernible at the single-cell transcriptome level. Cui and co-workers compared four major cell types in the developing heart (cardiomyocytes, endothelial cells, fibroblasts and epicardial cells) between mouse and human scRNA-seq datasets and reported that among the cell types studied, cardiomyocytes from humans and mice were the most transcriptionally similar12. Further transcriptome analysis revealed that cardiomyocytes at E10.5 in mice and 7 weeks in humans were the most similar, whereas 5-week-old fibroblasts from humans were most similar to those in mice at E9.5, indicating an asynchronous timeline between mice and humans in differentiation and maturation of cardiac cell types during development. Furthermore, RNASE1 was found to be specifically expressed in human endothelial cells, THY1 in human fibroblasts, and CFB and ITLN1 in human epicardial cells, which were all expressed at low levels in the mouse heart. By contrast, Icam2 was specifically expressed in mouse endothelial cells and Rnf213 in mouse epicardial cells, highlighting both interspecies similarities and differences in the gene-expression profiles of different cell types. Efforts to generate a large-scale, single atlas of human adult hearts are currently underway, notably with the use of single-nuclei RNA-seq of cardiomyocytes and scRNA-seq of non-myocytes82. Altogether, these studies demonstrate the utility of scRNA-seq in providing insight into cell–cell variability and in identifying key transcriptional programmes in cardiac development and disease.
Vascular and haematopoietic cells
Coronary vessel formation is a highly dynamic and well-orchestrated developmental process. Although the development of arteries and veins is governed by transcriptional programmes that are antagonistic to each other, pre-existing veins can often give rise to neo-arteries through an unknown cell-fate conversion during development and regeneration83,84. scRNA-seq technology has been critical in elucidating these dynamic cell transitions in vascular development. For example, combining scRNA-seq with lineage-tracing transgenic mice has revealed that coronary arteries are formed by a specific pre-artery population derived from vein cells during development57. Vein cells were found to switch gradually from a venous to an arterial phenotype, until a subpopulation of cells overcame a transcriptional threshold to transition into the pre-artery state. The vein-specifying transcription factor COUP transcription factor 2 (COUP-TF2) was established as a key mediator of this fate switch, providing molecular insight into the mechanisms of vein-derived artery formation. A single-cell atlas of the aorta in healthy adult mice identified all cell types of the aorta and its subpopulations85, and a comparison of aortas from young (8 weeks) and old (18 months) mice showed substantial transcriptomic differences in the endothelial cell populations86.
scRNA-seq has also been used to characterize cell states and fate decisions in major vascular diseases. Atherosclerotic arteries are composed of a broad range of cell types, including endothelial cells, vascular smooth muscle cells (VSMCs) and immune cells, which all show varying levels of plasticity and sensitivity to extracellular cues87–90. In particular, VSMCs are known to be highly plastic despite being a terminally differentiated cell type, and the use of single-cell analysis has been instrumental in delineating the cellular phenotypic modulation of VSMCs to a unique fibroblast-like cell (termed ‘fibrocytes’)91. Furthermore, single-cell analysis has facilitated the identification of specific histone variants that direct VSMC differentiation states in human atherosclerotic vessels92. Atherosclerotic arteries are also typically characterized by a large number of immune cells, including several macrophage subsets whose function and phenotype are poorly characterized, in part owing to a restricted number of markers. To this end, the application of unsupervised clustering analysis of scRNA-seq data involving macrophages in healthy and atherosclerotic aorta can allow the identification of myeloid subpopulations enriched in the diseased aorta compared with healthy controls93. These subsets included monocytes, monocyte-derived dendritic cells and two macrophage populations enriched in inflammatory molecules that activate triggering receptor expressed on myeloid cells 2 (TREM2) and IL-1β seen almost exclusively in atherosclerotic aorta. Similarly, a single-cell profiling approach was used in combination with mass cytometry [G] (CyTOF) to generate a broader atlas of the immune-cell repertoire in mouse atherosclerotic plaques94. In total, 11 distinct leukocyte populations were identified in diseased aorta, including three principal B cell subpopulations, in addition to several cell-type-specific pathways that were enriched in aortic leukocytes. Importantly, the composition of aortic leukocytes was predictive of clinical events in patients with atherosclerosis, indicating the translational potential of single-cell analyses. scRNA-seq of aortic endothelial cells from the descending aortas of mice aged 6–8 weeks revealed three major cell populations: mature vascular endothelial cells, endothelial cells with mesenchymal signatures and endothelial cells with inflammatory signatures95.
Organ atlases
In addition to characterization of specific tissues or organ systems, single-cell transcriptome profiling has also been performed on a larger scale to establish a comprehensive cell atlas of various major organs6,7. Using combinatorial indexing [G], a mouse organogenesis cell atlas was generated from 2 million cells in 61 mouse embryos at day 9.5–13.5 of gestation, allowing the visualization of developmental trajectories of all cell types96. A compendium of single-cell transcriptomic data named ‘Tabula Muris‘ that involved 100,000 cells from 20 different adult mouse organs and tissues was also generated using both FACS-based and droplet-based scRNA-seq methods6. The dataset has been particularly useful for determining gene-expression differences in cell types that are present in many tissues, such as endothelial cells, cardiac fibroblasts and tissue-resident immune cells (such as macrophages). The identification of gene-expression fingerprints and unique surface marker proteins can improve the isolation and characterization of these cells, opening doors for novel targeted therapy. The Tabula Muris compendium is publicly available, allowing researchers in all fields not only to use it as a biological reference, but also to contribute further to its analysis in greater detail. A similar atlas of single-cell chromatin accessibility has been constructed on the basis of combinatorial indexing (sci-ATAC-seq) to assess 13 different adult mouse tissues8. Pairing of sci-ATAC-seq data with the aforementioned scRNA-seq atlases has revealed remarkably concordant cell-type assignments for most overlapping organs, although some discrepancies were found in the lung and brain. These integrative approaches hold great promise for unravelling complex mechanisms of epigenetic and transcriptional regulation across different tissues and cell types. Multi-institutional consortia have been formed and are currently working to generate human cell atlases, including the Human Cell Atlas consortium97 by the Chan Zuckerberg Initiative and The Human BioMolecular Atlas Program (HuBMAP)98 by the NIH, which will enable characterization of changes in all cell types within the human adult heart during natural ageing and in response to disease (Fig. 4). Finally, publicly accessible databases of scRNA-seq studies, such as PanglaoDB, scRNASeqDB and Single Cell Portal, are available online, where scRNA-seq datasets can be sorted and identified according to the originating tissue or cell type, including those of human and mouse hearts, blood vessels and iPSC derivatives99.
Fig. 4 |. Single-cell characterization of the human adult heart.
a | Single-cell sequencing enables characterization of tissue maturation changes in the human adult heart during the course of natural ageing, as well as in response to cardiac disease, such as structural and ischaemic cardiomyopathies. b | All cell types in the human heart can be analysed by single-cell sequencing, including but not limited to chamber-specific cardiomyocytes, vascular and immune cells within the coronary vessels and microvessels, nodal cells that constitute the cardiac conduction system, stromal cells such as fibroblasts and valvular epithelial cells, and rare cell populations resident in the adult heart such as melanocytes, neurons, and cardiac stem or progenitor cells.
Pluripotent stem cell models
Human iPSC models have proven to be useful in patient-specific disease modelling and regenerative therapies but major challenges, such as immaturity and unresolved heterogeneity of iPSC-derived cardiovascular cells, remain100,101. Therefore, a number of studies have used scRNA-seq to determine the signalling pathways involved in transcriptional regulation of differentiation, to identify all cell types arising from differentiation, and to optimize and modify protocols for generating specialized subtypes of cardiac and vascular cells (Table 3).
Table 3 |.
scRNA-seq studies of pluripotent stem cell models
| Cell type | Differentiation cell type | Species | Pluripotent stem cell type | scRNA-seq method | Refs |
|---|---|---|---|---|---|
| Pluripotent stem cells | Reprogramming of CD19+ pre-B cells to iPSCs | Mouse | iPSC reprogramming | MARS-seq | 146 |
| Undifferentiated iPSCs | Human | iPSC | 10× Genomics 3ʹ | 147 | |
| Differentiated cells | Cardiomyocytes | Human | iPSC | 10× Genomics 3ʹ | 104 |
| Cardiomyocytes | Human | iPSC | 10× Genomics 3ʹ | 103 | |
| Endothelial cells | Human | ESC (KhES1) | Smart-seq | 148 | |
| Endothelial cells | Human | iPSC | 10× Genomics 3ʹ | 63 | |
| Endothelial cells | Human | ESC (H9 and RC11) | 10× Genomics 3ʹ | 106 |
ESC, embryonic stem cell; iPSC, induced pluripotent stem cell; MARS-seq, massively parallel single-cell RNA-sequencing; scRNA-seq, single-cell RNA sequencing; Smart-seq, switching mechanism at the 5′ end of the RNA template sequencing.
Human iPSC-derived cardiomyocytes (iPSC-CMs) generated using currently available methods embody fetal-like characteristics with regard to morphology, size, electrophysiological properties, calcium handling, contractility and metabolic function102. Friedman and colleagues performed scRNA-seq of >40,000 cells at various stages of iPSC-CM differentiation and reported that dysregulation of non-DNA-binding homeodomain protein HOPX leads to a persistent immature state of iPSC-CMs103. In a separate study, cardiac transcriptional regulators were identified during iPSC-CM differentiation from droplet-based scRNA-seq of >10,000 cells; iPSC-CMs expressing COUP-TF2 and T-box transcription factor TBX5 had a more immature and atrial-like profile, whereas the expression of hairy/enhancer-of-split related with YRPW motif protein 2 (HEY2), iroquois-class homeodomain protein IRX4 and myosin regulatory light chain 2, ventricular/cardiac muscle isoform (MYL2) was enriched in ventricular-like iPSC-CMs104. Genome-editing of COUP-TF2 and HEY2 in isogenic iPSC lines confirmed the distinct regulatory roles of the transcription factors NR2F2 and HEY2 in generating atrial-like and ventricular-like electrophysiological and gene-expression profiles of iPSC-CMs, respectively. Together, findings from these studies have highlighted the heterogeneous nature of iPSC-CMs and revealed specific cardiac transcription factors that govern cellular maturation and specification of chamber-specific human iPSC-CMs79,80.
Human iPSC-derived endothelial cells (iPSC-ECs) have also been used to model vascular diseases and are effective in recapitulating the effects of genetic and environmental factors on vascular dysfunction in vitro105. However, as with iPSC-CMs, iPSC-ECs that are currently available are limited by cellular immaturity and heterogeneity. Droplet-based scRNA-seq of iPSC-ECs during differentiation led to the identification of four major subpopulations of iPSC-ECs that were marked by enriched gene expression of APLNR, CLDN5, ESM1 and GJA5; the CLDN5+ cluster represented metabolically active iPSC-ECs, the GJA5+ cluster represented arterial-like iPSC-ECs, the APLNR+ cluster represented inflammation-responsive iPSC-ECs and the ESM1+ subpopulation represented activated cells63. In a separate study, McCracken and colleagues performed longitudinal droplet-based scRNA-seq analysis of two independent human embryonic stem cell-derived endothelial cell (ESC-EC) differentiation protocols106. Pseudotime trajectory analysis of the ESC-EC product protocol showed bifurcation to endothelial and mesenchymal cell types beginning at day 6 of differentiation, with both cell types undergoing maturation at day 8 of differentiation, which was marked by decreased expression of SNAI2 in the mesenchymal cell population and increased expression of ANGPT2, ESM1 and GNG11 in the endothelial cell population107. Despite further maturation of the ESC-ECs after initial endothelial commitment, no further markers of a commitment to an organ-specific endothelial phenotype were observed. Future studies should focus on identifying organ-specific transcriptomic signatures and further optimizing differentiation protocols to generate anatomically defined pluripotent stem cell-derived endothelial cells.
Single-cell multiomics approaches
Combinatorial indexing
At present, a major limitation of scRNA-seq technology has been the high cost of preparing RNA-seq libraries from isolated single cells. The cost increases linearly with the number of cells processed, which has created a substantial hurdle for individual laboratories and multi-institutional consortia. To address this challenge, novel multiplexing methods have been developed to increase throughput while also reducing the cost per cell. One such approach is combinatorial indexing, which involves the use of two independent yet conceptually identical methods of single-cell combinatorial indexing RNA sequencing108 and split pool ligation-based transcriptome sequencing109, in which single cells or nuclei are separated, barcoded, pooled and then subsequently split again for additional barcoding. Multiple rounds of cell splitting and barcode indexing, as opposed to single barcodes used in droplet-based or microwell-based platforms, enable unique labelling of transcriptomes with large numbers of single cells or nuclei. These combinatorial indexing strategies can increase the number of cells analysed by 10-fold to 1,000-fold, without the need for physical isolation of individual cells. The latest iteration of this technology has enabled profiling of as many as ~2 million cells from >60 embryos in a single run96. However, despite the impressive increase in throughput, combinatorial indexing often yields shallow sequencing depths and might not identify extremely rare cell populations, which is often the main objective of performing scRNA-seq analyses. Therefore, this trade-off between breadth and depth should be carefully considered when optimizing the experimental design and set-up.
Combinatorial single-cell technologies
In addition to scRNA-seq techniques, a myriad of other single-cell omics techniques are also under development or in use55,110. These technologies include single-cell chromatin accessibility (such as scATAC-seq), DNA methylomics and proteomics, which all carry unique information that cannot be captured fully by scRNA-seq alone, even at its maximal depth and throughput (Fig. 5). For example, global or local changes in chromatin organization and accessibility can precede major transcriptional events before they are detectable at the level of mRNA expression and might represent a more stable fingerprint of cell phenotype or state. scATAC-seq has been developed to allow probing of chromatin accessibility profiles of tens of thousands of cells simultaneously8,111–113 and to identify regulatory elements that govern transcription. The technique has already begun to uncover novel regulatory landscapes in Drosophila embryogenesis114, human haematopoiesis115,116 and T-cell receptor specificity116. One point of consideration with scATAC-seq is that it typically requires additional steps to physically isolate single nuclei, a process that demands extra care given the fragility and semi-permeability of the nuclear membrane during multiple rounds of centrifugation and resuspension117,118. As with scRNA-seq, tailoring the isolation protocol to the sample of interest is critical to ensure the preservation of nuclear integrity and sensitivity. With continued optimization of these workflows, scATAC-seq is expected to alter the way in which we interrogate epigenomic regulatory mechanisms, particularly when analysing parallel scRNA-seq gene-expression profiles. An earlier study has shown that the two omics platforms can be integrated either algorithmically or concurrently by a novel indexing-based co-assay119.
Fig. 5 |. Single-cell multiomics approaches for cardiovascular precision medicine.
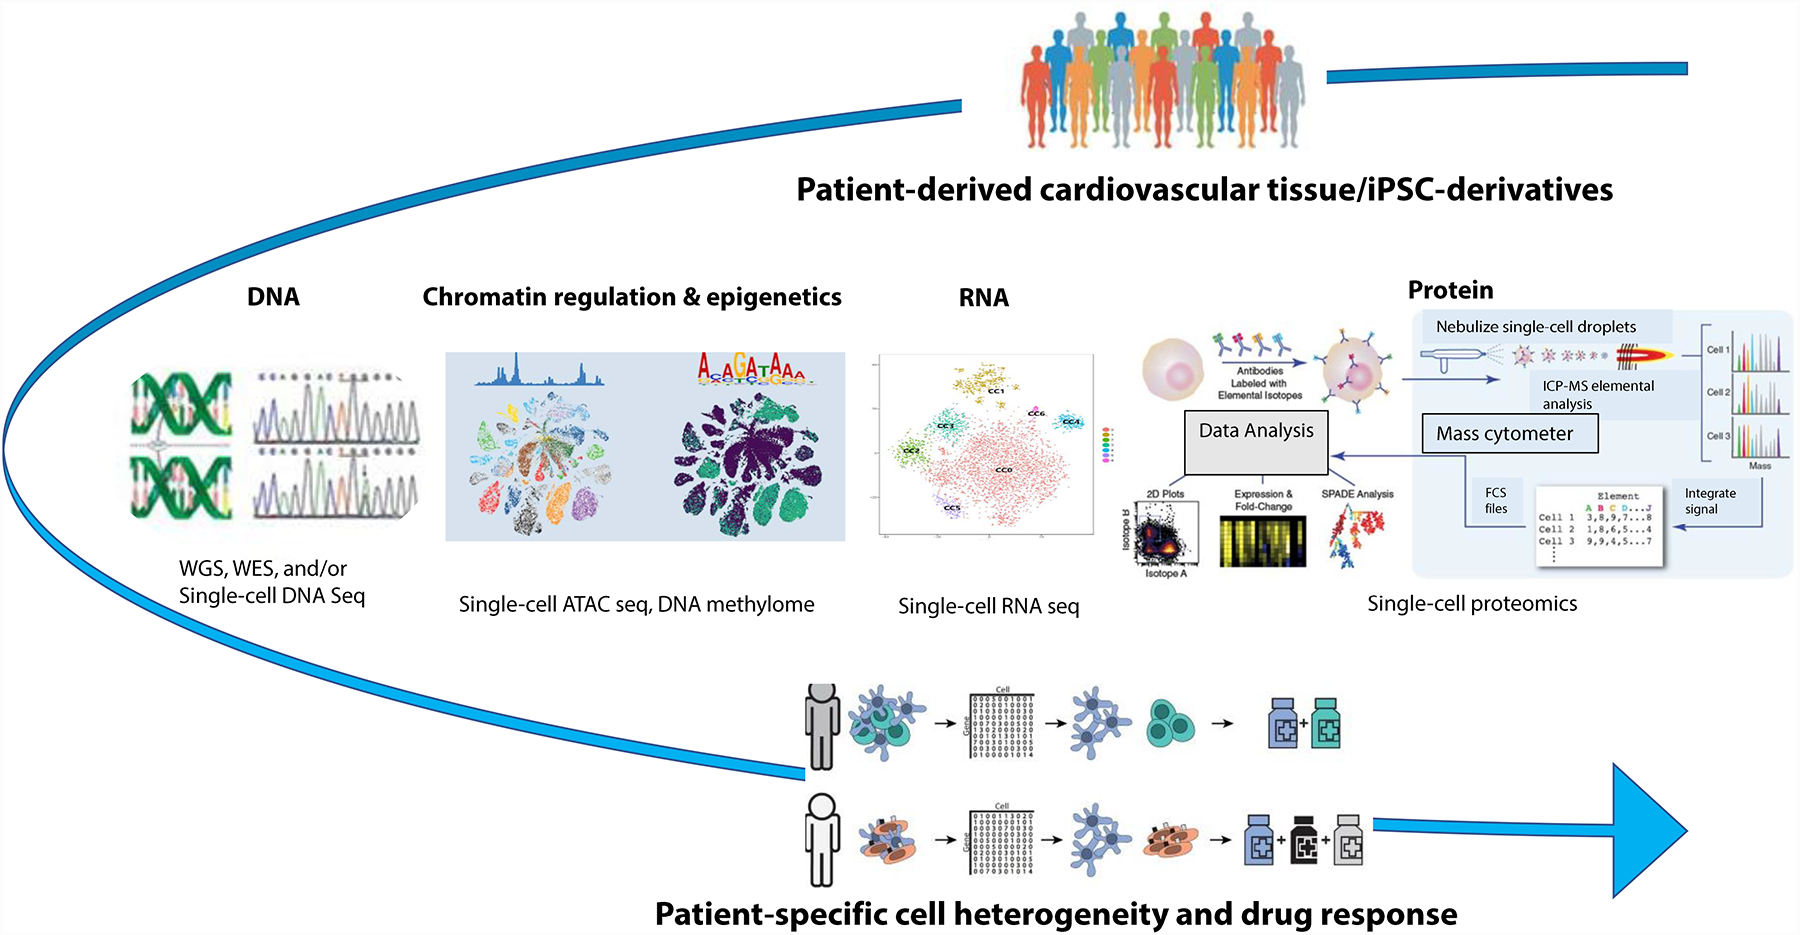
To date, single-cell RNA sequencing (scRNA-seq) has been used most effectively to identify novel or rare cell populations, to confirm the cellular heterogeneity of the tissue or organ of interest, and to construct cell trajectory of developmental or differentiation processes. The increasing and expected technical advances in single-cell analyses of other macromolecules present a unique opportunity to combine multiple single-cell omics approaches149 to advance cardiovascular precision medicine. In addition to single-cell genomics and transcriptomics, single-cell chromatin accessibility, DNA methylome and proteomics will improve our ability to understand cellular heterogeneity unique to each individual, allowing us to better predict the individual-specific responses to cardiovascular drugs and therapies. CITE-seq, cellular indexing of transcriptomes and epitopes by sequencing; iPSC, induced pluripotent stem cell; LC-MS, liquid chromatography–mass spectrometry; MS, mass spectrometry; scATAC-seq, single-cell assay for transposase-accessible chromatin using sequencing; WES, whole-exome sequencing; WGS, whole-genome sequencing.
As with chromatin accessibility, DNA-methylation landscapes can also provide unique insights into the differentiation potential and transcriptional activity of various cells in ways that might not be reflected by or inferred from RNA expression. A wide variety of strategies have been developed for the analysis of single-cell DNA methylomes120, some of which have already been paired with scRNA-seq or chromatin accessibility data121–124 in an effort to uncover the coordinated mechanisms of epigenetic and transcriptional regulation. However, despite progress in the integration of multiomics data, our understanding of how these regulatory processes layer upon themselves to manifest as downstream cell phenotypes and behavioural states remains limited. One technical bottleneck seems to be the lack of a comparable single-cell method that can interrogate cell proteomes at similar sensitivity and throughput. Integrative methods allowing the simultaneous interrogation of single-cell transcriptomes along with tens of proteins have been developed using oligonucleotide-conjugated antibodies, known as cellular indexing of transcriptomes and epitopes by sequencing (CITE-seq)125 or TotalSeq, but these approaches are currently limited to a few surface proteins and rely on the availability of custom-designed antibodies. Ongoing efforts are being made in this emerging field of single-cell proteomics126 to develop alternative protein-detection methods that improve sensitivity and scope (such as variations of Edman degradation127), refine sample preparation pipelines and improve mass CyTOF-based platforms. Optimization and standardization of the workflow might be critical to achieving a truly holistic multiomics analysis at single-cell resolution, one that can connect upstream gene regulatory mechanisms to observed downstream phenotypes at the protein level.
Finally, spatial transcriptomics is rapidly emerging as a powerful technology that offers an entirely new dimension to the aforementioned omics techniques at a near single-cell resolution (Fig. 2). For example, barcoded oligo-dT microarray slides have been successfully used to map RNA to specific XY-positions on tissue sections at ~100 μm resolution128. A novel method called Slide-seq was developed and involves the transfer of RNA from tissue samples onto a surface covered with DNA-barcoded beads with known positions to allow the spatial locations of RNA to be determined by sequencing129. This method substantially improves the spatial resolution of transcriptome mapping to ~10 μm, roughly matching the average length of a cell in vivo, and holds great promise for high-dimensional structural analysis of tissues and complex organoid models. Lundeberg and colleagues generated a spatiotemporal atlas of the developing human heart in the first trimester by integrating spatial transcriptomics, scRNA-seq and in situ sequencing to create a 3D spatial cellular map18. Analogous methods for other omics techniques (such as spatial mapping of chromatin accessibility) are also expected to emerge in the near future, opening doors for high-dimensional multiomics analyses with localization coordinates that are traceable to single cells.
Cardiovascular precision medicine
One of the major challenges in health care is that patients do not respond uniformly to treatment. At present, approximately 90% of drugs on the market are ineffective for >50% of treated patients130. The mechanisms underlying these patient-specific drug responses remain elusive, with a broad range of genetic and environmental factors seeming to contribute. Among these factors, patient-specific cell-to-cell heterogeneity is increasingly understood to be a fundamental contributor and driver of differential drug responses among individuals, highlighting the growing importance of single-cell techniques in advancing precision medicine.
Early clinical applications of scRNA-seq have focused mainly on cancer131. Primary kidney tumours, as well as their lung metastases, show considerable cellular heterogeneity, and combination therapy targeting two independent pathways has been shown to be more effective than monotherapy132. In parallel, other studies have demonstrated that multiple non-malignant tumour-associated cells, including stromal and immune cells, have critical roles in tumour progression and maintenance133,134. Not surprisingly, the composition of cells in a given tumour tissue varies greatly from patient to patient, with important implications for diagnosis and therapeutic response. Likewise, treatment of cardiovascular disease is also suboptimal given the substantial patient-specific differences in drug response135. For instance, bulk transcriptomic profiling of iPSC-CMs derived from different individuals revealed interpersonal differences in cellular and molecular responses to common cardiovascular drugs136,137. However, these bulk analyses cannot detect the individual-specific differences in cellular heterogeneity that are likely to contribute to differential drug responses. Single-cell multiomics analysis will be critical in uncovering such information.
As demonstrated by cell atlases generated by scRNA-seq, the heart and surrounding vasculature are composed of a multitude of cell types, including cardiomyocytes, fibroblasts, endothelial cells, VSMCs, valvular interstitial cells and resident immune cells, each of which can be further categorized into subtypes. The functional contributions of the different cell types — in particular the non-myocytes — to cardiac development, homeostasis and disease are becoming increasingly appreciated, which has motivated a rapid surge in the number of single-cell studies in recent years focusing on new cell populations and subtypes in various cardiovascular disease contexts. However, as with cancer, the composition and behaviour of cardiovascular cell populations vary considerably between individuals, which is likely to contribute to the non-uniform responses to treatment.
One way to address these challenges in the future would be to create patient-specific cell atlases before clinical intervention. Conceivably, scRNA-seq-based assessment of cell numbers, gene-expression profiles and cell heterogeneity would complement existing diagnostic tests and inform physicians in determining the most effective, personalized therapeutic option. Profiling of patient plasma biomarkers that were previously discovered using scRNA-seq, or in some rare cases direct profiling of patient heart samples obtained through biopsies or septal myomectomy, could in principle be used to monitor disease states and select the optimal time point for treatment. In certain scenarios, an abnormally high number of immune cells or elevated cytokine expression might encourage co-treatment with immunomodulatory drugs to limit prolonged inflammation after intervention. Given its high sensitivity, scRNA-seq might also prove useful in the clinic for detecting rare cells associated with disease, which could enable more efficient targeting and delivery of drugs.
Despite these potential benefits, numerous technical, logistical and financial hurdles must be overcome before scRNA-seq can be routinely implemented in the clinic138. Given its inherent complexity, scRNA-seq might not be feasible as a stand-alone technology for therapeutic decision-making, and its future integration into clinical settings is likely to require further development of combinatorial assays and parallel diagnostic tests. In addition, the implementation will require not only a standardized protocol for sample preparation and data analysis, but also a physician-friendly interface and software. Other substantial financial and logistical considerations might hinder the immediate integration of the technology into current health-care systems. However, these challenges are likely to be addressed given the momentum that scRNA-seq technologies have gained in just its first few iterations. With continued improvement of scRNA-seq pipelines, decreasing costs of sequencing and the advancement of data-driven precision medicine, translational single-cell applications will continue to grow and will more than likely redefine how patients are treated in the future.
Conclusions
Transcriptomics in the past few years has made a giant leap from bulk-averaged population studies to analyses of individual cells. Despite its short history, scRNA-seq has already begun to fuel new discoveries across disciplines that would not have been possible with traditional bulk analysis methods. In the cardiovascular field alone, scRNA-seq has been used by numerous groups and has been instrumental in identifying novel cell populations, elucidating lineage trajectories and characterizing intercellular communication in various developmental and disease contexts. In addition to its use in unravelling cell-type-specific changes in development and disease, scRNA-seq technology has also been used to generate single-cell atlases of various tissues, such as those of the cardiovascular system (Table 2), and these atlases can now be openly accessed both as a reference database and as a source of further analysis by researchers from all fields.
Although some technical limitations remain, the application of scRNA-seq in both basic and translational research is expected to grow exponentially with continued improvement and standardization of experimental and analytical pipelines. In particular, the combination of scRNA-seq with other omics techniques (such as single-cell genomics and scATAC-seq) is currently under investigation and holds promise for the elucidation of gene regulatory mechanisms at single-cell resolution. Integration of multiomics approaches into current workflows presents many challenges, but is also expected to synergize with existing methods in the laboratory and in the clinic. Therefore, scRNA-seq technology has the potential not only to transform basic science but also to advance precision medicine.
Key points.
The advent of single-cell RNA sequencing (scRNA-seq) technologies has facilitated the profiling and analysis of the transcriptomes of single cells at unprecedented resolution and throughput.
scRNA-seq allows the identification of rare subpopulations of cells, as well as cellular trajectory analysis of each cell’s transcriptome, which has helped to identify cell-state transitions during development and progenitor or stem cells differentiation.
In addition to characterization of specific tissues or organ systems, scRNA-seq has also been performed on a larger scale to establish comprehensive cell atlases of various major organs, including the heart.
Multimodal single-cell platforms can be integrated and used to evaluate cell population heterogeneity and its contributions to patient-specific drug responses and adverse effects.
Acknowledgements
The authors are supported by grants from the NIH: K99 HL150216 (D.T.P.), RM1 HG007735 (H.Y.C.), R01 HL141851 (J.C.W.), R01 HL146690 (J.C.W.) and R01 HL141371 (J.C.W.). The authors thank B.C. Wu (Stanford University, USA), J.X. Zhang (Stanford University, USA) and H. Lee (Stanford University, USA) for critical reading of the manuscript.
Glossary terms
- Quantitative PCR
A polymerase chain reaction that records product expression in real time.
- Microarray
A chip containing thousands of wells with a bound DNA of known sequence, which can be used to bind and measure the expression of transcriptome mRNA.
- Bulk RNA sequencing
Bulk resolution, next-generation sequencing which reveals RNA presence and quantity in a sample of cells during time of measurement.
- Transcriptome
All RNA molecules expressed in a cell or cell population.
- Cellular trajectory analysis
Computational analysis technique used to track and group cells on the basis of their course through a dynamic process, such as cell differentiation or cell cycle.
- Fluorescence-activated cell sorting
(FACS). Technique in which target cell types in suspension are separated and sorted by flow cytometry on the basis of fluorescence information.
- R packages
Single-cell gene-expression analysis software package written in R that can be run in integrated development environments, such as RStudio.
- Python packages
Single-cell gene-expression analysis software package written in Python that can be run in integrated development environments, such as Sublime Text or Visual Studio.
- Principal component analysis
(PCA). A linear statistical technique that reduces the number of experimental variables to the minimum amount.
- T-distributed stochastic neighbour embedding
(tSNA). Non-linear variable reduction method that displays high-dimension data points, such as cell transcriptome data, on 2D or 3D graphs, primarily separating points on the basis of (dis)similarity to each other.
- Uniform manifold approximation and projection
(UMAP). Non-linear variable reduction method that displays high-dimension data points on 2D or 3D distance-dependent graphs, which can be used to reveal information such as cell differentiation trajectory and cell state.
- Euclidean distance tools
Software package that calculates feature differences between a specific cell to a preselected cell cluster.
- Induced pluripotent stem cells
(iPSCs). Induced pluripotent stem cells reprogrammed from adult somatic cells.
- Immunohistochemistry
Antibody-based detection method of protein in samples of tissue.
- In situ hybridization
Labelling technique that uses hybridization of labelled cDNA to locate specific nucleic acid sequences in tissue sections.
- Enzyme-linked immunosorbent assay
(ELISA). Plate-based antibody detection assay for biomolecules in which enzyme–antibody conjugates attach to specific antigens anchored to a surface, and then subsequent incubation in a substrate reveals the antigen presence.
- Mass cytometry
(CyTOF). Variant of flow cytometry using metal-ion-labelled antibodies and read-out using time-of-flight mass spectrometry.
- Combinatorial indexing
Single-cell RNA sequencing method using transposase nuclei barcoding, fluorescence-activated nuclei sorting and PCR to index subpopulations of cells from tissues or organs.
Footnotes
Competing interests
H.Y.C. is a co-founder of Accent Therapeutics and Boundless Bio, and an advisor to 10× Genomics, Arsenal Biosciences and Spring Discovery. J.C.W. is a co-founder of Khloris Biosciences, but has no competing interests, as the work presented here is completely independent. The other authors declare no competing interests.
Related links
Tabula Muris: https://tabula-muris.ds.czbiohub.org/
Human Cell Atlas: https://www.humancellatlas.org/
The Human BioMolecular Atlas Program: https://commonfund.nih.gov/hubmap
PanglaoDB: https://panglaodb.se/
scRNASeqDB: https://bioinfo.uth.edu/scrnaseqdb/
Single Cell Portal: https://singlecell.broadinstitute.org/single_cell
References
- 1.Heid CA, Stevens J, Livak KJ & Williams PM Real time quantitative PCR. Genome Res. 6, 986–994 (1996). [DOI] [PubMed] [Google Scholar]
- 2.Trapnell C Defining cell types and states with single-cell genomics. Genome Res. 25, 1491–1498 (2015). [DOI] [PMC free article] [PubMed] [Google Scholar]
- 3.Islam S et al. Quantitative single-cell RNA-seq with unique molecular identifiers. Nat. Methods 11, 163–166 (2014). [DOI] [PubMed] [Google Scholar]
- 4.Shapiro E, Biezuner T & Linnarsson S Single-cell sequencing-based technologies will revolutionize whole-organism science. Nat. Rev. Genet 14, 618–630 (2013). [DOI] [PubMed] [Google Scholar]
- 5.Potter SS Single-cell RNA sequencing for the study of development, physiology and disease. Nat Rev Nephrol 14, 479–492 (2018). [DOI] [PMC free article] [PubMed] [Google Scholar]
- 6.Tabula Muris Consortium et al. Single-cell transcriptomics of 20 mouse organs creates a Tabula Muris. Nature 562, 367–372 (2018). [DOI] [PMC free article] [PubMed] [Google Scholar]
- 7.Han X et al. Mapping the Mouse Cell Atlas by Microwell-Seq. Cell 172, 1091–1107.e17 (2018). [DOI] [PubMed] [Google Scholar]
- 8.Cusanovich DA et al. A Single-Cell Atlas of In Vivo Mammalian Chromatin Accessibility. Cell 174, 1309–1324.e18 (2018). [DOI] [PMC free article] [PubMed] [Google Scholar]
- 9.Gao S et al. Tracing the temporal-spatial transcriptome landscapes of the human fetal digestive tract using single-cell RNA-sequencing. Nat. Cell Biol 20, 721–734 (2018). [DOI] [PubMed] [Google Scholar]
- 10.Wang P et al. Dissecting the Global Dynamic Molecular Profiles of Human Fetal Kidney Development by Single-Cell RNA Sequencing. Cell Rep 24, 3554–3567.e3 (2018). [DOI] [PubMed] [Google Scholar]
- 11.Zhong S et al. A single-cell RNA-seq survey of the developmental landscape of the human prefrontal cortex. Nature 555, 524–528 (2018). [DOI] [PubMed] [Google Scholar]
- 12.Cui Y et al. Single-Cell Transcriptome Analysis Maps the Developmental Track of the Human Heart. Cell Rep 26, 1934–1950.e5 (2019). [DOI] [PubMed] [Google Scholar]
- 13.Ramilowski JA et al. A draft network of ligand-receptor-mediated multicellular signalling in human. Nat Commun 6, 7866 (2015). [DOI] [PMC free article] [PubMed] [Google Scholar]
- 14.Ståhl PL et al. Visualization and analysis of gene expression in tissue sections by spatial transcriptomics. Science 353, 78–82 (2016). [DOI] [PubMed] [Google Scholar]
- 15.Jemt A et al. An automated approach to prepare tissue-derived spatially barcoded RNA-sequencing libraries. Sci Rep 6, 37137 (2016). [DOI] [PMC free article] [PubMed] [Google Scholar]
- 16.Asp M et al. Spatial detection of fetal marker genes expressed at low level in adult human heart tissue. Sci Rep 7, 12941 (2017). [DOI] [PMC free article] [PubMed] [Google Scholar]
- 17.Berglund E et al. Spatial maps of prostate cancer transcriptomes reveal an unexplored landscape of heterogeneity. Nat Commun 9, 2419 (2018). [DOI] [PMC free article] [PubMed] [Google Scholar]
- 18.Asp M et al. A Spatiotemporal Organ-Wide Gene Expression and Cell Atlas of the Developing Human Heart. Cell 179, 1647–1660.e19 (2019). [DOI] [PubMed] [Google Scholar]
- 19.Svensson V, Vento-Tormo R & Teichmann SA Exponential scaling of single-cell RNA-seq in the past decade. Nat Protoc 13, 599–604 (2018). [DOI] [PubMed] [Google Scholar]
- 20.Macosko EZ et al. Highly parallel genome-wide expression profiling of individual cells using nanoliter droplets. Cell 161, 1202–1214 (2015). [DOI] [PMC free article] [PubMed] [Google Scholar]
- 21.Gladka MM et al. Single-Cell Sequencing of the Healthy and Diseased Heart Reveals Cytoskeleton-Associated Protein 4 as a New Modulator of Fibroblasts Activation. Circulation 138, 166–180 (2018). [DOI] [PubMed] [Google Scholar]
- 22.Ramsköld D et al. Full-length mRNA-Seq from single-cell levels of RNA and individual circulating tumor cells. Nat. Biotechnol 30, 777–782 (2012). [DOI] [PMC free article] [PubMed] [Google Scholar]
- 23.Picelli S et al. Full-length RNA-seq from single cells using Smart-seq2. Nat Protoc 9, 171–181 (2014). [DOI] [PubMed] [Google Scholar]
- 24.Picelli S Full-Length Single-Cell RNA Sequencing with Smart-seq2. Methods Mol. Biol 1979, 25–44 (2019). [DOI] [PubMed] [Google Scholar]
- 25.Hwang B, Lee JH & Bang D Single-cell RNA sequencing technologies and bioinformatics pipelines. Exp. Mol. Med 50, 96 (2018). [DOI] [PMC free article] [PubMed] [Google Scholar]
- 26.Hashimshony T, Wagner F, Sher N & Yanai I CEL-Seq: single-cell RNA-Seq by multiplexed linear amplification. Cell Rep 2, 666–673 (2012). [DOI] [PubMed] [Google Scholar]
- 27.Hashimshony T et al. CEL-Seq2: sensitive highly-multiplexed single-cell RNA-Seq. Genome Biol. 17, 77 (2016). [DOI] [PMC free article] [PubMed] [Google Scholar]
- 28.Zheng GXY et al. Massively parallel digital transcriptional profiling of single cells. Nat Commun 8, 14049 (2017). [DOI] [PMC free article] [PubMed] [Google Scholar]
- 29.Papalexi E & Satija R Single-cell RNA sequencing to explore immune cell heterogeneity. Nat. Rev. Immunol 18, 35–45 (2018). [DOI] [PubMed] [Google Scholar]
- 30.Zappia L, Phipson B & Oshlack A Exploring the single-cell RNA-seq analysis landscape with the scRNA-tools database. PLoS Comput. Biol 14, e1006245 (2018). [DOI] [PMC free article] [PubMed] [Google Scholar]
- 31.Nguyen QH, Pervolarakis N, Nee K & Kessenbrock K Experimental Considerations for Single-Cell RNA Sequencing Approaches. Front Cell Dev Biol 6, 108 (2018). [DOI] [PMC free article] [PubMed] [Google Scholar]
- 32.Vieira Braga FA & Miragaia RJ Tissue Handling and Dissociation for Single-Cell RNA-Seq in Single Cell Methods: Sequencing and Proteomics (ed. Proserpio V) 9–21 (Springer, 2019). doi: 10.1007/978-1-4939-9240-9_2. [DOI] [PubMed] [Google Scholar]
- 33.See K et al. Single cardiomyocyte nuclear transcriptomes reveal a lincRNA-regulated de-differentiation and cell cycle stress-response in vivo. Nat Commun 8, 225 (2017). [DOI] [PMC free article] [PubMed] [Google Scholar]
- 34.Hu P et al. Single-nucleus transcriptomic survey of cell diversity and functional maturation in postnatal mammalian hearts. Genes Dev. 32, 1344–1357 (2018). [DOI] [PMC free article] [PubMed] [Google Scholar]
- 35.Linscheid N et al. Quantitative proteomics and single-nucleus transcriptomics of the sinus node elucidates the foundation of cardiac pacemaking. Nat Commun 10, 2889 (2019). [DOI] [PMC free article] [PubMed] [Google Scholar]
- 36.Kannan S et al. Large Particle Fluorescence-Activated Cell Sorting Enables High-Quality Single-Cell RNA Sequencing and Functional Analysis of Adult Cardiomyocytes. Circ. Res 125, 567–569 (2019). [DOI] [PMC free article] [PubMed] [Google Scholar]
- 37.DeLuca DS et al. RNA-SeQC: RNA-seq metrics for quality control and process optimization. Bioinformatics 28, 1530–1532 (2012). [DOI] [PMC free article] [PubMed] [Google Scholar]
- 38.Bacher R & Kendziorski C Design and computational analysis of single-cell RNA-sequencing experiments. Genome Biol. 17, 63 (2016). [DOI] [PMC free article] [PubMed] [Google Scholar]
- 39.Trapnell C et al. The dynamics and regulators of cell fate decisions are revealed by pseudotemporal ordering of single cells. Nat. Biotechnol 32, 381–386 (2014). [DOI] [PMC free article] [PubMed] [Google Scholar]
- 40.Wolf FA, Angerer P & Theis FJ SCANPY: large-scale single-cell gene expression data analysis. Genome Biol. 19, 15 (2018). [DOI] [PMC free article] [PubMed] [Google Scholar]
- 41.McCarthy DJ, Campbell KR, Lun ATL & Wills QF Scater: pre-processing, quality control, normalization and visualization of single-cell RNA-seq data in R. Bioinformatics 33, 1179–1186 (2017). [DOI] [PMC free article] [PubMed] [Google Scholar]
- 42.Diaz A et al. SCell: integrated analysis of single-cell RNA-seq data. Bioinformatics 32, 2219–2220 (2016). [DOI] [PMC free article] [PubMed] [Google Scholar]
- 43.Butler A, Hoffman P, Smibert P, Papalexi E & Satija R Integrating single-cell transcriptomic data across different conditions, technologies, and species. Nat. Biotechnol 36, 411–420 (2018). [DOI] [PMC free article] [PubMed] [Google Scholar]
- 44.Guo M, Wang H, Potter SS, Whitsett JA & Xu Y SINCERA: A Pipeline for Single-Cell RNA-Seq Profiling Analysis. PLoS Comput. Biol 11, e1004575 (2015). [DOI] [PMC free article] [PubMed] [Google Scholar]
- 45.Stegle O, Teichmann SA & Marioni JC Computational and analytical challenges in single-cell transcriptomics. Nat. Rev. Genet 16, 133–145 (2015). [DOI] [PubMed] [Google Scholar]
- 46.Kiselev VY, Andrews TS & Hemberg M Challenges in unsupervised clustering of single-cell RNA-seq data. Nat. Rev. Genet 20, 273–282 (2019). [DOI] [PubMed] [Google Scholar]
- 47.van der Maaten LJP & Hinton GE Visualizing High-Dimensional Data Using t-SNE. Journal of Machine Learning Research 9, 2579–2605 (2008). [Google Scholar]
- 48.Becht E et al. Dimensionality reduction for visualizing single-cell data using UMAP. Nat. Biotechnol (2018) doi: 10.1038/nbt.4314. [DOI] [PubMed] [Google Scholar]
- 49.Crow M, Paul A, Ballouz S, Huang ZJ & Gillis J Characterizing the replicability of cell types defined by single cell RNA-sequencing data using MetaNeighbor. Nat Commun 9, 884 (2018). [DOI] [PMC free article] [PubMed] [Google Scholar]
- 50.Andrews TS & Hemberg M Identifying cell populations with scRNASeq. Mol. Aspects Med 59, 114–122 (2018). [DOI] [PubMed] [Google Scholar]
- 51.Lin P, Troup M & Ho JWK CIDR: Ultrafast and accurate clustering through imputation for single-cell RNA-seq data. Genome Biol. 18, 59 (2017). [DOI] [PMC free article] [PubMed] [Google Scholar]
- 52.Žurauskienė J & Yau C pcaReduce: hierarchical clustering of single cell transcriptional profiles. BMC Bioinformatics 17, 140 (2016). [DOI] [PMC free article] [PubMed] [Google Scholar]
- 53.Levine JH et al. Data-Driven Phenotypic Dissection of AML Reveals Progenitor-like Cells that Correlate with Prognosis. Cell 162, 184–197 (2015). [DOI] [PMC free article] [PubMed] [Google Scholar]
- 54.Raykov YP, Boukouvalas A, Baig F & Little MA What to Do When K-Means Clustering Fails: A Simple yet Principled Alternative Algorithm. PLOS ONE 11, e0162259 (2016). [DOI] [PMC free article] [PubMed] [Google Scholar]
- 55.Tanay A & Regev A Scaling single-cell genomics from phenomenology to mechanism. Nature 541, 331–338 (2017). [DOI] [PMC free article] [PubMed] [Google Scholar]
- 56.Kester L & van Oudenaarden A Single-Cell Transcriptomics Meets Lineage Tracing. Cell Stem Cell 23, 166–179 (2018). [DOI] [PubMed] [Google Scholar]
- 57.Su T et al. Single-cell analysis of early progenitor cells that build coronary arteries. Nature 559, 356–362 (2018). [DOI] [PMC free article] [PubMed] [Google Scholar]
- 58.Wang W et al. A single-cell transcriptional roadmap for cardiopharyngeal fate diversification. Nat. Cell Biol 21, 674–686 (2019). [DOI] [PMC free article] [PubMed] [Google Scholar]
- 59.Ludwig LS et al. Lineage Tracing in Humans Enabled by Mitochondrial Mutations and Single-Cell Genomics. Cell 176, 1325–1339.e22 (2019). [DOI] [PMC free article] [PubMed] [Google Scholar]
- 60.Xu J et al. Single-cell lineage tracing by endogenous mutations enriched in transposase accessible mitochondrial DNA. Elife 8, (2019). [DOI] [PMC free article] [PubMed] [Google Scholar]
- 61.Skelly DA et al. Single-Cell Transcriptional Profiling Reveals Cellular Diversity and Intercommunication in the Mouse Heart. Cell Rep 22, 600–610 (2018). [DOI] [PubMed] [Google Scholar]
- 62.Li G et al. Single cell expression analysis reveals anatomical and cell cycle-dependent transcriptional shifts during heart development. Development (2019) doi: 10.1242/dev.173476. [DOI] [PMC free article] [PubMed] [Google Scholar]
- 63.Paik DT et al. Large-Scale Single-Cell RNA-Seq Reveals Molecular Signatures of Heterogeneous Populations of Human Induced Pluripotent Stem Cell-Derived Endothelial Cells. Circ. Res 123, 443–450 (2018). [DOI] [PMC free article] [PubMed] [Google Scholar]
- 64.Li G et al. Transcriptomic Profiling Maps Anatomically Patterned Subpopulations among Single Embryonic Cardiac Cells. Dev. Cell 39, 491–507 (2016). [DOI] [PMC free article] [PubMed] [Google Scholar]
- 65.DeLaughter DM et al. Single-Cell Resolution of Temporal Gene Expression during Heart Development. Dev. Cell 39, 480–490 (2016). [DOI] [PMC free article] [PubMed] [Google Scholar]
- 66.Lescroart F et al. Defining the earliest step of cardiovascular lineage segregation by single-cell RNA-seq. Science 359, 1177–1181 (2018). [DOI] [PMC free article] [PubMed] [Google Scholar]
- 67.Devine WP, Wythe JD, George M, Koshiba-Takeuchi K & Bruneau BG Early patterning and specification of cardiac progenitors in gastrulating mesoderm. Elife 3, (2014). [DOI] [PMC free article] [PubMed] [Google Scholar]
- 68.Jia G et al. Single cell RNA-seq and ATAC-seq analysis of cardiac progenitor cell transition states and lineage settlement. Nat Commun 9, 4877 (2018). [DOI] [PMC free article] [PubMed] [Google Scholar]
- 69.Xiong H et al. Single-Cell Transcriptomics Reveals Chemotaxis-Mediated Intraorgan Crosstalk During Cardiogenesis. Circ. Res 125, 398–410 (2019). [DOI] [PubMed] [Google Scholar]
- 70.de Soysa TY et al. Single-cell analysis of cardiogenesis reveals basis for organ-level developmental defects. Nature 572, 120–124 (2019). [DOI] [PMC free article] [PubMed] [Google Scholar]
- 71.Muraro MJ et al. A Single-Cell Transcriptome Atlas of the Human Pancreas. Cell Syst 3, 385–394.e3 (2016). [DOI] [PMC free article] [PubMed] [Google Scholar]
- 72.Ackers-Johnson M, Tan WLW & Foo RS-Y Following hearts, one cell at a time: recent applications of single-cell RNA sequencing to the understanding of heart disease. Nat Commun 9, 4434 (2018). [DOI] [PMC free article] [PubMed] [Google Scholar]
- 73.Coppini R et al. Isolation and functional characterization of human ventricular cardiomyocytes from fresh surgical samples. J Vis Exp (2014) doi: 10.3791/51116. [DOI] [PMC free article] [PubMed] [Google Scholar]
- 74.Nomura S et al. Cardiomyocyte gene programs encoding morphological and functional signatures in cardiac hypertrophy and failure. Nat Commun 9, 4435 (2018). [DOI] [PMC free article] [PubMed] [Google Scholar]
- 75.Honkoop H et al. Single-cell analysis uncovers that metabolic reprogramming by ErbB2 signaling is essential for cardiomyocyte proliferation in the regenerating heart. Elife 8, (2019). [DOI] [PMC free article] [PubMed] [Google Scholar]
- 76.Li Z et al. Single-cell transcriptome analyses reveal novel targets modulating cardiac neovascularization by resident endothelial cells following myocardial infarction. Eur. Heart J (2019) doi: 10.1093/eurheartj/ehz305. [DOI] [PMC free article] [PubMed] [Google Scholar]
- 77.Paik DT et al. Wnt10b gain-of-function improves cardiac repair by arteriole formation and attenuation of fibrosis. Circ. Res 117, 804–816 (2015). [DOI] [PMC free article] [PubMed] [Google Scholar]
- 78.Farbehi N et al. Single-cell expression profiling reveals dynamic flux of cardiac stromal, vascular and immune cells in health and injury. Elife 8, (2019). [DOI] [PMC free article] [PubMed] [Google Scholar]
- 79.Zeisberg EM et al. Endothelial-to-mesenchymal transition contributes to cardiac fibrosis. Nat. Med 13, 952–961 (2007). [DOI] [PubMed] [Google Scholar]
- 80.Aisagbonhi O et al. Experimental myocardial infarction triggers canonical Wnt signaling and endothelial-to-mesenchymal transition. Dis Model Mech 4, 469–483 (2011). [DOI] [PMC free article] [PubMed] [Google Scholar]
- 81.Ubil E et al. Mesenchymal-endothelial transition contributes to cardiac neovascularization. Nature 514, 585–590 (2014). [DOI] [PMC free article] [PubMed] [Google Scholar]
- 82.Tucker NR et al. Transcriptional and Cellular Diversity of the Human Heart. bioRxiv 2020.01.06.896076 (2020) doi: 10.1101/2020.01.06.896076. [DOI] [PMC free article] [PubMed] [Google Scholar]
- 83.Red-Horse K, Ueno H, Weissman IL & Krasnow M Coronary arteries form by developmental reprogramming of venous cells. Nature 464, 549–553 (2010). [DOI] [PMC free article] [PubMed] [Google Scholar]
- 84.Sharma B, Chang A & Red-Horse K Coronary Artery Development: Progenitor Cells and Differentiation Pathways. Annu. Rev. Physiol 79, 1–19 (2017). [DOI] [PMC free article] [PubMed] [Google Scholar]
- 85.Kalluri AS et al. Single Cell Analysis of the Normal Mouse Aorta Reveals Functionally Distinct Endothelial Cell Populations. Circulation (2019) doi: 10.1161/CIRCULATIONAHA.118.038362. [DOI] [PMC free article] [PubMed] [Google Scholar]
- 86.McDonald AI et al. Endothelial Regeneration of Large Vessels Is a Biphasic Process Driven by Local Cells with Distinct Proliferative Capacities. Cell Stem Cell 23, 210–225.e6 (2018). [DOI] [PMC free article] [PubMed] [Google Scholar]
- 87.Kuznetsova T, Prange KHM, Glass CK & de Winther MPJ Transcriptional and epigenetic regulation of macrophages in atherosclerosis. Nat Rev Cardiol (2019) doi: 10.1038/s41569-019-0265-3. [DOI] [PMC free article] [PubMed] [Google Scholar]
- 88.Souilhol C et al. Endothelial responses to shear stress in atherosclerosis: a novel role for developmental genes. Nat Rev Cardiol 17, 52–63 (2020). [DOI] [PubMed] [Google Scholar]
- 89.Basatemur GL, Jørgensen HF, Clarke MCH, Bennett MR & Mallat Z Vascular smooth muscle cells in atherosclerosis. Nat Rev Cardiol 16, 727–744 (2019). [DOI] [PubMed] [Google Scholar]
- 90.Libby P et al. Atherosclerosis. Nat Rev Dis Primers 5, 56 (2019). [DOI] [PubMed] [Google Scholar]
- 91.Wirka RC et al. Atheroprotective roles of smooth muscle cell phenotypic modulation and the TCF21 disease gene as revealed by single-cell analysis. Nat. Med (2019) doi: 10.1038/s41591-019-0512-5. [DOI] [PMC free article] [PubMed] [Google Scholar]
- 92.Yao F et al. Histone Variant H2A.Z Is Required for the Maintenance of Smooth Muscle Cell Identity as Revealed by Single-Cell Transcriptomics. Circulation 138, 2274–2288 (2018). [DOI] [PubMed] [Google Scholar]
- 93.Cochain C et al. Single-Cell RNA-Seq Reveals the Transcriptional Landscape and Heterogeneity of Aortic Macrophages in Murine Atherosclerosis. Circ. Res 122, 1661–1674 (2018). [DOI] [PubMed] [Google Scholar]
- 94.Winkels H et al. Atlas of the Immune Cell Repertoire in Mouse Atherosclerosis Defined by Single-Cell RNA-Sequencing and Mass Cytometry. Circ. Res 122, 1675–1688 (2018). [DOI] [PMC free article] [PubMed] [Google Scholar]
- 95.Lukowski SW et al. Single-Cell Transcriptional Profiling of Aortic Endothelium Identifies a Hierarchy from Endovascular Progenitors to Differentiated Cells. Cell Rep 27, 2748–2758.e3 (2019). [DOI] [PubMed] [Google Scholar]
- 96.Cao J et al. The single-cell transcriptional landscape of mammalian organogenesis. Nature 566, 496–502 (2019). [DOI] [PMC free article] [PubMed] [Google Scholar]
- 97.Regev A et al. The Human Cell Atlas. Elife 6, (2017). [DOI] [PMC free article] [PubMed] [Google Scholar]
- 98.Consortium HuBMAP. The human body at cellular resolution: the NIH Human Biomolecular Atlas Program. Nature 574, 187–192 (2019). [DOI] [PMC free article] [PubMed] [Google Scholar]
- 99.Franzén O, Gan L-M & Björkegren JL M. PanglaoDB: a web server for exploration of mouse and human single-cell RNA sequencing data. Database (Oxford) 2019, (2019). [DOI] [PMC free article] [PubMed] [Google Scholar]
- 100.Shi Y, Inoue H, Wu JC & Yamanaka S Induced pluripotent stem cell technology: a decade of progress. Nat Rev Drug Discov 16, 115–130 (2017). [DOI] [PMC free article] [PubMed] [Google Scholar]
- 101.Paik DT, Chandy M & Wu JC Patient and Disease-Specific Induced Pluripotent Stem Cells for Discovery of Personalized Cardiovascular Drugs and Therapeutics. Pharmacol. Rev 72, 320–342 (2020). [DOI] [PMC free article] [PubMed] [Google Scholar]
- 102.Bedada FB, Wheelwright M & Metzger JM Maturation status of sarcomere structure and function in human iPSC-derived cardiac myocytes. Biochim. Biophys. Acta 1863, 1829–1838 (2016). [DOI] [PMC free article] [PubMed] [Google Scholar]
- 103.Friedman CE et al. Single-Cell Transcriptomic Analysis of Cardiac Differentiation from Human PSCs Reveals HOPX-Dependent Cardiomyocyte Maturation. Cell Stem Cell 23, 586–598.e8 (2018). [DOI] [PMC free article] [PubMed] [Google Scholar]
- 104.Churko JM et al. Defining human cardiac transcription factor hierarchies using integrated single-cell heterogeneity analysis. Nat Commun 9, 4906 (2018). [DOI] [PMC free article] [PubMed] [Google Scholar]
- 105.Gu M et al. Patient-specific iPSC-derived endothelial cells uncover pathways that protect against pulmonary hypertension in BMPR2 mutation carriers. Cell Stem Cell 20, 490–504.e5 (2017). [DOI] [PMC free article] [PubMed] [Google Scholar]
- 106.McCracken IR et al. Transcriptional dynamics of pluripotent stem cell-derived endothelial cell differentiation revealed by single-cell RNA sequencing. Eur. Heart J (2019) doi: 10.1093/eurheartj/ehz351. [DOI] [PMC free article] [PubMed] [Google Scholar]
- 107.MacAskill MG et al. Robust Revascularization in Models of Limb Ischemia Using a Clinically Translatable Human Stem Cell-Derived Endothelial Cell Product. Mol. Ther 26, 1669–1684 (2018). [DOI] [PMC free article] [PubMed] [Google Scholar]
- 108.Cao J et al. Comprehensive single-cell transcriptional profiling of a multicellular organism. Science 357, 661–667 (2017). [DOI] [PMC free article] [PubMed] [Google Scholar]
- 109.Rosenberg AB et al. Single-cell profiling of the developing mouse brain and spinal cord with split-pool barcoding. Science 360, 176–182 (2018). [DOI] [PMC free article] [PubMed] [Google Scholar]
- 110.Efremova M & Teichmann SA Computational methods for single-cell omics across modalities. Nat. Methods 17, 14–17 (2020). [DOI] [PubMed] [Google Scholar]
- 111.Buenrostro JD et al. Single-cell chromatin accessibility reveals principles of regulatory variation. Nature 523, 486–490 (2015). [DOI] [PMC free article] [PubMed] [Google Scholar]
- 112.Satpathy AT et al. Massively parallel single-cell chromatin landscapes of human immune cell development and intratumoral T cell exhaustion. Nat. Biotechnol 37, 925–936 (2019). [DOI] [PMC free article] [PubMed] [Google Scholar]
- 113.Lareau CA et al. Droplet-based combinatorial indexing for massive-scale single-cell chromatin accessibility. Nat. Biotechnol 37, 916–924 (2019). [DOI] [PMC free article] [PubMed] [Google Scholar]
- 114.Cusanovich DA et al. The cis-regulatory dynamics of embryonic development at single-cell resolution. Nature 555, 538–542 (2018). [DOI] [PMC free article] [PubMed] [Google Scholar]
- 115.Corces MR et al. Lineage-specific and single-cell chromatin accessibility charts human hematopoiesis and leukemia evolution. Nat. Genet 48, 1193–1203 (2016). [DOI] [PMC free article] [PubMed] [Google Scholar]
- 116.Satpathy AT et al. Transcript-indexed ATAC-seq for precision immune profiling. Nat. Med 24, 580–590 (2018). [DOI] [PMC free article] [PubMed] [Google Scholar]
- 117.Cho S, Irianto J & Discher DE Mechanosensing by the nucleus: From pathways to scaling relationships. J. Cell Biol 216, 305–315 (2017). [DOI] [PMC free article] [PubMed] [Google Scholar]
- 118.Cho S et al. Mechanosensing by the Lamina Protects against Nuclear Rupture, DNA Damage, and Cell-Cycle Arrest. Dev. Cell 49, 920–935.e5 (2019). [DOI] [PMC free article] [PubMed] [Google Scholar]
- 119.Cao J et al. Joint profiling of chromatin accessibility and gene expression in thousands of single cells. Science 361, 1380–1385 (2018). [DOI] [PMC free article] [PubMed] [Google Scholar]
- 120.Karemaker ID & Vermeulen M Single-Cell DNA Methylation Profiling: Technologies and Biological Applications. Trends Biotechnol. 36, 952–965 (2018). [DOI] [PubMed] [Google Scholar]
- 121.Angermueller C et al. Parallel single-cell sequencing links transcriptional and epigenetic heterogeneity. Nat. Methods 13, 229–232 (2016). [DOI] [PMC free article] [PubMed] [Google Scholar]
- 122.Cheow LF et al. Single-cell multimodal profiling reveals cellular epigenetic heterogeneity. Nat. Methods 13, 833–836 (2016). [DOI] [PubMed] [Google Scholar]
- 123.Pott S Simultaneous measurement of chromatin accessibility, DNA methylation, and nucleosome phasing in single cells. Elife 6, (2017). [DOI] [PMC free article] [PubMed] [Google Scholar]
- 124.Clark SJ et al. scNMT-seq enables joint profiling of chromatin accessibility DNA methylation and transcription in single cells. Nat Commun 9, 781 (2018). [DOI] [PMC free article] [PubMed] [Google Scholar]
- 125.Stoeckius M et al. Simultaneous epitope and transcriptome measurement in single cells. Nat. Methods 14, 865–868 (2017). [DOI] [PMC free article] [PubMed] [Google Scholar]
- 126.Specht H et al. Single-cell mass-spectrometry quantifies the emergence of macrophage heterogeneity. bioRxiv 665307 (2019) doi: 10.1101/665307. [DOI] [Google Scholar]
- 127.Swaminathan J et al. Highly parallel single-molecule identification of proteins in zeptomole-scale mixtures. Nat. Biotechnol (2018) doi: 10.1038/nbt.4278. [DOI] [PMC free article] [PubMed] [Google Scholar]
- 128.Salmén F et al. Barcoded solid-phase RNA capture for Spatial Transcriptomics profiling in mammalian tissue sections. Nat Protoc 13, 2501–2534 (2018). [DOI] [PubMed] [Google Scholar]
- 129.Rodriques SG et al. Slide-seq: A scalable technology for measuring genome-wide expression at high spatial resolution. Science 363, 1463–1467 (2019). [DOI] [PMC free article] [PubMed] [Google Scholar]
- 130.Shalek AK & Benson M Single-cell analyses to tailor treatments. Sci Transl Med 9, (2017). [DOI] [PMC free article] [PubMed] [Google Scholar]
- 131.Levitin HM, Yuan J & Sims PA Single-Cell Transcriptomic Analysis of Tumor Heterogeneity. Trends Cancer 4, 264–268 (2018). [DOI] [PMC free article] [PubMed] [Google Scholar]
- 132.Kim K-T et al. Application of single-cell RNA sequencing in optimizing a combinatorial therapeutic strategy in metastatic renal cell carcinoma. Genome Biol. 17, 80 (2016). [DOI] [PMC free article] [PubMed] [Google Scholar]
- 133.Tirosh I et al. Dissecting the multicellular ecosystem of metastatic melanoma by single-cell RNA-seq. Science 352, 189–196 (2016). [DOI] [PMC free article] [PubMed] [Google Scholar]
- 134.Lavin Y et al. Innate Immune Landscape in Early Lung Adenocarcinoma by Paired Single-Cell Analyses. Cell 169, 750–765.e17 (2017). [DOI] [PMC free article] [PubMed] [Google Scholar]
- 135.Kolandaivelu K, Leiden BB, O’Gara PT & Bhatt DL Non-adherence to cardiovascular medications. Eur. Heart J 35, 3267–3276 (2014). [DOI] [PubMed] [Google Scholar]
- 136.Matsa E et al. Transcriptome profiling of patient-specific human iPSC-cardiomyocytes predicts individual drug safety and efficacy responses in vitro. Cell Stem Cell 19, 311–325 (2016). [DOI] [PMC free article] [PubMed] [Google Scholar]
- 137.Lam CK et al. Identifying the Transcriptome Signatures of Calcium Channel Blockers in Human Induced Pluripotent Stem Cell-Derived Cardiomyocytes. Circ. Res (2019) doi: 10.1161/CIRCRESAHA.118.314202. [DOI] [PMC free article] [PubMed] [Google Scholar]
- 138.Strzelecka PM, Ranzoni AM & Cvejic A Dissecting human disease with single-cell omics: application in model systems and in the clinic. Dis Model Mech 11, (2018). [DOI] [PMC free article] [PubMed] [Google Scholar]
- 139.Jaitin DA et al. Massively parallel single-cell RNA-seq for marker-free decomposition of tissues into cell types. Science 343, 776–779 (2014). [DOI] [PMC free article] [PubMed] [Google Scholar]
- 140.Bagnoli JW et al. Sensitive and powerful single-cell RNA sequencing using mcSCRB-seq. Nat Commun 9, 2937 (2018). [DOI] [PMC free article] [PubMed] [Google Scholar]
- 141.Goldstein LD et al. Massively parallel nanowell-based single-cell gene expression profiling. BMC Genomics 18, 519 (2017). [DOI] [PMC free article] [PubMed] [Google Scholar]
- 142.Goodyer WR et al. Transcriptomic Profiling of the Developing Cardiac Conduction System at Single-Cell Resolution. Circ. Res 125, 379–397 (2019). [DOI] [PMC free article] [PubMed] [Google Scholar]
- 143.Li Z et al. Single-cell transcriptome analyses reveal novel targets modulating cardiac neovascularization by resident endothelial cells following myocardial infarction. Eur. Heart J 40, 2507–2520 (2019). [DOI] [PMC free article] [PubMed] [Google Scholar]
- 144.Tang J et al. Arterial Sca1+ Vascular Stem Cells Generate De Novo Smooth Muscle for Artery Repair and Regeneration. Cell Stem Cell 26, 81–96.e4 (2020). [DOI] [PubMed] [Google Scholar]
- 145.Martini E et al. Single-Cell Sequencing of Mouse Heart Immune Infiltrate in Pressure Overload-Driven Heart Failure Reveals Extent of Immune Activation. Circulation 140, 2089–2107 (2019). [DOI] [PubMed] [Google Scholar]
- 146.Francesconi M et al. Single cell RNA-seq identifies the origins of heterogeneity in efficient cell transdifferentiation and reprogramming. Elife 8, (2019). [DOI] [PMC free article] [PubMed] [Google Scholar]
- 147.Nguyen QH et al. Single-cell RNA-seq of human induced pluripotent stem cells reveals cellular heterogeneity and cell state transitions between subpopulations. Genome Res. 28, 1053–1066 (2018). [DOI] [PMC free article] [PubMed] [Google Scholar]
- 148.Ohta R et al. Laminin-guided highly efficient endothelial commitment from human pluripotent stem cells. Sci Rep 6, 35680 (2016). [DOI] [PMC free article] [PubMed] [Google Scholar]
- 149.Stuart T et al. Comprehensive Integration of Single-Cell Data. Cell 177, 1888–1902.e21 (2019). [DOI] [PMC free article] [PubMed] [Google Scholar]