

Abstract

Submicron SSZ-13 with different acidities was synthesized successfully with the assistance of nanosized SSZ-13 seeds. The methanol-to-olefins (MTO) properties of submicron SSZ-13 were evaluated. The lifetime of submicron SSZ-13 was enhanced because of the crystal size reduction. The selectivity of light olefins was improved evidently at the early stage of the MTO reaction as the acidity density decreased. TG, GC–MS, and in situ UV/vis spectra were utilized to investigate coking behavior during the MTO reaction. It was found that the acidity density influences the nature and rate of coke formation. The majority of the hydrocarbon pool species over SSZ-13 with a low acidity density (125.2 μmol/g) were methylated benzene carbocations, while that over SSZ-13 with a high acidity density (330.2 μmol/g) were methylated naphthalene carbocations. The low acidity density of SSZ-13 can suppress the hydrogen transfer reaction and polyaromatic generation.
1. Introduction
The methanol-to-olefins (MTO) process is an efficient route to produce light olefins, which are critical raw materials of plastics.1−3 Compared with traditional petroleum cracking, the MTO process produces light olefins from methanol, which can be synthesized by syngas. Not only coal and natural gas but also sustainable resources such as biomass can be converted to syngas. The development of the MTO process lowers the dependence of crude oil and is advantageous to the clean and full utilization of coal. Zeolites and zeolite-type materials having excellent hydrothermal stability with micropore structures and Brønsted acid sites (BAS) are ideal catalysts for the MTO reaction.3,4 High-silica ZSM-5 (MFI) shows outstanding selectivity to propylene and is an industrialized catalyst for the methanol-to-propylene (MTP) process.5−7 SAPO-34 and SSZ-13 (CHA) possess the highest light olefins selectivity of above 85% because larger organics such as benzenes and naphthalenes confined in a cage cannot exit from zeolite.8−11 The acid strength of SSZ-13 is stronger than that of SAPO-34 due to the differences in the electronegativities of the elements forming the framework. It makes SSZ-13 possess not only high catalytic activity at a low reaction temperature but also a quick coke deposition rate during the MTO reaction compared with SAPO-34. Recently, reducing crystal size has become an efficient way to make more aromatics over the MTO catalyst active.12,13 Adding seeds is an efficient way to reduce crystal size. Peng et al.14 developed a two-stage synthetic method that could tune the SSZ-13 crystal size within 50–300 nm. In this paper, nanosized SSZ-13 crystals were employed as seeds to exert control over SSZ-13 crystal size.15 Submicron SSZ-13 with different Si/Al ratio (SAR) samples were successfully synthesized by us.
The hydrocarbon pool mechanism is generally accepted by this time.16−18 Recently, some researchers investigated the effect of coke species on MTO properties. Borodina et al.19 studied the coke evolution on SSZ-13 at different temperatures through UV–vis spectroscopy. Goetze et al.20 compared the coke species forming on the CHA, DDR, and LEV structures and revealed the linkage with the MTO properties. The acidity of SSZ-13 shows an impact on the MTO lifetime and selectivity and coking behaviors. However, the investigation of the hydrocarbon pool evolution on SSZ-13 with different acidities was barely reported. Light olefins as the products of the MTO reaction are also reactants participating in the whole reaction process and could be involved in methylation, oligomerization, cyclization, alkylation, and cracking. Further reaction of the olefins is supposed to yield the main sources of coking.21 The hydrogen transfer between olefins could form alkanes, as byproducts, and dienes, which could further undergo cyclization to form aromatics.22 The conversion and coking of light olefins were also studied over submicron SSZ-13 with different acidities to help in interpretation of coke species deposition.
In this work, the stability of SSZ-13 during the MTO reaction was improved due to the smaller crystal size brought by SSZ-13 seeds. The acidity density impacts the nature of coke species and its evolution during the MTO reaction. The results showed that the dominating hydrocarbon pool species tuned from methylbenzenes to methylated naphthalene as the acidity intensity of SSZ-13 increased.
2. Results and Discussion
2.1. Effect of Seeds on SSZ-13 Crystallization
The synthesized conditions including gel composition and seed amount are listed in Table 1. The SAR of gel composition and seed amount was varied to investigate the influence of these conditions on crystallization of the samples. The X-ray diffraction (XRD) patterns are shown in Figure 1a. All samples presented a typical CHA structure characteristic diffraction peak. The sample S-20-80-0 possessing the highest XRD peak intensity was assigned as the basis for the calculation of the relative intensity. The relative intensity decreased after adding the seeds, which is probably affected by the crystal size reduction. The intermediates of the samples S-20-40-0 and S-20-40-0.5 after different hydrothermal treatment times were collected and characterized by XRD. Both the samples were still amorphous at 3 h, but some weak diffraction peaks matching the CHA structure could be observed on the XRD pattern of S-20-40-0.5 (Figure S1). It implied that the added seeds could maintain the CHA structure during hydrothermal treatment and promoted crystallization. The added seeds could provide surface area for growth, thus reducing the induction time.23 As a result, sample S-20-40-0.5 showed the CHA peaks after 6 h of hydrothermal treatment, while S-20-40-0 was still amorphous. Scanning electron microscopy (SEM) images (Figure 2) indicated that the introduction of seeds could decrease the crystal size efficiently even though the SAR of the initial gel changed dramatically. Dokter et al.24 reported that the gel composition showed an impact on the size and quantities of nucleates. It was found that S-20-80-0 showed the largest crystal size in comparison to S-20-20-0, S-20-40-0, and S-20-80-0 prepared without seeds. Increasing seed weight is beneficial to raise the nucleate quantity to stem the grain size enlargement. Generally, the seeds could be utilized for controlling the crystal size and mitigating the effect of SAR on the SSZ-13 crystallization process.
Table 1. Relative Crystalline, Average Crystal Size, SAR, and Yield of SSZ-13 Zeolites Synthesized in the Conditions of Different Gel SARs and Seed Amounts.
| sample | gel composition TMAdaOH/Na2O/Al2O3/SiO2/H2O | seed amounta (wt %) | relative crystalline (%)b | particle sizec (μm) | SARd | yielde (%) |
|---|---|---|---|---|---|---|
| S-20-20-0 | 20:10:2.5:100:4400 | 0 | 72.3 | 1.42 | 14.3 | 71.2 |
| S-20-20-0.5 | 20:10:2.5:100:4400 | 0.5 | 47.8 | 0.54 | 15.0 | 78.7 |
| S-20-20-1 | 20:10:2.5:100:4400 | 1 | 46.9 | 0.52 | 16.6 | 77.5 |
| S-20-40-0 | 20:10:1.25:100:4400 | 0 | 79.0 | 1.52 | 27.3 | 69.4 |
| S-20-40-0.5 | 20:10:1.25:100:4400 | 0.5 | 56.9 | 0.60 | 26.3 | 75.2 |
| S-20-40-1 | 20:10:1.25:100:4400 | 1 | 37.2 | 0.37 | 25.6 | 74.9 |
| S-20-80-0 | 20:10:0.625:100:4400 | 0 | 100.0 | 2.56 | 48.2 | 75.6 |
| S-20-80-0.5 | 20:10:0.625:100:4400 | 0.5 | 40.9 | 0.42 | 40.2 | 76.8 |
| S-20-80-1 | 20:10:0.625:100:4400 | 1 | 36.1 | 0.33 | 38.5 | 76.1 |
Seed weight (wt %) = M(seeds)/M(gel) × 100%, where M(seeds) and M(gel) are assigned as the mass of seeds and the initial gel composites, respectively.
The relative crystallinity of the samples was calculated by the equation relative crystallinity =∑I/∑I1 × 100%, where I is the line intensity of the sample and I1 is the line intensity of the sample S-20-80-0.
The mean of 200 SSZ-13 particles randomly selected.
The real Si/Al ratio of the sample was determined by inductively coupled plasma (ICP).
Yield = M1/(M2 + M3) × 100%, where M1, M2, and M3 are the masses of the calcined sample, seed, and theoretical SSZ-13 sample, respectively.
Figure 1.

XRD patterns of the as-synthesized samples (a); XRD patterns of S-20-40-0 (b) and S-20-40-0.5 (c) after different hydrothermal treatment times.
Figure 2.

SEM images of S-20-20-0 (a1), S-20-20-0.5 (a2), S-20-20-1 (a3), S-20-40-0 (b1), S-20-40-0.5 (b2), S-20-40-1 (b3), S-20-80-0 (c1), S-20-80-0.5 (c2), and S-20-80-1 (c3).
2.2. Effect of a Structure-Directing Agent (SDA) on Submicron SSZ-13 Crystallization
For investigating the SDA ratio effect on SSZ-13 crystallization, the gel SAR was fixed as 40, the seed weight was controlled as 0.25 and 0.5, and the SDA molar ratio was changed from 0 to 20. In Figure 3 and Table 2, the XRD diffraction intensity and the relative crystalline of SSZ-13 samples declined as the SDA molar ratio decreased. The product of gel without SDA was still amorphous even after hydrothermal treatment. SEM images (Figure 4) were consistent with the XRD results. S-0-40-0.25 and S-0-40-0.5 were still amorphous precursors exhibiting nanosize spherical morphology. The results indicated that an extremely low SDA molar ratio would inhibit the establishment of the CHA framework. Meanwhile, the actual SAR determined by ICP showed a trend of decline with a decrease in the SDA molar ratio. The incorporation of alumina seems to be tougher when the SSZ-13 synthesis gel lacks the SDA.
Figure 3.

XRD of the as-synthesized samples.
Table 2. Relative Crystalline, Average Crystal Size, SAR, and Yield of SSZ-13 Zeolites Synthesized in the Conditions of Different SDA Molar Ratios and Seed Amounts.
| sample | gel composition TMAdaOH/Na2O/Al2O3/SiO2/H2O | seeding weighta (wt %) | relative crystallineb (%) | average crystal sizec (μm) | SARd (ICP) | yielde (%) |
|---|---|---|---|---|---|---|
| S-20-40-0.5 | 20:10:1.25:100:4400 | 0.5 | 56.9 | 0.60 | 26.3 | 75.2 |
| S-10-40-0.25 | 10:10:1.25:100:4400 | 0.5 | 61.7 | 0.89 | 53.2 | 79.1 |
| S-10-40-0.5 | 10:10:1.25:100:4400 | 0.25 | 49.07 | 0.75 | 43.8 | 84.0 |
| S-5-40-0.25 | 5:10:1.25:100:4400 | 0.5 | 27.8 | 0.46 | 190.6 | 65.3 |
| S-5-40-0.5 | 5:10:1.25:100:4400 | 0.25 | 31.7 | 0.50 | 183.0 | 67.1 |
| S-0-40-0.25 | 0:10:1.25:100:4400 | 0.25 | 235.7 | 42.4 | ||
| S-0-40-0.5 | 0:10:1.25:100:4400 | 0.5 | 110.7 | 51.8 |
Seed weight (wt %) = M(seeds)/M(gel), where M(seeds) and M(gel) are assigned as the mass of seeds and the initial gel composites, respectively.
he relative crystallinity of the samples was calculated by the equation: relative crystallinity =∑I/∑I1 × 100%, where I is the line intensity of the sample and I1 is the line intensity of the sample S-20-80-0.
The mean of 200 SSZ-13 particles randomly selected.
The real Si/Al ratio of the sample was determined by ICP.
Yield = M1/(M2+M3) × 100%, where M1, M2, and M3 were the masses of the calcined sample, seed, and theoretical SSZ-13 sample, respectively.
Figure 4.

SEM images of S-10-40-0.25 (a1), S-5-40-0.25 (a2), S-0-40-0.25 (a3), S-10-40-0.5 (b1), S-5-40-0.5 (b2), and S-0-40-0.5 (b3).
2.3. Putative Pathways of Seed-Assisted Crystallization
In this synthesis, seeds could not afford the induction work of the CHA structure build-up without the SDA. The SDA in the synthesis gel fills the void space of the zeolite pore system and plays a pore-stabilizing role.25 Moreover, the SDA could guide the silicate of aluminosilicate T-units assembly through electrostatic and van der Waals forces. Based on the mechanism of the cation-mediated assembly,26,27 the putative crystallization mechanism for submicron SSZ-13 synthesized with seeds is shown in Scheme 1. The nano SSZ-13 seeds added into the gel supplies the external surface on which the SSZ-13 precursor can grow. In homogeneous nucleation, the synthesis gel supersaturation needs to reach a high level to form a surface like the seed’s external surface to start the crystallization. As a result, the induction time of SSZ-13 was shortened when the seeds existed. On the molecular scale, the SDA cation utilized the ordered seed’s crystal face, appealing to T-units in the mother liquid primarily through electrostatic interaction and making these build units form the CHA structure through the condensation reaction. The process replicated and promoted the SSZ-13 crystallization. The aluminosilicate T-units possessing more negative charges were easily attracted by the SDA cation and coordinated in the CHA framework. The reduction of the SDA inhibited condensation and replication of T-units; as a result, the real alumina amount and the crystallinity decreased as the SDA molar ratio declined.
Scheme 1. Putative Crystallization Mechanism of Submicron SSZ-13 Prepared with the Aid of Seeds.

2.4. Catalytic Performance of SSZ-13 in the MTO Reaction
The lifetime (the reaction time when the conversion reaches 98%) and the product selectivities at 98% methanol conversion are shown in Table 3. As shown in Figure 5a, S-20-20-1 exhibited the longest lifetime. The crystal size reduction promoted the mass diffusion in the MTO reaction and slowed down the deactivation. The methanol conversion and selectivity of S-20-40-0.5, S-10-40-0.25, S-10-40-0.5, and S-5-40-0.5 are displayed in Figure 5b. S-5-40-0.5 shows the shortest lifetime due to its poor crystallinity. The previous ICP results demonstrate that there are fewer alumina elements in the samples S-10-40-0.25 and S-10-40-0.5. Catalytic performance results were consistent with ICP results, and the two samples exhibited excellent initial selectivities of C2= + C3 (66.3 and 69.7% for S-10-40-0.25 and S-10-40-0.5, respectively), which was higher than that of S-20-40-0.5.
Table 3. Lifetime, Coke Amount, and Product Selectivity of the MTO Reaction at 98% Methanol Conversion Over SSZ-13 Zeolites (T = 350 °C; Weight Hourly Space Velocity (WHSV) = 1.2 h–1).
| selectivity
(%) |
||||||
|---|---|---|---|---|---|---|
| sample | lifetimea (min) | C2= | C3= | C3 | C4–C6 | coke amountb (%) |
| S-20-20-0 | 270 | 35.1 | 42.1 | 4.0 | 16.9 | 23.5 |
| S-20-20-0.5 | 480 | 40.3 | 40.1 | 2.5 | 15.3 | 29.0 |
| S-20-20-1 | 600 | 45.3 | 38.7 | 1.2 | 13.0 | 25.5 |
| S-20-40-0 | 330 | 42.1 | 36.4 | 3.1 | 16.3 | 24.9 |
| S-20-40-0.5 | 600 | 47.8 | 36.7 | 0.7 | 12.8 | 22.2 |
| S-20-40-1 | 570 | 45.8 | 38.5 | 0.9 | 13.1 | 21.0 |
| S-20-80-0 | 330 | 46.0 | 35.2 | 1.9 | 15.7 | 22.7 |
| S-20-80-0.5 | 480 | 44.5 | 39.5 | 0.5 | 14.1 | 17.3 |
| S-20-80-1 | 540 | 44.7 | 39.0 | 0.5 | 14.3 | 16.5 |
| S-10-40-0.25 | 390 | 41.4 | 38.8 | 0.8 | 17.5 | 16.1 |
| S-10-40-0.5 | 540 | 44.7 | 38.4 | 0.5 | 14.9 | 16.1 |
| S-5-40-0.5 | 270 | 43.8 | 39.8 | 0.9 | 13.53 | 11.8 |
| SAPO-34 | 240 | 33.6 | 44.4 | 0.4 | 18.9 | |
Lifetime is defined as the time to reach 98% methanol conversion.
Coke deposition amount after an 18 h MTO reaction.
Figure 5.

Methanol conversion and selectivity of C2= + C3 with time on stream (TOS) over S-20-20-0, S-20-20-0.5, and S-20-20-1 (a) and S-20-40-0.5, S-10-40-0.5, S-10-40-0.25, and S-5-40-0.5 (b). Reaction conditions: T = 350 °C, WHSV =1.2 h–1, and catalyst weight = 500 mg.
The Ar physisorption isotherms and NH3 temperature-programmed desorption (TPD) of S-20-20-0.5, S-20-40-0.5, S-20-80-0.5, and SAPO-34 are shown in Figures S2 and S3, respectively. All of the samples showed type-I Ar adsorption/desorption isotherms. The NH3-TPD of thr samples presents two desorption peaks, and the peak at 300–600 °C is mainly contributed by NH3 desorption from BAS. In Table 4, S-20-20-0.5, S-20-40-0.5, and S-20-80-0.5 show similar textual properties including the Brunauer–Emmett–Teller (BET) surface area, micropore surface area, and pore volume. The density of the strong acid sites of the three samples declined with an increase in the SSZ-13 gel SAR. The density of the strong acid sites of SAPO-34 resembled that of S-20-40-0.5. To further investigate the coordination of Al in the framework, the 27Al magic angle spinning nuclear magnetic resonance (MAS NMR) spectra of S-0.2-20-0.5, S-0.2-40-0.5, and S-0.2-80-0.5 are shown in Figure S4. The peaks at −4.65 and 54.63 ppm represent the extra framework Al in octahedrally coordinated (AlVI) and tetrahedrally coordinated Al species (AlIV) in the CHA framework, respectively. The results showed that most Al atoms are located in the SSZ-13 framework.
Table 4. Textual and Acidity Properties of S-20-20-0.5, S-20-40-0.5, S-20-80-0.5, and SAPO-34.
| sample | SBET (m2/g)a | Smicro (m2/g)b | Sext (m2/g)b | Vtotal (cm3/g)c | strong acid sites (μmol/g)d |
|---|---|---|---|---|---|
| S-20-20-0.5 | 527.2 | 477.8 | 45.7 | 0.28 | 330.2 |
| S-20-40-0.5 | 524.7 | 467.50 | 53.6 | 0.28 | 215.6 |
| S-20-80-0.5 | 512.5 | 444.3 | 64.6 | 0.28 | 125.2 |
| SAPO-34 | 463.1 | 413.2 | 47.0 | 0.28 | 254.6 |
SBET (total surface area) was calculated by the BET equation.
Smicro (micro surface area) and Sext (external surface area) were determined from the t-plot method.
Vtotal (total pore volume) was determined from the adsorbed volume at P/P0 = 0.98.
The acidity densities of the strong acid sites were determined from the amount of NH3 desorbed at 300–600 °C.
The methanol conversion and selectivity of C2= + C3 of S-20-20-0.5, S-20-40-0.5, S-20-80-0.5, and SAPO-34 are shown in Figure 6 for revealing the effect of acid density on the SSZ-13 MTO properties. S-20-40-0.5 exhibited the longest lifetime of 600 min among all samples. S-20-80-0.5 with the lowest density did not extend the lifetime further, which indicated that excessively low acidity density impaired the SSZ-13 stability to some extent on the condition of low diffusion resistance. As shown in Figure S5, the reduction of acidity density suppressed the hydrogen transfer reaction, which caused the evident rise of the initial selectivities of C2= + C3 (51.3, 66.7, and 69.7% for S-20-20-0.5, S-20-40-0.5, and S-20-80-0.5, respectively). The comparison of MTO properties between S-20-40-0.5 and SAPO-34 showed that the methanol conversion declined over SAPO-34, which was started early and conducted slowly. Meanwhile, the selectivity of C2= + C3 of SAPO-34 was lower than that of S-20-40-0.5 because more methanol was converted to C4–C6 products. The acid strength of SSZ-13 was greater than that of SAPO-34; therefore, S-20-40-0.5 exhibited higher activity in the MTO reaction. High acid strength could also promote the cracking of C4–C6 products. Consequently, SSZ-13 showed a higher selectivity of C2= + C3 compared with SAPO-34. The stability of S-20-20-0.5 was further evaluated by the reaction–reactivation cycling; the lifetime and selectivity of C2= + C3 (Figure S6) were quite stable during 3 times cycling.
Figure 6.

Methanol conversion and selectivity of C2= + C3 with time on stream (TOS) over S-20-20-0, S-20-40-0.5, S-20-80-0.5, and SAPO-34. Reaction conditions: T = 350 °C, WHSV =1.2 h–1, and catalyst weight = 500 mg.
2.5. Effect of Acidity on the Coking Behavior of Submicron SSZ-13
Gas chromatography–mass spectrometry (GC–MS) was used to investigate coke species confined on S-20-20-0.5, S-20-40-0.5, and S-20-80.5 after an 18 h MTO reaction. Table 5 shows the distribution of the retained coke species. The SAR increase could make the catalyst form polymethylbenzenes and suppress phenanthrene and pyrene formation. The distribution of polymethylbenzenes could reach 64.85% over S-20-80-0.5. There were more plentiful naphthalenes in the spent catalyst, which has a lower SAR. More alumina was incorporated in the zeolite framework, creating more acid sites. According to the catalytic performance data, the hydrogen transfer reaction was quite severe. The abundant acid sites catalyze the reaction in which propylene takes away hydrogens from alkenes to form dienes and propane.22 These dienes could involve in the hydrocarbon pool formation, leading to more generation of polyaromatics.
Table 5. Distribution of the Retained Coke Speciesa.
| sample | B-CnH2n+1, n ≥ 1 (%) | NP (%) | NP-CH3 (%) | NP-CnH2n+1, n ≥ 2 (%) | 3 rings (%) |
|---|---|---|---|---|---|
| S-20-20-0.5 | 21.44 | 5.7 | 14.37 | 31.79 | 16.52 |
| S-20-40-0.5 | 44.17 | 2.38 | 6.26 | 33.57 | 2.0 |
| S-20-80-0.5 | 64.85 | 0.9 | 3.19 | 25.49 | 0.4 |
B, NP, and 3 rings represent benzene, naphthalene, and phenanthrene, respectively.
n-Butene, propylene, and ethylene were fed into the zeolites at 350 °C to study the reaction of light olefins over SSZ-13. In Figure S7, the conversion of n-butene reached 100% at the initial stage of the reaction and dropped more quickly compared with propylene and ethylene; therefore, 1-butene could participate in the hydrogen transfer reaction and form dienes and polyaromatics. More propanes and ethylenes could be converted when the SSZ-13 acidity density increased. The composition of coke over submicron SSZ-13 after the reaction of light olefins (Figure S8) showed that light olefins tend to form more monocyclic aromatics as the acidity density decreases, which indicated that the cyclization can be inhibited by decreasing the acidity density.
The MTO reaction on S-20-20-0.5, S-20-40-0.5, and S-20-80-0.5 were stopped after different TOS, and the retained coke content and coke species were analyzed by thermogravimetry (TG) and GC–MS, respectively, for revealing the effect of acidity on the coke deposition rate and coke species evolution. In Figure 7, it could be observed that the coke deposition rate and coke content increase on SSZ-13 with the increase in acidity density.
Figure 7.
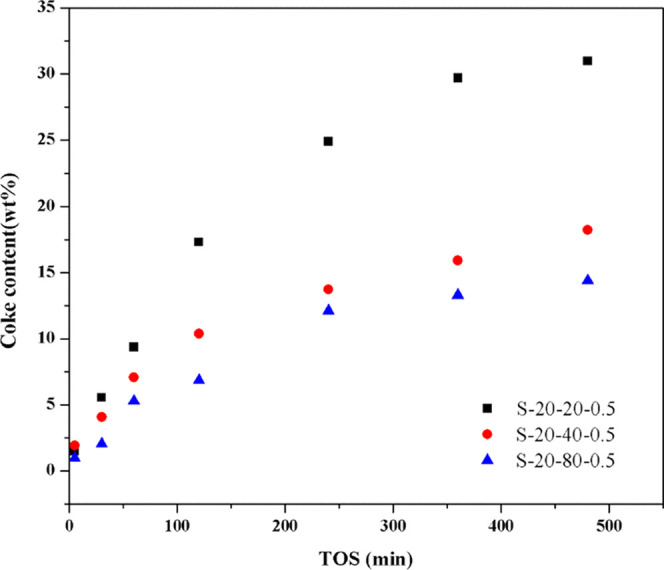
Coke content of the spent zeolite after different times on stream. Reaction conditions: T = 350 °C, WHSV = 2.0 h–1, and catalyst weight = 300 mg.
The GC–MS results and the proportion (based on flame ionization detector (FID)) of major coke species with TOS are shown in Figures S9 and 8, respectively. On the sample S-20-20-0.5, the portion of naphthalene and methylnaphthalene escalated first and then dropped, whereas the portion of phenanthrene increased with TOS. The proportion of polymethylbenzenes was lower than those of S-20-40-0.5 and S-20-80-0.5. On S-20-40-0.5, the portion of naphthalene increased gradually in the first 120 min and was then consumed from 120 to 240 min. The process of generation and expenditure of naphthalene that appeared on S-20-20-0.5 could similarly be observed on S-20-40-0.5. However, the process went faster and the proportion of naphthalene on S-20-40-0.5 could not reach as high as that on S-20-20-0.5. On S-20-80-0.5, the generation and expenditure process of naphthalene and methylnaphthalene still remained and finished in the first 120 min. The proportion of polymethylbenzene was the highest and that of phenanthrene was the lowest on S-20-80-0.5 among the three samples.
Figure 8.

Coke distribution (based on FID) of polymethylbenzenes (a), naphthalene (b), methylnaphthalene (c), polymethylnaphthalene (d), and phenanthrene (e). Reaction condition: T = 350 °C, WHSV = 2.0 h–1, and catalyst weight = 300 mg.
In situ UV/vis spectra (Figure 9) were utilized to study the nature and dynamics of hydrocarbon species on SSZ-13 with different acid quantities. In situ UV/vis spectra could detect the carbocations generated during the reaction without a cooling or extraction procedure. For the three SSZ-13 samples, UV/vis bands at 275, 334, 300, 390, and 430 nm appeared with TOS. Based on the previous study, the bands at 265–285,28 290–310,19,29 330–360,30,31 385–400,20 and 415–43032,33 are assigned to neutral aromatics, alkyl-substituted cyclopentenyl carbocations, dienylic carbocations, methylated benzene carbocations, and methylated naphthalene carbocations, respectively. Over S-20-20-0.5, the bands at 330 and 390 nm appeared during the early stage of the MTO reaction. With further reaction, the intensity of the band at 330 nm decreased, the band at 334 nm appeared, and the peak center of the band at 390 nm redshifted to 430 nm. These observations indicate that the alkyl-substituted cyclopentenyl carbocations (300 nm) and methylated benzene carbocations (390 nm) formed rapidly in the early stage of the MTO reaction. Subsequently, these monocyclic carbocations interacted with dienylic carbocations (334 nm) to form methylated naphthalene carbocations gradually (430 nm), which caused the redshift of the band located originally at 390 nm. Over S-20-40-0.5, the band at 300 nm appeared and its intensity increased as the MTO reaction progressed. Then, the intensity of the band at 300 nm weakened slightly, and the bands at 275 and 430 nm appeared. The results indicated that the alkyl-substituted cyclopentenyl carbocations (300 nm) played a major role during the MTO reaction. When the deactivation happened, the alkyl-substituted cyclopentenyl carbocations (300 nm) and methylated benzene carbocations (390 nm) reacted with light olefins and formed methylated naphthalene carbocations (430 nm). Some parts of monocyclic carbocations transformed to be neutral aromatics (275 nm). The spectra variation tendency of S-20-80-0.5 resembled that of S-20-40-0.5. The intensity of the band over S-20-80-0.5 seemed to be the weakest among the three samples, which was probably caused by its lowest coke content.
Figure 9.

In situ UV–vis spectra on S-20-20-0.5 (a), S-20-40-0.5 (b), and S-20-80-0.5 (c). Reaction condition: T = 350 °C, catalyst weight = 15 mg, and methanol was fed by the Ar flow (17.1 mL/min) through a saturator kept at 30 °C.
The putative schematic of coke deposition on the submicron-sized SSZ-13 with different acidity densities is shown in Scheme 2. The acidity density of submicron SSZ-13 has an impact on its MTO properties and coking behavior. The alteration of hydrocarbon species formed inside the catalyst pores of SSZ-13 zeolite with the acidity is tightly related to the reaction of olefins. Olefins act as reactants and participate in the whole reaction process. At the initial stage of the MTO reaction, olefins undergo aromatization to form the hydrocarbon pool species catalyzing the methanol-to-olefins reaction. More acidity density would promote alkylation, the hydrogen transfer reaction, and cyclization of alkenes. The intense secondary reaction of alkene such as the hydrogen transfer reaction would fill the cage with more two-ring aromatics such as naphthalene and methylnaphthalene over SSZ-13 with a high acidity density. The naphthalene and methylnaphthalene would act as active sites and catalyze the MTO reaction until they turn to inactive coke species such as phenanthrene and tetramethylnaphthalene. On SSZ-13 with a low acidity density, the hydrogen transfer reaction of olefins was suppressed and one-ring aromatics became dominant in the SSZ-13 cages. These monocyclic carbocations were active until they were cyclized with alkenes and formed the inactive species tetramethylnaphthalene.
Scheme 2. Putative Mechanism of Coke Species Deposition on Submicron SSZ-13 with Different Acidity Densities.

3. Conclusions
The seeds added into the SSZ-13 initial gel could reduce the crystal size and weaken the influence of the alumina content of the gel on SSZ-13 morphology. The seeds supplied the crystal nucleus, accelerated the crystallization process, and reduced the crystal size. Decreasing the SDA molar ratio of the gel could inhibit the incorporation of alumina into the SSZ-13 framework and SSZ-13 crystallization. Submicron SSZ-13 showed an extended lifetime due to crystal size reduction. Decreasing acidity density could enhance the selectivity of C2= + C3 in the initial period of the MTO reaction. One-ring and two-ring coke species could undertake the active sites for methanol conversion at 350 °C, but the proportion of them over SSZ-13 was determined by the acidity density. High acidity density could intensify the further reaction of the olefins, including the hydrogen transfer reaction and cyclization, and make more naphthalene and methylnaphthalene deposits. These two-ring coke species played the role of active sites catalyzing the MTO reaction. Decreasing the acid density of SSZ-13 can suppress the side reaction of the olefins and make polymethybenzenes the primary hydrocarbon pool species.
4. Experimental Section
4.1. Synthetic Procedures
4.1.1. Chemical Reagent
The structure-directing agent (SDA) used in the synthesis was N,N,N-trimethyl-1-adamantammonium hydroxide (TMAdaOH, 35 wt %, Shanghai Annaiji Chemical Reagent Co.). Fumed silica (99.9%, Aldrich) and silica sol (30.0 wt %, Shanghai Macklin Biochemical Co.) were used as silica resources. Aluminum isopropoxide (99.9%, Shanghai Lingfeng Chemical Reagent Co.) and aluminum hydroxide (99.9%, Aldrich) were used as aluminum sources. The rest of the chemical reagents used in the experiments were NaOH (98%, Shanghai Lingfeng Chemical Reagent Co.), NH4Cl (99.9%, Shanghai Taitan Co.), and anionic polyacrylamide (Mw = 3 million, Shanghai Macklin Biochemical Co.). All the chemicals were used without further purification.
4.1.2. SSZ-13
A typical synthesis procedure of SSZ-13 was as follows. NaOH, Al(OH)3, and the SDA were added into deionized water successively, and the composites were stirred for 30 min. Then, silica sol was dropwise added to the gel slowly. After that, SSZ-13 seeds prepared according to the method reported by Xu et al.15 were added, and the mixture was stirred for 1 h. The gel was transferred into Teflon containers and was treated hydrothermally at 160 °C for 5 days. The zeolites were collected by centrifugation and washed three times with deionized water and dried in air at 110 °C for 12 h. The zeolites were calcined at 550 °C for 6 h under flowing air to remove the SDA. Samples were ion-exchanged three times with 1.0 M NH4Cl solutions followed by calcination at 550 °C for 6 h to transform them to HSSZ-13. The molar composition of SSZ-13 gel was xTMAdaOH/10 Na2O/pAl2O3/100 SiO2/4400 H2O. The sample was named S-x-y-z, where x, y, and z represent the molar ratio of the SDA ratio, Si/Al ratio (50/p), and seed weight percent in the gel, respectively.
4.1.3. SAPO-34
SAPO-34 was synthesized according to the method reported by Huang et al.34 and its molar composition was SiO2/Al2O3/H3PO4/TEAOH/H2O/HCl = 0.16:1:2:2:70:0.7
4.2. Characterization
X-ray diffraction (XRD) patterns were recorded on a Bruker D8 Advance diffractometer using Cu Kα radiation in the 2θ range of 3–50°. The chemical composition of the samples was determined by ICP-optical emission spectroscopy (OES) (Agilent 725). The surface and pore volume of the zeolite was obtained by Ar physisorption at −186 °C on Micromeritics ASAP 2020 instrument. The samples were outgassed at 350 °C for 8 h before taking the sorption measurements. The total surface area was determined by the BET method. The micropore surface area and volume were determined by the t-plot method. Scanning electron microscopy (SEM) images were taken using a Nova NanoSEM-450 field emission scanning electron microscope. Micromeritics AutoChemII 2920 was used to record the NH3 temperature-programmed desorption (TPD) curve. Two hundred milligrams of the samples was loaded into a quartz U-shaped tube and was heated to 550 °C for 2 h in flowing He (40 mL/min). The samples were then cooled to 100 °C and NH3 was adsorbed under the flow of NH3/He (10 vol % NH3) at a flow rate of 30 mL/min for 30 min. After purging for 1 h in flowing helium (40 mL/min) to remove any physisorbed NH3, the samples were heated to 650 °C at a rate of 10 °C/min in helium flow (40 mL/min), and the desorbing products were recorded by a TCD detector. Nuclear magnetic resonance (NMR) spectra were recorded on a Bruker AVANCE III (500 MHz) NMR spectrometer operating at 130 MHz for 27Al measurements. The MAS NMR measurements were carried out using a 4 mm MAS probe head with a sample rotation rate of 5 kHz for 27Al measurements.
4.3. Catalytic Performance Test
The SSZ-13 samples were pressed into pellets, which were then crushed into 40–60 mesh. The catalyst was loaded in a stainless steel tubular fixed-bed reactor (diameter: 8 mm). The MTO reactions were evaluated at 350 °C under atmospheric pressure by pumping methanol into the preheater where it was gasified and mixed with N2 (120 mL/min). The reactions of light olefins were conducted at 350 °C under atmospheric pressure by inletting the mixture of light olefins (10 mL/min) and N2 (90 mL/min). The outlet effluent on heating was analyzed by GC (Agilent 7890B equipped with TCD, front FID, and back FID detectors with RT-Q-Bond, HP-INNOWAX, and Plot-Q columns). Methanol conversion is based on a constant inlet molar flow determined by the liquid methanol controlled by the advection pump and an outlet molar flow tested by GC. Dimethyl ether (DME) was considered as a reactant in the calculation of the conversion and selectivity.
4.4. Coke Species Analysis
Thermogravimetric analysis (TGA) was used to record the coke content and was conducted in the Netzsch STA 449 F3; 10–15 mg of the spent catalyst was heated in the air (10 mL/min) from 50 to 900 °C (ramp 10 °C/min). The coke species formed on the zeolites was extracted and analyzed by the Guisnet method.35 GC–MS was conducted using Agilent 7890A/5975C equipped with a FID and HP-5 column. Twenty milligrams of the spent catalyst was dissolved in 2 mL of HF (25% in water) for 15 min. The coke species was extracted into 1 mL of CH2Cl2 twice. One microliter of the solution was injected into a GC–MS. UV–vis spectra were recorded in the diffuse reflection mode on PerkinElmer Lambda950 equipped with an in situ reaction chamber (Harrick). Before the UV studies, 15 mg of the catalyst was placed in the chamber and heated to 350 °C under the Ar flow. After collecting the reference UV/vis spectra, methanol was fed into the chamber by the Ar flow (17.1 mL/min) through a saturator kept at 30 °C and the UV/vis spectra were recorded.
Acknowledgments
The authors acknowledge the China Postdoctoral Science Foundation (2017M611473) and the Fundamental Research Funds for the Central Universities (222201917013).
Supporting Information Available
The Supporting Information is available free of charge at https://pubs.acs.org/doi/10.1021/acsomega.0c03075.
Parts of the characterization and catalytic performance (PDF)
The authors declare no competing financial interest.
Supplementary Material
References
- Shi J.; Wang Y.; Yang W.; Tang Y.; Xie Z. Recent advances of pore system construction in zeolite-catalyzed chemical industry processes. Chem. Soc. Rev. 2015, 44, 8877–8903. 10.1039/C5CS00626K. [DOI] [PubMed] [Google Scholar]
- Tian P.; Wei Y.; Ye M.; Liu Z. Methanol to Olefins (MTO): From Fundamentals to Commercialization. ACS Catal. 2015, 5, 1922–1938. 10.1021/acscatal.5b00007. [DOI] [Google Scholar]
- Stöcker M. Methanol-to-hydrocarbons: catalytic materials and their behavior1. Microporous Mesoporous Mater. 1999, 29, 3–48. 10.1016/S1387-1811(98)00319-9. [DOI] [Google Scholar]
- Wilson S. T.; Lok B. M.; Messina C. A.; Cannan T. R.; Flanigen E. M. Aluminophosphate molecular sieves: a new class of microporous crystalline inorganic solids. J. Am. Chem. Soc. 1982, 104, 1146–1147. 10.1021/ja00368a062. [DOI] [Google Scholar]
- Li J.; Ma H.; Chen Y.; Xu Z.; Li C.; Ying W. Conversion of methanol to propylene over hierarchical HZSM-5: the effect of Al spatial distribution. Chem. Commun. 2018, 54, 6032–6035. 10.1039/C8CC02042F. [DOI] [PubMed] [Google Scholar]
- Sun C.; Du J.; Liu J.; Yang Y.; Ren N.; Shen W.; Xu H.; Tang Y. A facile route to synthesize endurable mesopore containing ZSM-5 catalyst for methanol to propylene reaction. Chem. Commun. 2010, 46, 2671. 10.1039/b925850g. [DOI] [PubMed] [Google Scholar]
- Bleken F. L.; Barbera K.; Bonino F.; Olsbye U.; Lillerud K. P.; Bordiga S.; Beato P.; Janssens T. V. W.; Svelle S. Catalyst deactivation by coke formation in microporous and desilicated zeolite H-ZSM-5 during the conversion of methanol to hydrocarbons. J. Catal. 2013, 307, 62–73. 10.1016/j.jcat.2013.07.004. [DOI] [Google Scholar]
- Dahl I. M.; Kolboe S. On the Reaction Mechanism for Hydrocarbon Formation from Methanol over SAPO-34: I. Isotopic Labeling Studies of the Co-Reaction of Ethene and Methanol. J. Catal. 1994, 149, 458–464. 10.1006/jcat.1994.1312. [DOI] [Google Scholar]
- Hereijgers B. P. C.; Bleken F.; Nilsen M. H.; Svelle S.; Lillerud K.-P.; Bjørgen M.; Weckhuysen B. M.; Olsbye U. Product shape selectivity dominates the Methanol-to-Olefins (MTO) reaction over H-SAPO-34 catalysts. J. Catal. 2009, 264, 77–87. 10.1016/j.jcat.2009.03.009. [DOI] [Google Scholar]
- Ji Y.; Deimund M. A.; Bhawe Y.; Davis M. E. Organic-Free Synthesis of CHA-Type Zeolite Catalysts for the Methanol-to-Olefins Reaction. ACS Catal. 2015, 5, 4456–4465. 10.1021/acscatal.5b00404. [DOI] [Google Scholar]
- Sun Q.; Wang N.; Bai R.; Chen X.; Yu J. Seeding induced nano-sized hierarchical SAPO-34 zeolites: cost-effective synthesis and superior MTO performance. J. Mater. Chem. A 2016, 4, 14978–14982. 10.1039/C6TA06613E. [DOI] [Google Scholar]
- Dai W.; Wu G.; Li L.; Guan N.; Hunger M. Mechanisms of the Deactivation of SAPO-34 Materials with Different Crystal Sizes Applied as MTO Catalysts. ACS Catal. 2013, 3, 588–596. 10.1021/cs400007v. [DOI] [Google Scholar]
- Yang G.; Wei Y.; Xu S.; Chen J.; Li J.; Liu Z.; Yu J.; Xu R. Nanosize-Enhanced Lifetime of SAPO-34 Catalysts in Methanol-to-Olefin Reactions. J. Phys. Chem. C 2013, 117, 8214–8222. 10.1021/jp312857p. [DOI] [Google Scholar]
- Peng C.; Liu Z.; Horimoto A.; Anand C.; Yamada H.; Ohara K.; Sukenaga S.; Ando M.; Shibata H.; Takewaki T.; Mukti R. R.; Okubo T.; Wakihara T. Preparation of nanosized SSZ-13 zeolite with enhanced hydrothermal stability by a two-stage synthetic method. Microporous Mesoporous Mater. 2018, 255, 192–199. 10.1016/j.micromeso.2017.07.042. [DOI] [Google Scholar]
- Xu Z.; Li J.; Huang Y.; Ma H.; Qian W.; Zhang H.; Ying W. Size control of SSZ-13 crystals with APAM and its influence on the coking behaviour during MTO reaction. Catal. Sci. Technol. 2019, 9, 2888–2897. 10.1039/C9CY00412B. [DOI] [Google Scholar]
- Ilias S.; Bhan A. Mechanism of the Catalytic Conversion of Methanol to Hydrocarbons. ACS Catal. 2013, 3, 18–31. 10.1021/cs3006583. [DOI] [Google Scholar]
- Wang C.-M.; Wang Y.-D.; Liu H.-X.; Xie Z.-K.; Liu Z.-P. Catalytic activity and selectivity of methylbenzenes in HSAPO-34 catalyst for the methanol-to-olefins conversion from first principles. J. Catal. 2010, 271, 386–391. 10.1016/j.jcat.2010.02.025. [DOI] [Google Scholar]
- Haw J. F.; Song W.; Marcus D. M.; Nicholas J. B. The Mechanism of Methanol to Hydrocarbon Catalysis. Acc. Chem. Res. 2003, 36, 317–326. 10.1021/ar020006o. [DOI] [PubMed] [Google Scholar]
- Borodina E.; Meirer F.; Lezcano-González I.; Mokhtar M.; Asiri A. M.; Al-Thabaiti S. A.; Basahel S. N.; Ruiz-Martinez J.; Weckhuysen B. M. Influence of the Reaction Temperature on the Nature of the Active and Deactivating Species during Methanol to Olefins Conversion over H-SSZ-13. ACS Catal. 2015, 5, 992–1003. 10.1021/cs501345g. [DOI] [PMC free article] [PubMed] [Google Scholar]
- Goetze J.; Meirer F.; Yarulina I.; Gascon J.; Kapteijn F.; Ruiz-Martinez J.; Weckhuysen B. M. Insights into the Activity and Deactivation of the Methanol-to-Olefins Process over Different Small-Pore Zeolites As Studied with Operando UV–vis Spectroscopy. ACS Catal. 2017, 7, 4033–4046. 10.1021/acscatal.6b03677. [DOI] [PMC free article] [PubMed] [Google Scholar]
- Hu B.; Mao G.; Wang D.; Fu Y.; Wang B.; Luo M. Conversion and coking of olefins on SAPO-34. Catal. Sci. Technol. 2017, 7, 5785–5794. 10.1039/C7CY01898C. [DOI] [Google Scholar]
- Müller S.; Liu Y.; Kirchberger F. M.; Tonigold M.; Sanchez-Sanchez M.; Lercher J. A. Hydrogen Transfer Pathways during Zeolite Catalyzed Methanol Conversion to Hydrocarbons. J. Am. Chem. Soc. 2016, 138, 15994–16003. 10.1021/jacs.6b09605. [DOI] [PubMed] [Google Scholar]
- Cundy C. S.; Cox P. A. The hydrothermal synthesis of zeolites: Precursors, intermediates and reaction mechanism. Microporous Mesoporous Mater. 2005, 82, 1–78. 10.1016/j.micromeso.2005.02.016. [DOI] [Google Scholar]
- Dokter W. H.; van Garderen H. F.; Beelen T. P. M.; van Santen R. A.; Bras W. Homogeneous versus Heterogeneous Zeolite Nucleation. Angew. Chem., Int. Ed. 1995, 34, 73–75. 10.1002/anie.199500731. [DOI] [Google Scholar]
- Davis M. E.; Lobo R. F. Zeolite and molecular sieve synthesis. Chem. Mater. 1992, 4, 756–768. 10.1021/cm00022a005. [DOI] [Google Scholar]
- Gabelica Z.; G. Derouane E.; Blom N. Synthesis and characterization of pentasil type zeolites: II. Structure-directing effect of the organic base or cation. Appl. Catal. 1983, 5, 109–117. 10.1016/0166-9834(83)80299-1. [DOI] [Google Scholar]
- Cundy C. S.; Cox P. A. The hydrothermal synthesis of zeolites: Precursors, intermediates and reaction mechanism. Microporous Mesoporous Mater. 2005, 82, 1–78. 10.1016/j.micromeso.2005.02.016. [DOI] [Google Scholar]
- Bjørgen M.; Bonino F.; Kolboe S.; Lillerud K.-P.; Zecchina A.; Bordiga S. Spectroscopic Evidence for a Persistent Benzenium Cation in Zeolite H-Beta. J. Am. Chem. Soc. 2003, 125, 15863–15868. 10.1021/ja037073d. [DOI] [PubMed] [Google Scholar]
- Wulfers M. J.; Jentoft F. C. Identification of carbonaceous deposits formed on H-mordenite during alkane isomerization. J. Catal. 2013, 307, 204–213. 10.1016/j.jcat.2013.07.011. [DOI] [Google Scholar]
- Kiricsi I.; Förster H.; Tasi G.; Nagy J. B. Generation, Characterization, and Transformations of Unsaturated Carbenium Ions in Zeolites. Chem. Rev. 1999, 99, 2085–2114. 10.1021/cr9600767. [DOI] [PubMed] [Google Scholar]
- Kiricsi I.; Förster H. Chemisorption of propene on HZSM-5 by ultraviolet and infrared spectroscopy. J. Chem. Soc., Faraday Trans. 1 1988, 84, 491–499. 10.1039/f19888400491. [DOI] [Google Scholar]
- Van Speybroeck V.; Hemelsoet K.; De Wispelaere K.; Qian Q.; Van der Mynsbrugge J.; De Sterck B.; Weckhuysen B. M.; Waroquier M. Mechanistic Studies on Chabazite-Type Methanol-to-Olefin Catalysts: Insights from Time-Resolved UV/Vis Microspectroscopy Combined with Theoretical Simulations. ChemCatChem 2013, 5, 173–184. 10.1002/cctc.201200580. [DOI] [Google Scholar]
- Hemelsoet K.; Qian Q.; De Meyer T.; De Wispelaere K.; De Sterck B.; Weckhuysen B. M.; Waroquier M.; Van Speybroeck V. Identification of Intermediates in Zeolite-Catalyzed Reactions by In Situ UV/Vis Microspectroscopy and a Complementary Set of Molecular Simulations. Chem. – Eur. J. 2013, 19, 16595–16606. 10.1002/chem.201301965. [DOI] [PubMed] [Google Scholar]
- Huang Y.; Ma H.; Xu Z.; Qian W.; Zhang H.; Ying W. Role of nanosized sheet-like SAPO-34 in bifunctional catalyst for syngas-to-olefins reaction. Fuel 2020, 273, 117771 10.1016/j.fuel.2020.117771. [DOI] [Google Scholar]
- Guisnet M. “Coke” molecules trapped in the micropores of zeolites as active species in hydrocarbon transformations. J. Mol. Catal. A 2002, 182–183, 367–382. 10.1016/S1381-1169(01)00511-8. [DOI] [Google Scholar]
Associated Data
This section collects any data citations, data availability statements, or supplementary materials included in this article.