

Abstract
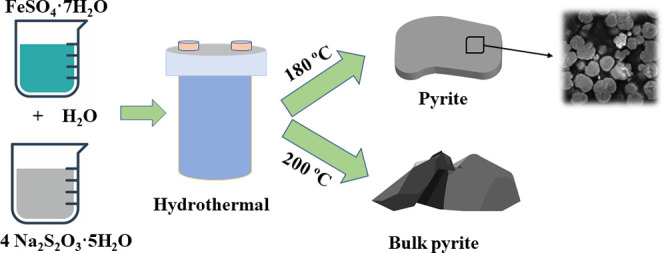
A simple one-step hydrothermal method was developed to synthesize pyrite (FeS2) sheet- and bulklike pyrite mineral. The Fe/S molar ratio determines the phase of FeS2, including pyrite and marcasite. The reaction temperature and time are key factors to regulate the structure, morphology, and size of pyrite. Scanning electron and transmission electron microscopy showed the formation of monodisperse microspherulite within 1 h reaction time, and the particles aggregated to large irregular polyhedron particles with increasing reaction time up to 4 h. Electrochemical oxidation tests demonstrated that their electrochemical activity significantly decreased with increasing synthesis time. At an elevated temperature of 200 °C, bulk pyrite was obtained after a 24 h reaction time, which could have promising applications in hydrothermal pyrite ore oxidation research.
1. Introduction
Pyrite (FeS2), the most abundant sulfide mineral in the earth’s crust, is a semiconductor mineral commonly associated with metal (Au, Cu) and coal deposits. Pyrite is a major source of acid mine drainage (AMD), which causes serious environmental issues at mining sites worldwide,1−4 especially given that pyrite-bearing ore is an important host for toxic elements like arsenic, cadmium, cobalt, chromium, and mercury.5,6 Due to its low fabrication cost and high electric power conversion efficiencies,7 pyrite has become a promising semiconductor material for photovoltaic solar cells, which directly convert solar energy into electricity. Other novel applications of pyrite include cathode materials for lithium-ion batteries8 and catalysts for clean energy H2 production.9 Pyrite oxidation also attracts research attention because pretreatment of refractory gold-bearing pyrite ore is essential to improving gold leaching efficiency.10−12
These environmental concerns and the broad suite of potential applications have led to an interest in pyrite properties. For instance, pyrite oxidation kinetics is of utmost importance in AMD. Oxidation rates differ for pyrite originating from different locations,13 which has been attributed to trace and minor elements in natural pyrite that change the semiconducting properties and hence the conductivity and surface states of pyrite.8−14 In addition, the semiconducting properties of pyrite have been linked to the precise composition (purity elements) of the pyrite sample.15
Various methods to enhance the performance of pyrite have been extensively studied. For instance, cobalt doping can improve visible light absorption, leading to better photocatalytic performance.16 However, the effects of impurities, which are commonly found in natural pyrite, on pyrite oxidation are poorly understood. Synthesizing pyrite and then doping it with a single element is a simple and low-cost approach to study the effect of an impurity on pyrite oxidation. However, the synthetic pyrite should be similar to natural pyrite, that is, it should be bulk pyrite or have a large particle size, vs the pyrite nanoparticles often presented in the material science research.
Among the available methods to synthesize pyrite (e.g., electrodeposition,17 chemical bath deposition,18 chemical vapor deposition, thermal sulfurization,19 and hydrothermal methods20−27), hydrothermal methods are the most simple and cost-effective. They are most suitable for production of bulk pyrite with a uniform structure, which is applicable for AMD and hydrometallurgical research. However, two drawbacks to the hydrothermal methods are: (1) the synthetic pyrite has various mineral shapes, which can limit its applicability; and (2) elemental sulfur forms as a byproduct.25,28 For example, marcasite is FeS2 that has a similar lattice structure to pyrite. Although the pyrite cubic lattice structure is composed of a center-facing Fe atom, octahedrally coordinated by six S atoms24 (Figure 1a), marcasite consists of linear chains of edge-sharing S22– octahedra29 (Figure 1b). Compared to pyrite, marcasite has a much smaller band gap (0.34 eV), which is believed to impede the photovoltage performance when marcasite is mixed with pyrite.30 Pyrite is more inert to oxidation than marcasite.31
Figure 1.
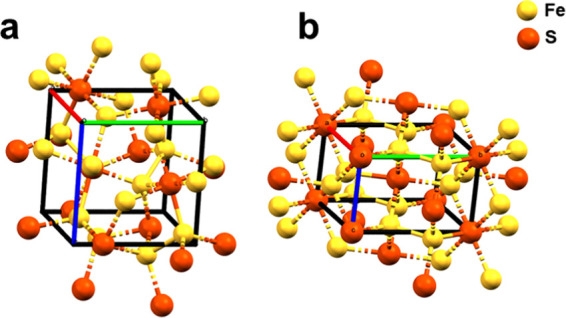
Crystal structures of FeS2: (a) pyrite and (b) marcasite.
Carbon disulfide (CS2)—by far the most efficient sulfur solvent—has been widely used to remove sulfur from pyrite through solvent extraction; it exhibits a sulfur solubility of 35.5 g in 100 g CS2 at 25 °C.32 However, CS2 is highly neurotoxic.33 Toluene is far less toxic than CS2, and sulfur is highly soluble in hot toluene (11.56 g in 100 g toluene at 80 °C34).
This study develops a novel, one-step, hydrothermal process to synthesize pyrite as monodisperse microspherulites and large irregular polyhedron particles. Knowing that sulfur solubility in organic solvents increases with temperature,34 we also developed a process to use toluene, as an alternative of the common use of CS2, for elemental sulfur removal from synthetic pyrite at elevated temperature. The reaction occurs in aqueous solution with inorganic Fe and S sources, and no surfactant is used. Electrochemical tests were conducted to measure the oxidation rates and semiconducting properties of pyrite synthesized over different time periods, which provides insights on the leaching behavior of hydrothermally formed natural pyrite.
2. Results
2.1. Effect of Fe/S Molar Ratio on Pyrite Synthesis
X-ray diffraction (XRD) patterns of the impure synthetic pyrite at a Fe/S ratio of 1:4 (Figure 2a) confirm the formation of elemental sulfur (PDF #08-0247) and pyrite (PDF #42-1340). The application of toluene as an alternative to CS2 for sulfur removal was very effective: It completely removed the sulfur from the final products. After sulfur removal, no peaks of elemental sulfur were detected in the XRD patterns (Figure 2b).
Figure 2.

X-ray diffraction patterns of pyrite synthesized at 180 °C for 4 h: (a) before (Fe/S = 1:4) and (b) after sulfur removal for three Fe/S ratios.
When Fe/S was 1:1, high-intensity peaks of marcasite (PDF #37-0475) were found (Figure 2b). Increasing the source S concentration (Fe/S = 1:2) significantly decreased the intensities of the character peaks of marcasite. The effect of the molar ratio of Fe/S has been affirmed in determining the iron sulfide phase. In the following tests in this study, the molar ratio Fe/S of 1:4 was used to fabricate pure pyrite. All subsequent experiments used pure-phase pyrite after purification.
2.2. Effect of Reaction Time on Pyrite Synthesis
XRD peaks of pyrite products from 1, 2, and 4 h of synthesis (Figure 3a) correspond to a pyrite crystal structure (JCPDS No. 42-1340). No impurity peaks were detected. Particle size increased with reaction time (Figure 3b): Mean particle sizes were 32, 60, and 108 μm for pyrite produced in 1, 2, and 4 h, respectively. This suggests a possible aggregation-based mechanism. Pyrite synthesized in 1 h had the narrowest particle size distribution, whereas pyrite synthesized in 2 h had two recognizable fractions: 40–80 and 80–150 μm (Figure 3b).
Figure 3.

(a) X-ray diffraction patterns and (b) particle size distribution of synthetic pyrite reacting for 1, 2, and 4 h at 180 °C; (c) thermogravimetric curves for synthetic pyrite reacting for 1, 2, and 4 h and for natural pyrite up to 800 °C.
All of the synthetic and natural pyrite only started to lose weight from about 180 °C (Figure 3c). In the first stage (180–600 °C), the pyrolysis of pyrite progressed35
| 1 |
According to the reaction, pyrrhotite and sulfur could be produced during pyrolysis. Compared to natural pyrite, synthetic pyrite tends to lose sulfur more easily in this temperature range. Both natural and synthetic pyrite began to severely decompose at 600 °C (Figure 3c). The reaction of this second stage can be written as35
| 2 |
Natural pyrite lost 22.5% of the initial sample weight at 800 °C, vs approximately 27% for the three synthetic pyrites (Figure 3c). The pyrite synthesized in 2 and 4 h has a slightly higher thermal resistance than the pyrite synthesized in 1 h.
Pyrite synthesized in 1 h showed several microspheres (Figure 4a), some well dispersed and others are in the process of merging into larger amorphous particles. The particle size of this pyrite is 2–10 μm (Figure 4a). By comparison, pyrite particles synthesized over 4 h had irregular shapes (Figure 4b), which is likely due to intensive aggregation with increasing reaction time. Scanning electron microscopy (SEM) images of whole particles showed discernible agglomeration of particles into spherical and polyhedral shapes for pyrite synthesized over 1 h (Figure 4c) and 4 h (Figure 4d), respectively.
Figure 4.
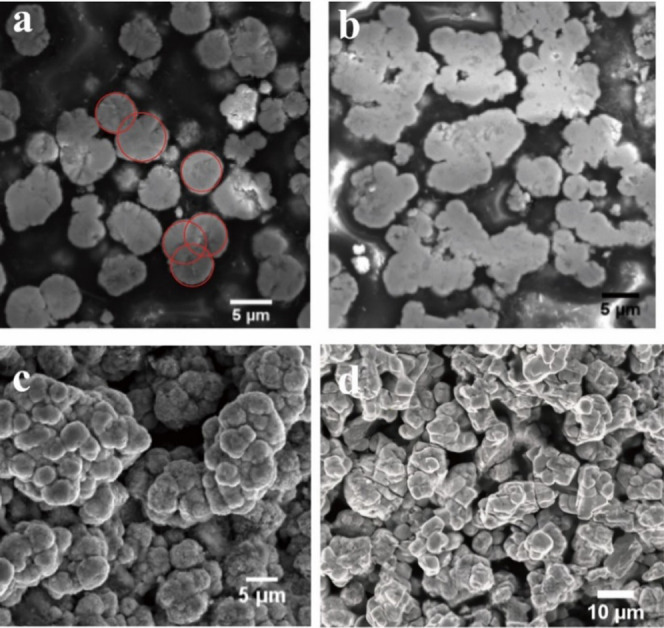
Cross-sectional (a, b) and whole-particle (c, d) SEM images of pyrite synthesized over 1 h (a, c) and 4 h (b, d) at 180 °C.
A high-magnification transmission electron microscopy (TEM) image of pyrite synthesized in 4 h shows several small, irregularly shaped nanoparticles, some assembled into larger irregular polyhedral particles (Figure 5a). The fringe spacing value was determined to be 0.271 nm (Figure 5b), corresponding to a lattice spacing of (200) plane of pyrite (JCPDS #042-1340). The selected-area electron diffraction pattern displays (2 2 0), (2 0 1), and (2 0 0) planes indexed for pyrite diffraction patterns (Figure 5c).36 The bright and clearly observed spots in the pattern reveal the highly crystallized polyhedron.
Figure 5.

Pyrite nanoparticles synthesized over 4 h: (a) high-magnification TEM image, (b) high-resolution TEM image, and (c) selected-area electron diffraction pattern.
2.3. Electrochemical Study
Pyrite oxidation is essentially an electrochemical process; the oxidation rate is influenced by the electrical conductivity.37 The conductivity of the pyrite synthesized in 4 h initially increased with applied pressure and became stable after approximately 310 kPa (Figure 6). At this pressure, the conductivities of pyrite synthesized in 1, 2, and 4 h were 3.85, 12.5, and 14.3 S/cm. These results agree with other work showing that increasing grain size—or decreasing grain boundary—and increasing crystallinity significantly reduced the resistivity of polycrystalline semiconductor films.38
Figure 6.
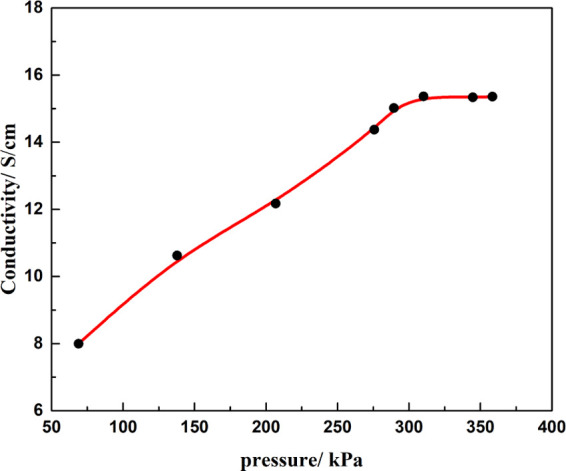
Conductivity of pyrite synthesized in 4 h vs applied pressure.
The electrochemical oxidation behavior for pyrite synthesized for the three reaction times was evaluated in terms of the relationship between the logarithm of current density and applied potential (Figure 7). The exchange current density (i0)—a measure of electrochemical activity—was highest for pyrite synthesized in 1 h and lowest for pyrite synthesized in 4 h (Table 1). These data suggest that the relatively small particle size (Figure 7) and thus a large surface area-to-volume ratio of pyrite synthesized in 1 h are the mechanisms behind the high electrochemical activity.
Figure 7.
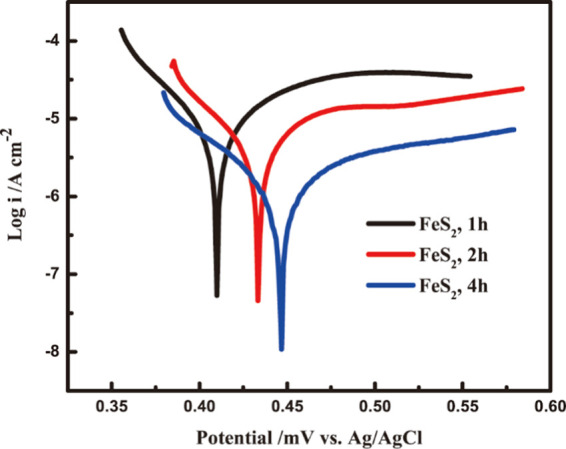
Tafel plots for the synthetic pyrite oxidation in 0.5 M sulfuric acid solutions.
Table 1. Kinetics Parameters Determined by Tafel Analysis.
| pyrite synthesis time (h) | i0 (10–6 A/cm2) | E0 (V) | αa | αc | n |
|---|---|---|---|---|---|
| 1 | 9.12 | 0.40 | 0.17 | 0.78 | 0.95 |
| 2 | 5.62 | 0.42 | 0.33 | 0.59 | 0.92 |
| 4 | 1.58 | 0.44 | 0.44 | 0.51 | 0.96 |
To further analyze the semiconductor properties of the synthetic pyrite, Mott–Schottky tests were conducted. Mott–Schottky curves for the three pyrite samples have two distinct linear regions before and after 0.6 V (Figure 10). A similar phenomenon has been reported for n-type semiconductors with a depletion region.39 The positive slope at a potential less than 0.6 V could be explained by the pseudo-passive behavior of pyrite in sulfuric acid solution. At potentials above 0.6 V, reaction 3 generated new products and changed the surface properties.40 Clearly, synthesis time, especially longer than 2 h, affected the semiconducting properties (Figure 8), which could subsequently affect the electrochemical oxidation behavior.
| 3 |
Figure 10.

XPS spectra of sheetlike pyrite synthesized at 180 °C for 24 h and bulk pyrite synthesized at 200 °C for 24 h: Fe 2p spectra of (a) sheetlike pyrite and (b) bulk pyrite; S 2p spectra of (c) sheetlike pyrite and (d) bulk pyrite; (e) S species distribution of sheetlike pyrite and bulk pyrite.
Figure 8.

Mott–Schottky plots for pyrite (a) synthesized over 1, 2, and 4 h and (b) synthesized over 1 and 2 h (expanded y axis).
2.4. Synthesis of Bulk Pyrite
The results above show that synthetic pyrite has a strong tendency to aggregate with extended synthesis time. Temperature also plays a key role in morphological control in the hydrothermal reaction.23 At 180 °C, the products displayed a laminar, sheetlike structure that was thicker at longer reaction times (Figure 9, top). At 200 °C, the pyrite synthesized in 4 h comprised a rough layer; at 12 h, the pyrite was “chunkier”, and at 24 h, the pyrite was aggregated into large chunks with a smooth surface (Figure 9, bottom). The surface of the bulk pyrite had several pits, possibly due to the evaporation of elemental sulfur on the surface at high temperatures and pressures. The SEM graph for the pyrite synthesized at 180 °C at 24 h still showed the aggregation of spherical particles into larger unshaped particles, while pyrite synthesis at 200 °C showed complete irregular particle shape with a larger size range from several to 50 μm.
Figure 9.
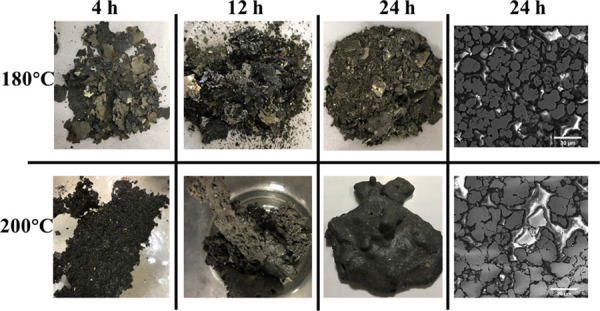
Macroscopic and microscopic morphologies of pyrite synthesized at 180 and 200 °C for 4, 12, and 24 h.
In the Fe 2p spectra, the highest-intensity peak at 701.1 eV is FeS241 (Figure 10a). A peak at 711.5 eV in bulk pyrite (Figure 10b), which has not been previously observed, is ferric oxide. The peaks differ because sheetlike pyrite has a more active surface to host ferrous oxidation. S 2p peaks usually give rise to doublets of S 2p3/2 and S 2p1/2 owing to spin–orbit splitting.42 For clarity, the S 2p spectra only present S 2p3/2 peaks of fitted curves in Figure 10c,d. The peaks of S 2p at 162.5, 163.4, and 168.5 eV correspond to sulfide, polysulfide, and sulfate, respectively.43 The percentage of polysulfides was higher in bulk pyrite (16.91%) than in sheetlike pyrite (7.64%; Figure 10e). On the other hand, the percentage of sulfate was higher for sheetlike pyrite (25.70%) than for bulk pyrite (11.46%), which suggests different degrees of oxidation and a possible two-step oxidation mechanism.
3. Discussion
3.1. Pyrite Synthesis and Characterization
To preferentially control the morphology and purity of the pyrite as a functional material, organic Fe and S sources were normally used. However, the raw material can be costly, and the synthesis condition is not suitable for large-scale production, especially for hydrometallurgical and geochemical research. In this study, inexpensive inorganic iron and sulfur sources, FeSO4 and Na2SO3, were used to synthesize pyrite via a one-step hydrothermal method.
Pyrite was synthesized at different molar ratios of Fe/S sources, 1:1, 1:2, and 1:4, at 180 °C for 4 h. The XRD analysis (Figure 4) proved the Fe/S molar ratio acted as a vital factor for the iron sulfide phase in the products. The identification of marcasite was detected for the products at Fe/S ratios of 1:1 and 1:2 (Figure 4b), and the intensity peaks for marcasite reduced sharply for the Fe/S ratio of 1:2. For the Fe/S ratio of 1:4, the peak intensity of the marcasite phase disappeared completely, leaving pyrite as the only iron sulfide phase together with elemental sulfur (Figure 4a). The probable reaction happened as
| 4 |
To separate the pyrite from the pyrite-sulfur mix and recycle the elemental sulfur, the toluene solvothermal method was designed to dissolve the elemental sulfur and obtain pure-phase pyrite. Conventional sulfur purification methods include the annealing process44 or the organic solvent extraction method.45 A post-annealing process at high temperatures has high energy consumption and consequently modifies the original characters of the products. Organic solvents such as CS2, p-xylene, chlorobenzene, and cyclohexane can be used as a sulfur solvent solution,34 with CS2 showing the highest sulfur solubility. Toluene has a high solubility to sulfur at a higher temperature (11.6/100 g at 80 °C), and its toxicity is much lower than CS2. Thus, toluene was determined to have the potential to replace the common use of CS2. On the other hand, the dissolving sulfur in the saturated toluene solution would remarkably reduce to 2.0/100 g at 25 °C. The variation solubilities with temperature make it possible to further separate sulfur from the toluene solution. After the purification process, the toluene solution can be recycled. Figure 4a shows the sulfur has been completely removed using toluene as a sulfur-dissolving agent, leaving pure-phase pyrite as the final product.
While the Fe/S ratios decided the iron sulfide phases, the reaction time significantly affects the thermal stability, particle size, and morphology of synthetic pyrite. The thermogravimetric analysis (TGA) curves in Figure 5c illustrate two stages of weight loss for 1 h, 2 h, and 4 h synthetic pyrite. According to reactions 1 and 2, in the whole heating process from 30 to 800 °C, the synthetic pyrite first decomposed to pyrrhotite (FeS1–x, 0 < x <0.125) and eventually troilite (FeS). The theoretical weight loss from pyrite to troilite is 26.7%, which is consistent with the weight loss of 4 h synthetic pyrite, 26.2% in Figure 5c. The weight losses of 1 h and 2 h synthetic pyrite were 25.5 and 26.2%, respectively. Increasing the reaction time marginally improved the thermal stability of synthetic pyrite.46 The decomposition process comparing to natural pyrite showed more weight loss for synthetic pyrite than for natural pyrite. This may be attributed to the much smaller specific surface area of natural pyrite due to extensive aggregation during its formation in the crust.47 The larger surface area of synthetic pyrite48 has more exposed nanoparticles to release gaseous sulfur during the pyrolysis.
Morphology control of pyrite synthesis is essential due to its multiple application as a functional material. Although adding surfactants (e.g., ethylene glycol, polyvinylpyrrolidone, and Triton X-100) can effectively control the morphology of the synthetic pyrite, they can introduce impurities to and alter the conductivity of the product.36,49,50 To better illustrate the relationship between the electrical properties and dissolution behavior for hydrothermal formed pyrite, no surfactant was used in the current study. The effect of reaction on the morphology was studied for 1, 2, and 4 h synthetic pyrite. The 1-h pyrite SEM image shows well-dispersed microspheres distributed irregularly on the mineral surface (Figure 6a,c), similar to the pyrite synthesized using ethylene glycol as a surfactant for 12 h.51 The monodisperse microsphere structure has been approved to have great electrochemical performance as an electrode in solar cells52 and anode for battery material.52 Thus, employing the hydrothermal method at a reaction time of 1 h or less, without surfactant, permitted control of the morphology of the pyrite products. On further increasing the reaction time, irregular morphology due to significant aggregation was observed on 4 h synthetic pyrite (Figure 6b,d). The significant aggregation also leads to the increasing particle size with reaction time, as shown in Figure 5b.
3.2. Electrochemical Properties of Synthetic Pyrite
The electrical properties of pyrite are essential to be investigated with regard to their functional material fabrication. However, the fact that is often neglected is that the electrical properties also relate to pyrite dissolution behavior given pyrite has long been recognized as a semiconducting mineral. The dissolution of pyrite can be treated as an electrochemical process in which electrons transfer from sulfur atoms at the anodic site to the oxidants (Fe3+, dissolved oxygen) on the cathodic sites.53 The charge transfer process is inevitably affected by the electrical properties of pyrite. Lehner et al.37 found that variations in conductivity could play a role in charge transfer kinetics. A recent electrochemical study of n-type pyrite oxidation suggested that the rate-limiting step is the ferrous oxidation on the pyrite surface,13 which links to the n-type semiconducting property. Anyhow, the definite correlations between the electrical properties of pyrite and the chemical and electrochemical reactivity of the mineral are still unclear. Here in this study, the inner link between the pyrite dissolution kinetics and its electrical properties (conductivity and semiconducting properties) were explored.
The dissolution kinetics was analyzed via the Tafel analysis method. A novel method was applied to measure the conductivity of synthetic pyrite (Figure 3). Characterizing the semiconductor properties using Mott–Schottky plots has been conducted with pyrite in sulfuric acid solution. Pyrites synthesized for 1, 2, and 4 h were used as raw materials; the results can be instructive for pyrite hydrothermal ore oxidation in nature.
Previous research demonstrated that the pyrite in nature has a wide conductivity range between 0.002 and 50 S/cm, which was presumably related to the trace element composition.15 Generally, the n-type pyrite has higher conductivity than p-type pyrite. The conductivity measurement results showed the pyrite samples have a relatively high conductivity range between 3 and 15 S/cm. With increasing reaction time, the conductivities of pyrite increased. The trend of conductivity change could be the strengthening of interfacial bonding after a longer reaction time.54
The linear sweep voltammetric (LSV) measurement was conducted on 3 pyrite samples in a 0.5 M sulfuric acid solution in a potential range from −0.1 V vs OCP to 0.1 V vs OCP. The polarization behavior and kinetics parameters after Tafel analysis are presented in Figure 9 and Table 1. The i0 decreased with reaction time for pyrite, from 9.12 × 10⁻⁶ to 1.58 × 10⁻⁶ A/cm2 for 4-h pyrite, which suggests a decreasing dissolution rate for pyrite synthesized for a longer time. The equilibrium potential (E0) increased with synthesis time (Table 1), from 0.40 V for 1-h pyrite to 0.44 V for 4-h pyrite. When oxidants such as Fe3+ are present in the electrolyte, the pyrite with a smaller E0 tends to dissolve faster since the reaction driving force is the potential difference between the oxidant and the pyrite.15 The anodic charge transfer coefficient (αa) increased with reaction time whereas the cathodic charge transfer coefficient (αc) decreased (Table 1). The sums of anodic and cathodic charge transfer coefficients (n) approached 1, which suggests a single electron transfer reaction on the surface of the pyrite electrode.55 The much smaller anodic than cathodic transfer coefficients indicates an n-type semiconductor property.56
Moreover, the Mott–Schottky analysis was applied to validate the semiconductor properties for the pyrite–sulfuric acid solution interface. The Mott–Schottky plots were acquired by the eq 5
| 5 |
where ε is the dielectric constant, ε0 the permittivity of free space, e the charge of an electron, N the donor density, E the applied potential, Efb the flat band potential, k the Boltzmann constant, and T the absolute temperature. As shown in Figure 10, the Mott–Schottky plot of synthetic pyrite samples shows typical n-type semiconductor properties, where the Mott–Schottky plot has a positive slope,57 until the break potential of about 0.6 V. In the first potential range (from OCP to 0.6 V), pyrite was oxidized and a passive film was formed (reaction 6).
| 6 |
In the above equation, the S0 refers to a sulfur-rich layer, though the composition of the layer is still under debate.58 The positive slopes in the potential range and low anodic charge transfer coefficients both confirm the sulfur-rich film on pyrite has n-type semiconducting properties. At potentials greater than the break potential, into the second stage of pyrite oxidation, negative slope lines for the Mott–Schottky plot were observed due to the reaction
| 7 |
The abrupt change originates from the deterioration of the passive film. The dissolution of elemental sulfur accumulates mobile holes on the pyrite surface and thus changes the semiconductor properties. It was also noticed that the slope increased with synthetic time for pyrite. According to the Mott–Schottky equation (eq 5), the higher the slope, the lower the Nd. It seems the donor density decreases with reaction time for pyrite. The higher donor density for 1-h pyrite could result in an enhanced corrosion rate and thus a higher dissolution rate.
3.3. Synthesis of Bulk Pyrite Material
From the above discussion, the morphology of pyrite is likely controlled by the reaction time-dependent aggregation behavior in 4 h. Under the same experimental conditions (Fe/S ratio of 1:4, 180 °C), and with further extension of the reaction time to 12 and 24 h, it was observed that the pyrite sheet became thicker and coarser (Figure 11). Increasing the reaction temperature to 200 °C and for reaction times of 4, 12, and 24 h, with more aggressive aggregation, a rode shape of pyrite and lump pyrite with several cm depths were formed at 12 and 24 h, respectively (Figure 11). Exploration of the bulk formation process can be significant for further research on the hydrothermal formation of pyrite in nature. Besides, bulk pyrite as a working electrode is ideal for pyrite electrochemical study. Pure-phase pyrite is desired when studying the mechanism of pyrite dissolution via electrochemical methods, considering the impurities in pyrite, such as As, Co, and Ni, can largely alter its electrical and electrochemical properties.14 Previous research used the pyrite-carbon paste electrode (PCPE)59 or slurry coating method60 to fabricate the pyrite working electrode. However, these techniques exhibit several disadvantages, like weaker fabrication reproducibility and mechanical stability compared with the bare solid electrodes.61 This bulk mineral, which has not been shown in previous research, is of particular interest in metallurgy and environmental engineering and will be the subject of related work in the future.
Figure 11.

Schematic diagram of hydrothermal synthesis, purification, characterization, and conductivity and electrochemical testing of synthetic pyrite.
4. Conclusions
This paper describes a cost-effective, easy-to-operate, low-temperature, and nontoxic hydrothermal method to synthesize pyrite. After purification using a hot toluene solution to dissolve sulfur, phase-pure pyrite can be produced. At a Fe/S molar ratio of 1:4, the synthetic FeS2 phase contains pyrite only: no marcasite was found. The synthetic pyrite at 180 °C exhibits a sheet shape, and the layer becomes thicker with increasing reaction time from 1 to 4 h. With increasing reaction time, the conductivity of the pyrite increased and the electrochemical activity decreased, likely due to drastic aggregation and enlargement of particle size with longer reaction times. Increasing the reaction temperature to 200 °C and reaction time to 24 h yielded bulk pyrite. This study provides a simple process to produce not only pyrite nanoparticles with a spherical shape without the use of surfactants but also bulk pyrite, which can be used to study the leaching or electrochemical behavior of phase-pure synthetic pyrite similar to pyrite mineral in nature.
5. Materials and Methods
5.1. Pyrite Synthesis
The reagents used for pyrite synthesis were iron sulfate heptahydrate (FeSO4·7H2O, Anachemica), sodium thiosulfate pentahydrate (Na2S2O3·5H2O, Fisher Scientific), and deionized (DI) water. The main reactor was a 2 L stainless steel autoclave (4572 Pressure Reaction system, Parr Instrument Company) equipped with a temperature and mixing controller. To avoid corrosion from the reaction, a customized glass liner was installed within the reactor.
To synthesize pyrite particles, the molar ratios of Fe/S sources were 1:1, 1:2, and 1:4, respectively. Iron sulfate heptahydrate (0.16 mol, 44.48 g) and sodium thiosulfate pentahydrate (0.16, 0.32, and 0.64 mol or 39.71, 79.42, and 158.84 g) were dissolved in 800 mL of DI water and transferred to the reactor (Figure 11). The solution pH without adjustment was determined to be 4.5. Synthesis reactions were run at 180 °C, 400 rpm mixing rate, and 1, 2, and 4 h reaction times to investigate the formation mechanism of pyrite. Bulk pyrite synthesis was attempted at 180 and 200 °C for 4, 12, and 24 h. After the reaction was complete, the pH of the solutions decreased to approximately 0.4. The solid products were cooled to room temperature, filtered with DI water several times, and dried at 40 °C in an oven.
Because the hydrothermal reaction produces macroscopic elemental sulfur, a purification step is required. The dry products were subjected to grinding in an agate mortar and transferred to a beaker containing 100 mL of toluene (Figure 11). The toluene solution was heated to near boiling (110 °C) for 2 min; then, vacuum filtration (particle retention: >11 μm) was used to separate the sulfur-rich solution and sulfur-free solid product (pure pyrite). The synthetic pyrite was washed three times with reagent-grade ethanol and DI water and dried in a vacuum oven at 40 °C for 6 h. The toluene solution was cooled to room temperature to permit spontaneous precipitation of elemental sulfur, followed by vacuum filtration (particle retention: >11 μm) to obtain pure elemental sulfur. The toluene solution could then be reused.
5.2. Characterization
The solid products before and after the purification process were characterized by X-ray powder diffraction (XRD) using an X’Pert Pro Philips powder diffractometer. X-ray photoelectron spectroscopy (XPS; VG ESCALAB-3MKll XPS) was also conducted to study the Fe, S, and O species in the products. The XPS instrument was equipped with an Al Kα source, 300 W (15 kV, 20 mA), and the binding energy calibration was based on C 1s at 284.4 eV.
The morphology (cross-sectional and whole-particle) of the synthetic pyrite was analyzed with an FEI NovaSEM scanning electron microscope (SEM). To obtain a cross-sectional view, samples were embedded in epoxy resin and ground using 1200-grit silicon carbide paper to expose the cross sections and polished by 1 μm diamond paste. An aberration-corrected FEI Titan scanning transmission electron microscope (TEM), operating at an accelerating voltage of 200 kV in TEM mode, was used to produce high-resolution TEM images to investigate the microstructure and measure the particle size of the products. To investigate the thermal stability of synthetic pyrite, thermogravimetric analysis (TGA) was carried out in closed alumina crucibles on a Netzsch STA449 F3 Jupiter apparatus at a heating rate of 5 K/min and a N2 flow rate of 40 mL/min. The rough particle size of the samples was analyzed by a laser particle size analyzer.
5.3. Electrochemical Measurements
The conductivity of the synthetic pyrite was investigated using equipment designed to measure the conductivity of iridium catalyst powder.62 The pyrite powder (approximately 0.1 g) is compressed with N2 gas between a pair of brass pistons located in an acrylic cylinder to create constant electrical contact between minerals (Figure 12); then, the resistivity can be directly measured by a multimeter. Initially, the resistivity is related to the applied pressure, until it reaches a stable value when the powder is highly compact. The compressed pyrite powder had 3 mm diameter and the height of the compressed pyrite powder was recorded. The powder conductivity or resistivity was calculated by
| 8 |
where σ is the conductivity (Siemens/cm), ρ is the resistivity (Ω cm), Rp is the electrical resistance (Ω) of the compressed powder obtained from the multimeter, l is the height of the compressed powder minerals, and A is the surface area (cm2) of the compressed mineral column.
Figure 12.
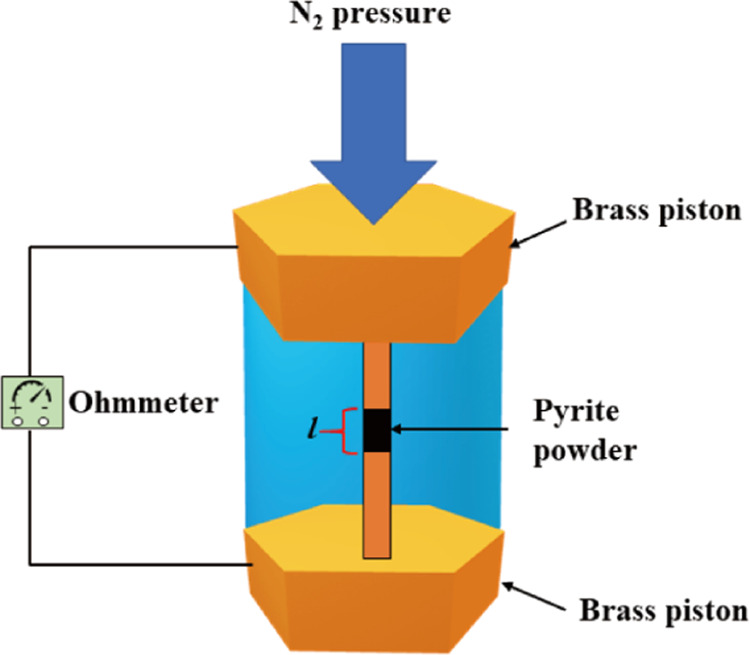
Experimental device used to measure the conductivity of pyrite (reprinted in part with permission from ref (62)).
Pyrite oxidation behavior relative to synthesis time was studied by a series of electrochemical tests on a fabricated (see ref (63) for details) pyrite-carbon paste electrode (PCPE). This working electrode had an active area of 0.2 cm2. A graphite rod was the counter electrode, and an Ag/AgCl electrode with a 3 M KCl internal solution acted as a reference electrode. All potentials in this paper are vs the Ag/AgCl reference electrode. Before each test, the working electrode was loaded with fresh paste, polished, and then immersed in the electrolyte, a 0.5 M sulfuric acid solution. The electrochemical experiment only began when the working electrode reached a stable open circuit potential (OCP) in the electrolyte. The polarization potential was measured on a GSTAT302N potentiostat (Metrohm) from 0.3 to 0.9 V and a frequency of 1 kHz. The electrochemical results were analyzed by Nova software (Version 2.3).
Tafel analysis by linear sweep voltammetry (LSV) was implemented to determine the PCPE oxidation rates. LSV tests were conducted in the potential range from −0.1 V vs OCP to +0.1 V vs OCP at a 1 mV/s scan rate. Important kinetic constants were calculated according to Tafel equation and anodic and cathodic Tafel equations, respectively, as follows:55
| 9 |
| 10 |
| 11 |
such as i0 (exchange current density), E0 (equilibrium potential), anodic transfer coefficient (αa), and cathodic transfer coefficient (αc). For other parameters, α is the transfer coefficient, f = F/RT, η is the overpotential (E – Ecorr), iA is the anodic current density, and iC is the cathodic current density.
Mott–Schottky tests were run to evaluate the semiconductor properties of the synthetic pyrite. The Mott–Schottky plots show the relationship between the applied potential and measured capacitance on the electrode–electrolyte interface.64 The frequency was set at 1 kHz, and the potential range was chosen between 0.3 and 0.9 V.
Acknowledgments
The authors acknowledge the financial support of the Natural Sciences and Engineering Research Council of Canada (NSERC) and Barrick Gold Corp for funding this project through the Collaborative Research and Development Grant program (CRDPJ 469802-14). The study benefited from the use of electron microscopy at the RMTL facility of Queen’s University, constructed with funding from CFI/ORF.
The authors declare no competing financial interest.
References
- Evangelou V. P.; Zhang Y. L. A review: pyrite oxidation mechanisms and acid mine drainage prevention. Crit. Rev. Environ. Sci. Technol. 1995, 25, 141–199. 10.1080/10643389509388477. [DOI] [Google Scholar]
- Bonnissel-Gissinger P.; Alnot M.; Ehrhardt J. J.; Behra P. Surface oxidation of pyrite as a function of pH. Environ. Sci. Technol. 1998, 32, 2839–2845. 10.1021/es980213c. [DOI] [Google Scholar]
- Tabelin C. B.; Veerawattananun S.; Ito M.; Hiroyoshi N.; Igarashi T. Pyrite oxidation in the presence of hematite and alumina: I. Batch leaching experiments and kinetic modeling calculations. Sci. Total Environ. 2017, 580, 687–698. 10.1016/j.scitotenv.2016.12.015. [DOI] [PubMed] [Google Scholar]
- Yuniati M. D.; Kitagawa K.; Hirajima T.; Miki H.; Okibe N.; Sasaki K. Suppression of pyrite oxidation in acid mine drainage by carrier microencapsulation using liquid product of hydrothermal treatment of low-rank coal, and electrochemical behavior of resultant encapsulating coatings. Hydrometallurgy 2015, 158, 83–93. 10.1016/j.hydromet.2015.09.028. [DOI] [Google Scholar]
- Sarmiento A. M.; DelValls A.; Nieto J. M.; Salamanca M. J.; Caraballo M. A. Toxicity and potential risk assessment of a river polluted by acid mine drainage in the Iberian Pyrite Belt (SW Spain). Sci. Total Environ. 2011, 409, 4763–4771. 10.1016/j.scitotenv.2011.07.043. [DOI] [PubMed] [Google Scholar]
- Manceau A.; Merkulova M.; Murdzek M.; Batanova V.; Baran R.; Glatzel P.; Saikia B. K.; Paktunc D.; Lefticariu L. Chemical Forms of Mercury in Pyrite: Implications for Predicting Mercury Releases in Acid Mine Drainage Settings. Environ. Sci. Technol. 2018, 52, 10286–10296. 10.1021/acs.est.8b02027. [DOI] [PubMed] [Google Scholar]
- Henríquez R.; Vasquez C.; Briones N.; Munoz E.; Leyton P.; Dalchiele E. A. Single phase FeS2 (pyrite) thin films prepared by combined electrodeposition and hydrothermal low temperature techniques. Int. J. Electrochem. Sci. 2016, 11, 4966–4978. 10.20964/2016.06.17. [DOI] [Google Scholar]
- Liu Y.; Wang S. Electrochemical properties for Co-doped pyrite with high conductivity. Energies 2015, 8, 9584–9593. 10.3390/en8099584. [DOI] [Google Scholar]
- Inger E. Can fool’s gold “pyrite” become real gold as a catalyst for clean-energy H2 production?. Int. J. Hydrogen Energy 2019, 44, 32124–32135. 10.1016/j.ijhydene.2019.10.106. [DOI] [Google Scholar]
- Cao Z.; Chen X.; Peng Y. The role of sodium sulfide in the flotation of pyrite depressed in chalcopyrite flotation. Miner. Eng. 2018, 119, 93–98. 10.1016/j.mineng.2018.01.029. [DOI] [Google Scholar]
- Wu Z.; Zhong S. P.; Wu Z. L.; Huang Z. S.; Chan B. K. C. Electrochemical behavior of carbon paste electrode with gold-bearing pyrite in bioleaching. Adv. Mater. Res. 2013, 825, 360–363. 10.4028/www.scientific.net/AMR.825.360. [DOI] [Google Scholar]
- Cowan D. H.; Jahromi F. G.; Ghahreman A. A parameters study of the novel atmospheric pyrite oxidation process with Lewatit AF 5 catalyst. Hydrometallurgy 2019, 183, 87–97. 10.1016/j.hydromet.2018.11.014. [DOI] [Google Scholar]
- Li L.; Polanco C.; Ghahreman A. Fe(III)/Fe(II) reduction-oxidation mechanism and kinetics studies on pyrite surfaces. J. Electroanal. Chem. 2016, 774, 66–75. 10.1016/j.jelechem.2016.04.035. [DOI] [Google Scholar]
- Lehner S.; Ciobanu M.; Savage K.; Cliffel D. E. Electrochemical Impedance Spectroscopy of Synthetic Pyrite Doped with As, Co, and Ni. J. Electrochem. Soc. 2008, 155, P61. 10.1149/1.2885103. [DOI] [Google Scholar]
- Rimstidt D. D.; Vaughan D. J. Pyrite oxidation: A state-of-the-art assessment of the reaction mechanism. Geochim. Cosmochim. Acta 2003, 67, 873–880. 10.1016/S0016-7037(02)01165-1. [DOI] [Google Scholar]
- Long F.; He J.; Zhang M.; Wu X.; Mo S.; Zou Z.; Zhou Y. Microwave-hydrothermal synthesis of Co-doped FeS2 as a visible-light photocatalyst. J. Mater. Sci. 2015, 50, 1848–1854. 10.1007/s10853-014-8747-5. [DOI] [Google Scholar]
- Wang X.; Wang G.; Chen J.; Zhu X.; Tian J.; Jiang C.; Zhang Y.; Liu X.; Wang R. Pyrite thin films prepared for thermal batteries via sulfuring electrodeposited iron sulfide films: Structure and physical properties. Mater. Lett. 2013, 110, 144–147. 10.1016/j.matlet.2013.07.107. [DOI] [Google Scholar]
- Yu Q.; Cai S.; Jin Z.; Yan Z. Evolutions of composition, microstructure and optical properties of Mn-doped pyrite (FeS2) films prepared by chemical bath deposition. Mater. Res. Bull. 2013, 48, 3601–3606. 10.1016/j.materresbull.2013.05.074. [DOI] [Google Scholar]
- Liu X.; Ho J. Y. L.; Wong M.; Kwok H. S.; Liu Z. Synthesis, characterization and fabrication of ultrathin iron pyrite (FeS 2) thin films and field-effect transistors. RSC Adv. 2016, 6, 8290–8296. 10.1039/C5RA23344E. [DOI] [Google Scholar]
- Liu W.; Wang Y.; Ai Z.; Zhang L. Hydrothermal Synthesis of FeS2 as a High-Efficiency Fenton Reagent to Degrade Alachlor via Superoxide-Mediated Fe(II)/Fe(III) Cycle. ACS Appl. Mater. Interfaces 2015, 7, 28534–28544. 10.1021/acsami.5b09919. [DOI] [PubMed] [Google Scholar]
- Kitchaev D. A.; Ceder G. Evaluating structure selection in the hydrothermal growth of FeS2 pyrite and marcasite. Nat. Commun. 2016, 7, 1026 10.1038/ncomms13799. [DOI] [PMC free article] [PubMed] [Google Scholar]
- Song C.; Wang S.; Dong W.; Fang X.; Shao J.; Zhu J.; Pan X. Hydrothermal synthesis of iron pyrite (FeS2) as efficient counter electrodes for dye-sensitized solar cells. Sol. Energy 2016, 133, 429–436. 10.1016/j.solener.2016.04.002. [DOI] [Google Scholar]
- Golsheikh A. M.; Huang N. M.; Lim H. N.; Chia C. H.; Harrison I.; Muhamad M. R. One-pot hydrothermal synthesis and characterization of FeS2 (pyrite)/graphene nanocomposite. Chem. Eng. J. 2013, 218, 276–284. 10.1016/j.cej.2012.09.082. [DOI] [Google Scholar]
- Wu R.; Zheng Y. F.; Zhang X. G.; Sun Y. F.; Xu J. B.; Jian J. K. Hydrothermal synthesis and crystal structure of pyrite. J. Cryst. Growth 2004, 266, 523–527. 10.1016/j.jcrysgro.2004.02.020. [DOI] [Google Scholar]
- Feng X.; He X.; Pu W.; Jiang C.; Wan C. Hydrothermal synthesis of FeS2 for lithium batteries. Ionics 2007, 13, 375–377. 10.1007/s11581-007-0136-5. [DOI] [Google Scholar]
- Morales-Gallardo M. V.; Ayala A. M.; Pal M.; Cortes Jacome M. A.; Toledo Antonio J. A.; Mathews N. R. Synthesis of pyrite FeS2 nanorods by simple hydrothermal method and its photocatalytic activity. Chem. Phys. Lett. 2016, 660, 93–98. 10.1016/j.cplett.2016.07.046. [DOI] [Google Scholar]
- Akhoondi A.; Aghaziarati M.; Khandan N. Production of highly pure iron disulfide nanoparticles using hydrothermal synthesis method. Appl. Nanosci. 2012, 3, 417–422. 10.1007/s13204-012-0153-1. [DOI] [Google Scholar]
- Akhoondi A.; Ziarati M.; Khandan N. Hydrothermal production of highly pure nano pyrite in a stirred reactor. Iran. J. Chem. Chem. Eng. 2014, 33, 15–19. [Google Scholar]
- Uhlig I.; Szargan R.; Nesbitt H. W.; Laajalehto K. Surface states and reactivity of pyrite and marcasite. Appl. Surf. Sci. 2001, 179, 222–229. 10.1016/S0169-4332(01)00283-5. [DOI] [Google Scholar]
- Li L.; Ghahremaninezhad A. In Kinetics of Ferric-Ferrous Reduction-Oxidation Reactions on the Pyrite Surfaces, IMPC 2016—28th International Mineral Processing Congress, 2016.
- Wang H.; Bigham J. M.; Tuovinen O. H. Oxidation of marcasite and pyrite by iron-oxidizing bacteria and archaea. Hydrometallurgy 2007, 88, 127–131. 10.1016/j.hydromet.2007.03.010. [DOI] [Google Scholar]
- Greenwood N. N.; Earnshaw A.. Chemistry of the Elements; Elsevier, 2012. [Google Scholar]
- Boros È.; Earle M. J.; Gîlea M. A.; Metlen A.; Mudring A.-V.; Rieger F.; Robertson A. J.; Seddon K. R.; Tomaszowska A. A.; Trusov L.; et al. On the dissolution of non-metallic solid elements (sulfur, selenium, tellurium and phosphorus) in ionic liquids. Chem. Commun. 2010, 46, 716–718. 10.1039/B910469K. [DOI] [PubMed] [Google Scholar]
- Ren Y.; Shui H.; Peng C.; Liu H.; Hu Y. Solubility of elemental sulfur in pure organic solvents and organic solvent-ionic liquid mixtures from 293.15 to 353.15K. Fluid Phase Equilib. 2011, 312, 31–36. 10.1016/j.fluid.2011.09.012. [DOI] [Google Scholar]
- Boyabat N.; Özer A. K.; Bayrakçeken S.; Gülaboğlu M. Ş. Thermal decomposition of pyrite in the nitrogen atmosphere. Fuel Process Technol. 2004, 85, 179–188. 10.1016/S0378-3820(03)00196-6. [DOI] [Google Scholar]
- Takahashi N.; Nakatani Y.; Yatomi T.; Nakamura T. Growth of single-crystal pyrite films by atmospheric pressure chemical vapor deposition. Chem. Mater. 2003, 15, 1763–1765. 10.1021/cm0210243. [DOI] [Google Scholar]
- Lehner S. W.; Savage K. S.; Ayers J. C. Vapor growth and characterization of pyrite (FeS2) doped with Co, Ni, and As: Variations in semiconducting properties. J. Cryst. Growth 2006, 286, 306–317. 10.1016/j.jcrysgro.2005.09.062. [DOI] [Google Scholar]
- Trinh T. K.; Truong N. T. N.; Pham V. T. H.; Kim H.; Park C. Effect of sulfur annealing on the morphological, structural, optical and electrical properties of iron pyrite thin films formed from FeS2 nano-powder. Korean J. Chem. Eng. 2018, 35, 1525–1531. 10.1007/s11814-018-0060-6. [DOI] [Google Scholar]
- Rafsanjani-Abbasi A.; Davoodi A. Electrochemical Characterization of Natural Chalcopyrite Dissolution in Sulfuric Acid Solution in Presence of Peroxydisulfate. Electrochim. Acta 2016, 212, 921–928. 10.1016/j.electacta.2016.07.061. [DOI] [Google Scholar]
- Eghbalnia M.; Dixon D. G. In situ electrochemical characterization of natural pyrite as a galvanic catalyst using single-particle microelectrode technique in ferric sulfate solutions. J. Solid State Electrochem. 2013, 17, 235–267. 10.1007/s10008-012-1873-6. [DOI] [Google Scholar]
- Wei S.; Wang X.; Wang J.; Sun X.; Cui L.; Yang W.; Zheng Y.; Liu J. CoS2 nanoneedle array on Ti mesh: A stable and efficient bifunctional electrocatalyst for urea-assisted electrolytic hydrogen production. Electrochim. Acta 2017, 246, 776–782. 10.1016/j.electacta.2017.06.068. [DOI] [Google Scholar]
- Ghahremaninezhad a.; Dixon D. G.; Asselin E. Electrochemical and XPS analysis of chalcopyrite (CuFeS2) dissolution in sulfuric acid solution. Electrochim. Acta 2013, 87, 97–112. 10.1016/j.electacta.2012.07.119. [DOI] [Google Scholar]
- Morales-Gallardo M. V.; Ayala A. M.; Pal M.; Cortes Jacome M. A.; Toledo Antonio J. A.; Mathews N. R. Synthesis of pyrite FeS2 nanorods by simple hydrothermal method and its photocatalytic activity. Chem. Phys. Lett. 2016, 660, 93–98. 10.1016/j.cplett.2016.07.046. [DOI] [Google Scholar]
- Wang X.; Wang G.; Chen J.; Zhu X.; Tian J.; Jiang C.; Zhang Y.; Liu X.; Wang R. Pyrite thin films prepared for thermal batteries via sulfuring electrodeposited iron sulfide films: Structure and physical properties. Mater. Lett. 2013, 110, 144–147. 10.1016/j.matlet.2013.07.107. [DOI] [Google Scholar]
- Wei D.; Osseo-Asare K. Semiconductor electrochemistry of particulate pyrite: mechanisms and products of dissolution. J. Electrochem. Soc. 1997, 144, 546. 10.1149/1.1837446. [DOI] [Google Scholar]
- Liu Y. L.; Wei W. L.; Hsu K. Y.; Ho W. H. Thermal stability of epoxy-silica hybrid materials by thermogravimetric analysis. Thermochim. Acta 2004, 412, 139–147. 10.1016/j.tca.2003.09.004. [DOI] [Google Scholar]
- Huang F.; Gao S.; Chen L.; Su L.; Li Y.; Meng L.; Liu K.; Chai C.; Qi X. Micro-texture and in situ sulfur isotope of pyrite from the Baiyunpu Pb–Zn deposit in central Hunan, South China: Implications for the growth mechanism of colloform pyrite aggregates. J. Asian Earth Sci. 2020, 193, 104302 10.1016/j.jseaes.2020.104302. [DOI] [Google Scholar]
- Yang Z.; Liu X.; Feng X.; Cui Y.; Yang X. Hydrothermal synthesized micro/nano-sized pyrite used as cathode material to improve the electrochemical performance of thermal battery. J. Appl. Electrochem. 2014, 44, 1075–1080. 10.1007/s10800-014-0724-9. [DOI] [Google Scholar]
- Zhu L.; Richardson B.; Tanumihardja J.; Yu Q. Controlling morphology and phase of pyrite FeS 2 hierarchical particles via the combination of structure-direction and chelating agents. CrystEngComm 2012, 14, 4188–4195. 10.1039/c2ce25222h. [DOI] [Google Scholar]
- Kush P.; Mehra N. C.; Deka S. Synthesis, characterization and optical properties of novel hierarchical flower like pyrite FeS2 particles for low cost photovoltaics. Sci. Adv. Mater. 2013, 5, 788–795. 10.1166/sam.2013.1519. [DOI] [Google Scholar]
- Wang D. W.; Wang Q. H.; Wang T. M. Controlled growth of pyrite FeS2 crystallites by a facile surfactant-assisted solvothermal method. CrystEngComm 2010, 12, 755–761. 10.1039/B917941K. [DOI] [Google Scholar]
- Xue H.; Yu D. Y. W.; Qing J.; Yang X.; Xu J.; Li Z.; Sun M.; Kang W.; Tang Y.; Lee C. S. Pyrite FeS2 microspheres wrapped by reduced graphene oxide as high-performance lithium-ion battery anodes. J. Mater. Chem. A 2015, 3, 7945–7949. 10.1039/C5TA00988J. [DOI] [Google Scholar]
- Chandra A. P.; Gerson A. R. The mechanisms of pyrite oxidation and leaching: A fundamental perspective. Surf. Sci. Rep. 2010, 65, 293–315. 10.1016/j.surfrep.2010.08.003. [DOI] [Google Scholar]
- Chu K.; Jia C.; Liang X.; Chen H.; Gao W. Effect of particle size on the microstructure and thermal conductivity of Al/diamond composites prepared by spark plasma sintering. Rare Met. 2009, 28, 646–650. 10.1007/s12598-009-0123-2. [DOI] [Google Scholar]
- Bard A. J.; Faulkner L. R.. Electrochemical Methods: Fundamentals and Applications; Wiley: New York, 1980; Vol. 2. [Google Scholar]
- Li L.; Polanco C.; Ghahreman A. Fe(III)/Fe(II) reduction-oxidation mechanism and kinetics studies on pyrite surfaces. J. Electroanal. Chem. 2016, 774, 66–75. 10.1016/j.jelechem.2016.04.035. [DOI] [Google Scholar]
- Crundwell F. K. The semiconductor mechanism of dissolution and the pseudo-passivation of chalcopyrite. Can. Metall. Q. 2015, 54, 279–288. 10.1179/1879139515Y.0000000007. [DOI] [Google Scholar]
- Holmes P. R.; Crundwell F. K. Polysulfides do not cause passivation: Results from the dissolution of pyrite and implications for other sulfide minerals. Hydrometallurgy 2013, 139, 101–110. 10.1016/j.hydromet.2013.07.006. [DOI] [Google Scholar]
- Sauber M.; Dixon D. G. Electrochemical study of leached chalcopyrite using solid paraffin-based carbon paste electrodes. Hydrometallurgy 2011, 110, 1–12. 10.1016/j.hydromet.2011.07.009. [DOI] [Google Scholar]
- Miki H.; Hirajima T.; Oka K.; Sasaki K. The development of fine microgram powder electrode system and its application in the analysis of chalcopyrite leaching behavior. Minerals 2016, 6, 103 10.3390/min6040103. [DOI] [Google Scholar]
- Mailley P.; Cummings E. A.; Mailley S. C.; Eggins B. R.; McAdams E.; Cosnier S. Composite carbon paste biosensor for phenolic derivatives based on in situ electrogenerated polypyrrole binder. Anal. Chem. 2003, 75, 5422–5428. 10.1021/ac034177y. [DOI] [PubMed] [Google Scholar]
- Karimi F.; Peppley B. A. Metal Carbide and Oxide Supports for Iridium-Based Oxygen Evolution Reaction Electrocatalysts for Polymer-Electrolyte-Membrane Water Electrolysis. Electrochim. Acta 2017, 246, 654–670. 10.1016/j.electacta.2017.06.048. [DOI] [Google Scholar]
- Li L.; Ghahreman A. The Synergistic Effect of Cu 2+ -Fe 2+ -Fe 3+ Acidic System on the Oxidation Kinetics of Ag-Doped Pyrite. J. Phys. Chem. C 2018, 122, 26897–26909. 10.1021/acs.jpcc.8b06727. [DOI] [Google Scholar]
- Munirathinam B.; Narayanan R.; Neelakantan L. Electrochemical and semiconducting properties of thin passive film formed on titanium in chloride medium at various pH conditions. Thin Solid Films 2016, 598, 260–270. 10.1016/j.tsf.2015.12.025. [DOI] [Google Scholar]