Abstract
Solid-state cross-polarization magic-angle spinning carbon-13 nuclear magnetic resonance (13C CP/MAS NMR) spectroscopy is used to analyze starch derived from plants including wheat, maize, and potato, but few reports have described its application to rice starch. Here, we combined 13C CP/MAS NMR with deconvolution and subtraction methods to analyze rice lines including mutants that are deficient in at least one enzyme involved in amylose and/or amylopectin biosynthesis. We found that differences in the content of ordered structures between rice lines could be evaluated using C1 signal deconvolution and subtraction. The content of the V-type ordered structure increased with increasing amylose content. Furthermore, starch derived from a starch synthase (SS) IIIa/starch branching enzyme (BE) IIb-deficient mutant formed B- and V-type ordered structures and significantly more nonordered structures than the other rice lines. These data indicate that 13C CP/MAS NMR analysis is useful for discriminating the genetic backgrounds of starch derived from different rice cultivars.
Introduction
Starch consists of the glucose homopolymers, amylose and amylopectin. Amylose is primarily a linear polysaccharide with α-(1–4)-linked d-glucose units, and it accounts for 15–35% of starch in wild-type rice cultivars. On the other hand, amylopectin has an α-(1–4)-linked d-glucose backbone with ∼5% α-(1–6)-linked branches that profoundly affect the physicochemical properties of starch. At least four enzymes participate in starch biosynthesis: ADP-glucose pyrophosphorylase (AGPase), starch synthase (SS), branching enzyme (BE), and debranching enzyme (DEB).1,2 Among these enzymes, granule-bound starch synthase I (GBSSI) is involved in amylose biosynthesis, and the others are involved in amylopectin biosynthesis. Branching enzyme is the only enzyme that forms branch points in amylopectin molecules. Starch synthase elongates amylopectin chains using ADP-glucose produced by AGPase as a substrate. Many isozymes of these starch biosynthetic enzymes in rice are encoded by different genes that are specifically expressed in tissues. High levels of GBSSI, SSIIa, SSIIIa, BEIIb, and ISA1 are expressed in the rice endosperm. The structure and physicochemical properties of endosperm starch are quite different in mutant lines deficient in these isozymes compared with wild-type rice.3,4
Several studies have investigated molecular changes in starch using differential scanning calorimetry (DSC),5 X-ray diffraction (XRD),6 near-infrared (NIR),7 Fourier transform infrared (FT-IR),8 Raman,913C CP/MAS nuclear magnetic resonance (NMR),10−15 and 1H NMR spectroscopy. Among them, solid-state 13C CP/MAS NMR is the most powerful for simultaneously analyzing amorphous nonordered and ordered states of starch structures.
The present study combined 13C CP/MAS NMR with deconvolution and subtraction methods to confirm the structure of starch from several rice lines including starch biosynthetic enzyme-deficient mutants and a wild-type strain.
Results and Discussion
13C CP/MAS NMR Spectra of Starch Biosynthetic Enzyme-Deficient Mutants and Wild-Type Rice
The composition, conformation, crystalline form, and gelatinization of starch have been analyzed using solid-state NMR spectroscopy.10,16−18Figure 1 shows a typical 13C CP/MAS NMR spectrum of japonica rice (ss2aL/gbss1L, Nipponbare) with four typical signal areas: 91–106 ppm for C1; 78–86 ppm for the C4 nonordered structure; 66–78 ppm for C2, C3, C4, and C5 of glucose; and 58–66 ppm for C6 of glucose.14,19,20Table 1 summarizes the 13C CP/MAS NMR chemical shifts with previous findings of other crops including maize, potato, and pea.10,15,19,20 The 13C CP/MAS spectra of the rice lines were very similar to those of starch prepared from other crops.
Figure 1.
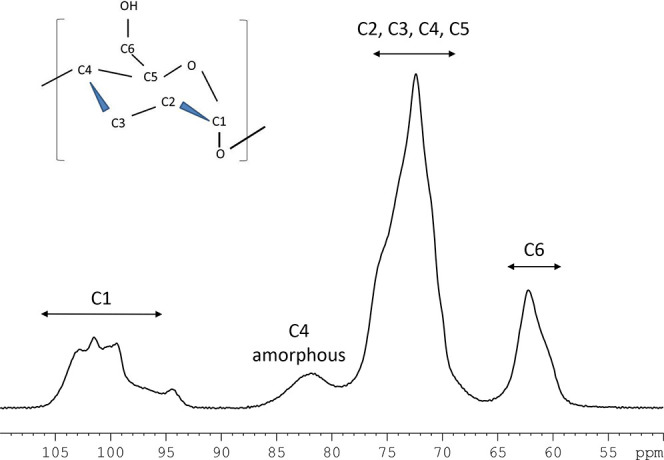
13C CP/MAS NMR spectrum of japonica rice with signal assignments.
Table 1. 13C CP/MAS NMR Chemical Shifts and Assignments for C1 and C6 Regions.
| C1 |
|
|||||||||
|---|---|---|---|---|---|---|---|---|---|---|
| A type | B type | |||||||||
| strach | nonordered structure 1 | peak 1 | peak 2 | peak 3 | peak 1 | peak 2 | nonordered structure 2 | UKg | C6 | reference |
| waxy | 102.9 | 101.5 | 100.4 | 99.4 | 97.7 | 94.4 | 62.2, 60.7 | present study | ||
| japonica | 102.9 | 101.4 | 100.3 | 99.4 | 97.4 | 94.4 | 62.3, 60.7 | |||
| indica | 102.9 | 101.5 | 100.4 | 99.4 | 97.6 | 94.4 | 62.3, 60.6 | |||
| SSIIIa-deficient mutant | 103.0 | 101.5 | 100.4 | 99.3 | 97.6 | 94.4 | 62.2, 60.6 | |||
| SSIIIa/BEIIb-deficient mutant | 102.9 | 101.0 | 99.8 | 97.4 | 94.4 | 62.0, 60.4 | ||||
| rice, maize | 102–105 | 100.4 | 99.2 | 98.2 | 94–98 | (10) | ||||
| potato | 102–105 | 100 | 99.2 | 94–98 | ||||||
| maize | 102.3 | 101.5 | 100.3 | 62.8 | (15) | |||||
| potato | 101.4 | 100.4 | 62.1 | |||||||
| maize | 102.4 | 101.5 | 100.4 | 99.4 | 97.5 | (12) | ||||
| potato | 102.1 | 100.9 | 99.9 | 98.1 | ||||||
| maize | 102.4 | 101 | 100 | 98.7 | (27) | |||||
| potato | 100.4 | 99.4 | ||||||||
| 100.5 | 99.4 | 98.8 | (23) | |||||||
| waxy maze | 101.3 | 100.1 | 99 | 61.9 | ||||||
| maize | 102.4 | 101.2 | 100.1 | 99 | 65.9–60 | |||||
| gelose 50 (maize) | 102.4, 101.5 | 100.4 | 99.3 | 64.8–58.4 | ||||||
| gelose 80 (maize) | 102.9, 101.7 | 100.6 | 99.6 | 61.7–58.6 | ||||||
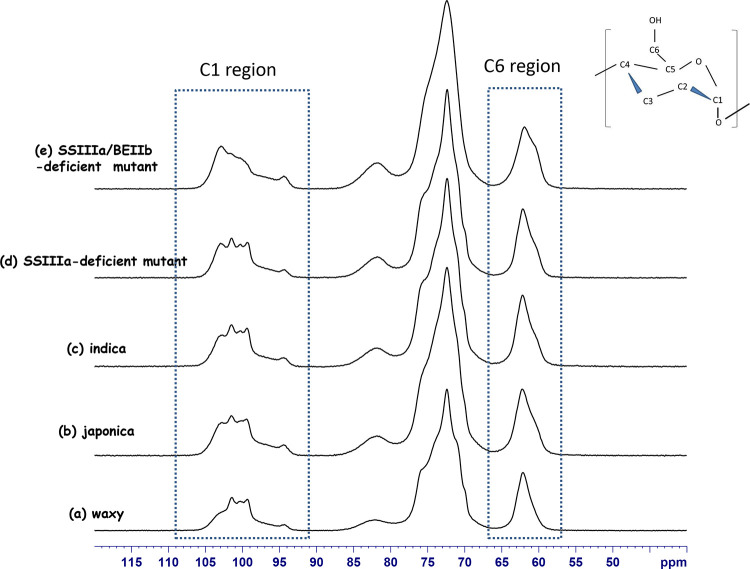
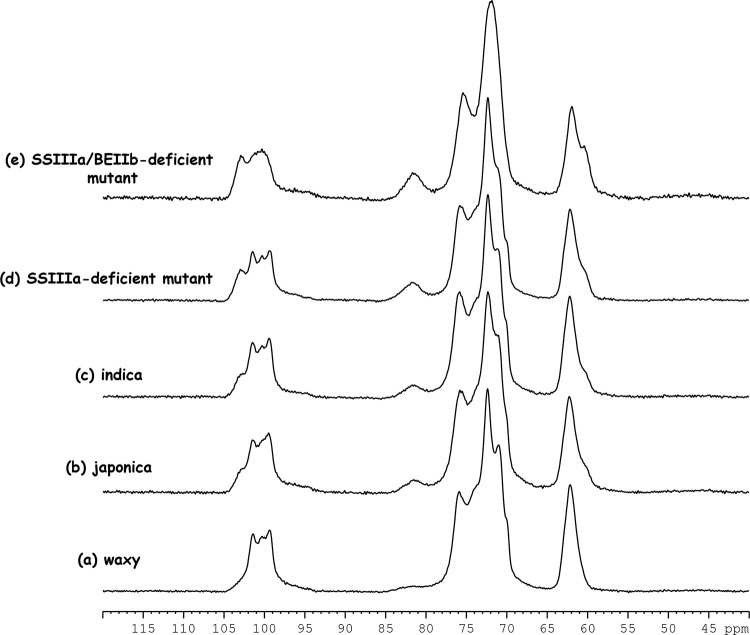
Figure 2 shows the 13C CP/MAS spectra of waxy (ss2aL/gbss1, EM21), japonica (ss2aL/gbss1L, Nipponbare), and indica (WT, IR36) rice cultivars and the SSIIIa-deficient (ss2aL/ss3a/gbss1L, e1) and SSIIIa/BEIIb-deficient (ss2aL/ss3a/gbss1L/be2b, #4019) mutants. Figure S1 shows large differences among them in terms of layers of stacks. The profiles of the C1 and C6 (Figure S1b,c) regions were unique to each rice line, which might be useful for rice line comparisons.
Figure 2.
13C CP/MAS NMR spectra for (a) waxy, (b) japonica, (c) indica, (d) SSIIIa-deficient mutant, and (e) SSIIIa/BEIIb-deficient mutant.
Deconvolution Analysis for 13C CP/MAS NMR Spectra
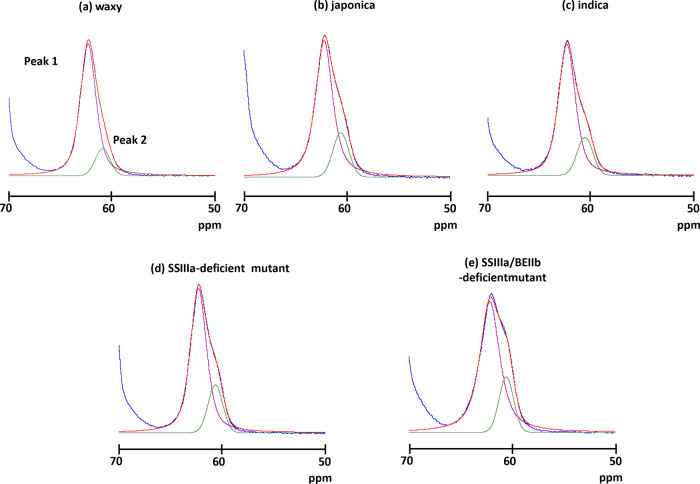
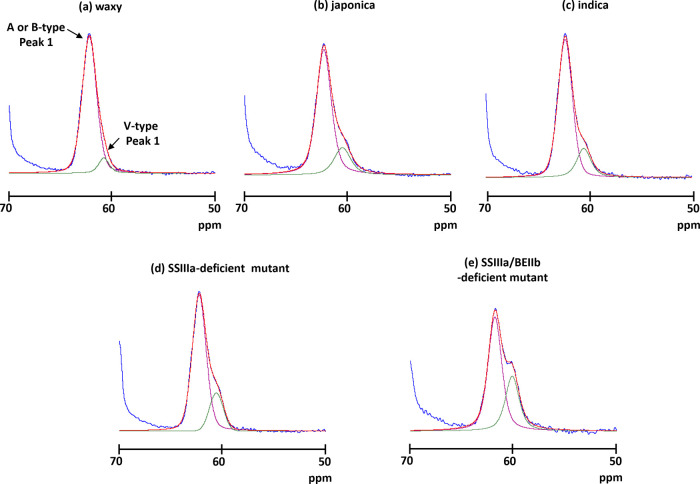
The C1 and C6 regions did not overlap other carbon atoms (Figures 2 and S1) and thus are very informative for structural analyses of rice starch. More precisely, the peak of each C6 signal was fitted by the SOLA solid line shape program in TopSpin software. The C6 region in all rice lines could be deconvoluted into two signals at 62.2 or 62.0 and 60.6 ppm (Figure 3 and Table S1). The signal intensity at the high field (60.6 ppm) tended to increase with amylose content. As a V-type chemical shift at 60.6 ppm has been determined,21 the signal at the high field (60.6 ppm) might be assigned to a V-type ordered structure. On the other hand, the very broad chemical shift of the nonordered structure C6 signal was assigned at 61.7 ppm with reference to the C6 signal of amorphous rice powder (Figure S2), indicating that the signal positioned at the low field (62.2 ppm) might contain ordered (A or B) and nonordered structures. Furthermore, the chemical shift of the SSIIIa/BEIIb-deficient mutant positioned at the low field shifted to the high field (62.0 ppm) compared with the other rice samples. This shift indicated that the SSIIIa/BEIIb-deficient mutant contained a more nonordered structure than the other rice lines. However, C6 is positioned at a side chain of a glucose chain and it was more mobile than that in the main chain. Therefore, detailed structural information was not reflected in the NMR chemical shift. Indeed, the A- and B-type ordered and nonordered structures could not be separated. Although these results indicated that the SSIIIa/BEIIb-deficient mutant is structurally different from other rice lines, more detailed information could not be obtained from the C6 region.
Figure 3.
Spectral decomposition of the C6 area in (a) waxy, (b) japonica, (c) indica, (d) SSIIIa-deficient mutant, and (e) SSIIIa/BEIIb-deficient mutant. Blue, experimental data; red, simulated data; and magenta and green, individual components.
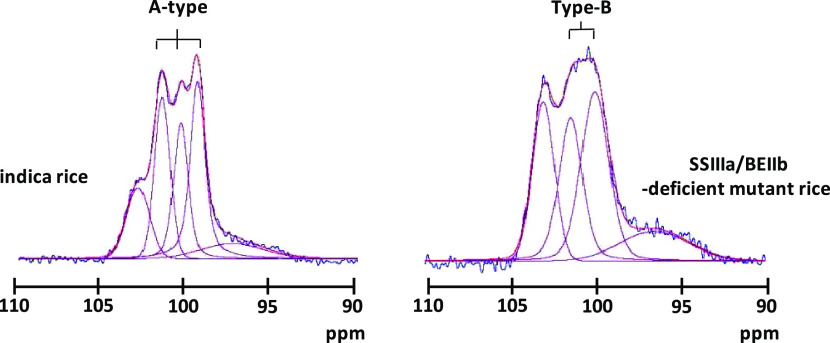
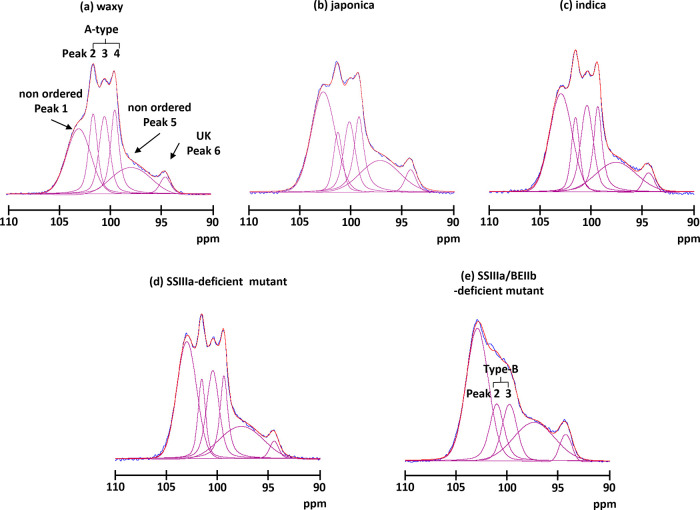
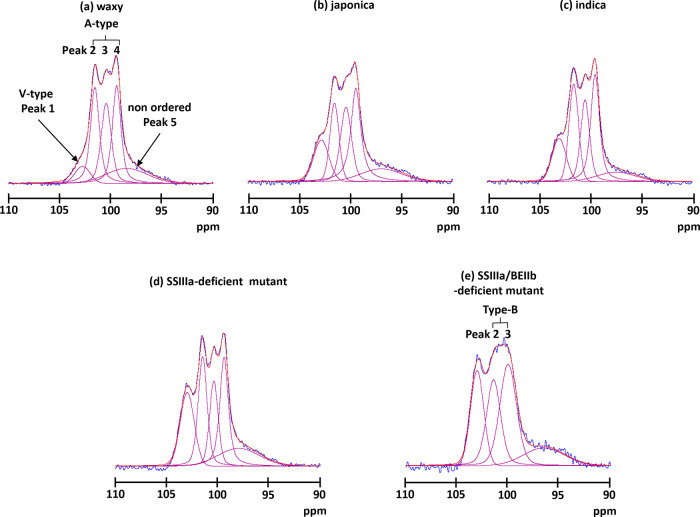
Like the C6 signal, those from other carbons did not overlap the C1 signal, and the glycosidic torsion angle more relatively reflected an NMR chemical shift.16 Therefore, the C1 region was more informative than the C6 region about structural details. Starch has four crystalline states. A-type crystals have another double helix that fills the channel of the hexagonal packing22−24 and adopts a twofold packing symmetry that leads to three inequivalent residues per unit. Therefore, C1 had three distinct peaks.10 B-type crystals consist of six hexagonally arranged double helices packed in a hexagonal unit cell with the P61 space group, and the middle channel contains some water molecules.25 Therefore, C1 had two peaks. As C-type starch is a composite of the A and B types, C1 had two peaks of mixed A and B types.17 Another type of starch is the V type, in which a single helical amylose-lipid complex gives rise to one C1 peak.16Figures 2 and S1b show the 13C CP/MAS NMR spectrum of the C1 region. The five rice lines considerably differed. The structure of the SSIIIa/BEIIb-deficient mutant was obviously changed. To obtain more precise structural information, each spectrum was deconvoluted using SOLA. This resulted in six peaks, including the three distinct peaks (∼101.5, ∼100.4, and ∼99.4 ppm), two broad peaks (∼102.9 and ∼97.6 ppm), and one unassigned small peak (∼94.4 ppm), except for the SSIIIa/BEIIb-deficient mutant (Figure 4). The two broad peaks were assigned to a nonordered structure because they were much broader (∼400 and ∼700 Hz for the peaks at lower and higher fields, respectively) than those of the ordered structure (130–220 Hz). The three distinct peaks (101.5, 100.4, and 99.4 ppm) indicated an A-type structure. Thus, waxy, japonica, indica, and the SSIIIa-deficient mutant mainly had A-type ordered structures and the spectra were very similar to those of regular maize and wheat.10,15,16,19,20 On the other hand, the SSIIIa/BEIIb-deficient mutant could not fit the three-peak pattern. Five peaks comprised two peaks (101.0 and 99.8 ppm), two broad peaks (102.9 and 97.4 ppm), and one unassigned small peak (94.4 ppm). Because the chemical shift of the two peaks coincided with B-type ordered structures, the starch of the SSIIIa/BEIIb-deficient mutant formed a B-type ordered structure. Indeed, X-ray analysis confirmed B-type ordered structure packing in the SSIIIa/BEIIb-deficient mutant.26
Figure 4.
Spectral decomposition of the C1 area of (a) waxy, (b) japonica, (c) indica, (d) SSIIIa-deficient mutant, and (e) SSIIIa/BEIIb-deficient mutant. Blue, experimental data; red, simulated data; and magenta, individual components.
Quantitative Analysis of the Ordered Structure Using Deconvolution before Subtraction
The ordered structure has been determined from NMR spectra, using deconvolution,10 the portion of the peak area for C4 resonances relative to the total area of the spectrum,17 and spectrum subtraction.16 Each rice sample herein was quantitatively analyzed using deconvolution and spectrum subtraction.
Deconvolution of the C1 region showed that the amount of ordered structure in waxy assigned to the A type (peak 2–4) was the highest (51.9%) and that the amounts of ordered structures in japonica, indica, and the SSIIIa-deficient mutant were all ∼0%. Conversely, the amount of ordered structure of the SSIIIa/BEIIb-deficient mutant (= assigned B type; peaks 2 and 3) was the lowest (28.1%) among the five rice lines (Tables 2 and S2). Furthermore, the deconvolution results indicated that the peak width of the ordered structure of the SSIIIa/BEIIb-deficient mutant (∼250 Hz) was broader than that of the type A (130–220 Hz) for other rice lines. These findings indicated that the ordered structure of the SSIIIa/BEIIb-deficient mutant had not only changed but was more flexible than those of the other rice lines.
Table 2. Components Obtained from NMR Deconvolution of the C1 Region.
| ordered structure |
|||||
|---|---|---|---|---|---|
| nonordered structure (%) | A type (%) | B type (%) | UKa (%) | UKa(%) | |
| waxy | 29 | 52 | 15 | 4 | |
| japonica | 36.8 | 41 | 19 | 4 | |
| indica | 33.4 | 46 | 18 | 3 | |
| SSIIIa-deficient mutant | 47 | 44 | 18 | 3 | |
| SSIIIa/ BEIIb-deficient mutant | 45 | 28 | 23 | 4 | |
Unassigned signals.
Quantitative Analysis of the Ordered Structure Using Subtraction and Deconvolution after Subtraction
The subtraction method was applied to the five rice samples as described by Tan et al.16 The CP/MAS spectra of these rice lines were subtracted from those of lines with nonordered structures (for example Figure S2). Amorphous rice powder was the nonordered reference in the present study. The difference obtained by subtracting the integral value of the subtracted spectrum (Figure S2c) from that of the total spectrum (Figure S2a) indicated the amount of nonordered components. The amount of nonordered structure increased with amylose content (Table 3) except in the SSIIIa-deficient mutant. As the subtracted spectra of rice only had the ordered structure, the subtracted spectra were deconvoluted (Figure 5). The subtracted spectra in the C1 region had five deconvoluted peaks for waxy, japonica, indica, and the SSIIIa-deficient mutant and four for the SSIIIa/BEIIb-deficient mutant (Figure 6 and Table S3). The deconvoluted spectra of waxy, japonica, indica, and the SSIIIa-deficient mutant clearly had three sharp signals (100.5, 100.4, and 99.4 ppm); thus, the ordered structure of these rice lines was the A type. On the other hand, the SSIIIa/BEIIb-deficient mutant had two signals (101.0 and 99.8 ppm), indicating a B-type ordered structure. In addition to the peaks of the A- and B-type ordered structures, two more peaks (102.7–103.0 and 97.4–98.4 ppm) were identified. The lowest peak at 103 ppm was assigned to a V-type ordered structure as described.16Table 3 summarizes each component. Because the difference between waxy rice and other rice lines is the absence or presence of amylose, these data showed that the content of the V-type ordered structure increased with amylose content except in the SSIIIa/BEIIb-deficient mutant with a B-type ordered structure.
Table 3. Components Determined by NMR Subtraction of the C1 Region.
| ordered
structure |
||||||
|---|---|---|---|---|---|---|
| apparent amylose content (%) | nonordered structure (%) | V type (%) | A type (%) | B type (%) | UKa (%) | |
| waxy | 0 | 46 | 4 | 42 | 9 | |
| japonica | 21.231 | 56 | 7 | 32 | 6 | |
| indica | 25.634 | 52 | 7 | 36 | 4 | |
| SSIIIa-deficient mutant | 30.731 | 47 | 13 | 30 | 8 | |
| SSIIIa/ BEIIb-deficient mutant | 45.131 | 69 | 8 | 19 | 4 | |
Unassigned signal.
Figure 5.
Subtraction spectra of (a) waxy, (b) japonica, (c) indica, (d) SSIIIa-deficient mutant, and (e) SSIIIa/BEIIb-deficient mutant.
Figure 6.
Spectral decomposition of the C1 area of subtraction spectra for (a) waxy, (b) japonica, (c) indica, (d) SSIIIa-deficient mutant, and (e) SSIIIa/BEIIb-deficient mutant. Blue, experimental data; red, simulated data; and magenta, individual components.
The A- and B-type ordered and the nonordered structure could not be separated to analyze the total C6 signal. The subtraction spectra indicated that the C6 signal contained only the crystal structure. The subtracted spectra in the C6 region were then deconvoluted to signals at 62.2 and 60.4–61.0 ppm (Figure 7 and Table S4). The content of the V-type structure in the ordered structure increased with increasing amylose content.
Figure 7.
Spectral decomposition of the C6 area of subtraction spectra for (a) waxy, (b) japonica, (c) indica, (d) SSIIIa-deficient mutant, and (e) SSIIIa/BEIIb-deficient mutant. Blue, experimental data; red, simulated data; and magenta and green, individual components.
Structure of Starch for Each Rice Based on 13C CP/MAS NMR Analysis
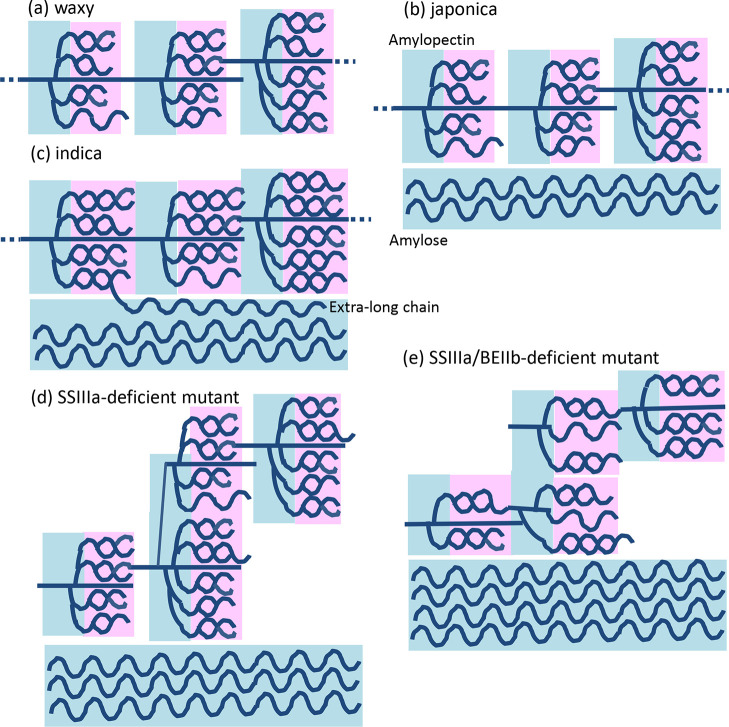
C1 deconvolution could not separate the nonordered and V-type structures. On the other hand, deconvolution after subtracting the C1 and C6 signals simultaneously provided more precise structural information about ordered (A, B, and V type) and nonordered structures. The above data indicated that the signal assigned to the ordered structure in indica rice, which is thought to have wild-type starch biosynthetic enzymes, originated from longer chains within the amylopectin cluster than in japonica rice (Figure 8). The GBSSI cannot function in waxy rice because amylose is scant or absent. The 13C CP/MAS spectrum indicated that the amorphous region decreased and then crystallinity increased (Figures 4, 4, 5, and Table 3). Furthermore, waxy rice comprises only 4% V-type ordered structures (Table 3), indicating that this structure might occur in amylopectin as well as in amylose. The activity of SSIIa, which extends amylopectin chains, is very low in japonica rice.27 Therefore, the crystal region comprising double helices is shorter in japonica than in indica rice (Figures 8 and 9). The 13C CP/MAS spectrum indicated a lower content of the ordered structure in japonica than in indica rice (Table 3). Furthermore, the width of the peak that was assigned to the A-type ordered structure in japonica rice (average of three peaks; 176 Hz) was broader than that of indica rice (average of three peaks: 168 Hz; Table S2). These data indicated that the A-type ordered structure of japonica rice is more flexible than that of indica. On the other hand, GBSSI activity and the amylose content are lower in japonica than in indica rice (Figures 8 and 9). The total crystallinity was lower in japonica than in indica rice (Figures 4, 4, 5 and Table 3). Although amylose content was higher in the SSIIIa-deficient mutant (30.7%) than in indica rice (25.6%), the content of the nonordered structure was slightly lower in the SSIIIa-deficient mutant (47%) than in indica rice (52%). As the long chains connecting amylopectin clusters cannot extend in the SSIIIa-deficient mutant (Figure 8), the nonordered structure of amylopectin might have decreased and crystallinity slightly improved. Furthermore, the content of the V-type ordered structure of the SSIIIa-deficient mutant (11%) with a higher amylose content (Figures 8 and 9) was higher than those of indica and japonica rice (∼7%). Because the BEIIb deficiency reduced the amylopectin branching structure in the SSIIIa/BEIIb-deficient mutant (Figure 8) and created spaces between amylopectin chains, the ordered structure was changed to B and V types.
Figure 8.
Postulated structure of starch from five rice lines. Pink, crystalline (ordered) structure and blue, amorphous (nonordered) structure.
Figure 9.
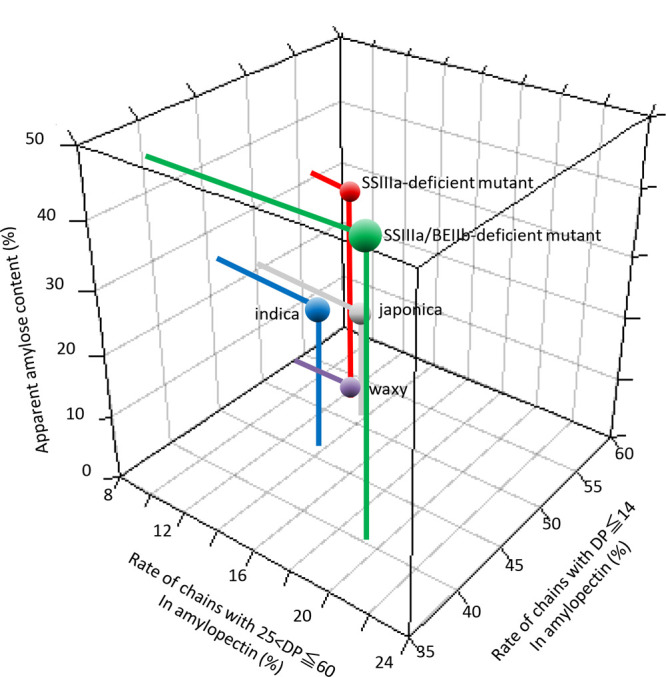
Three-dimensional plot of relationships between rates of amylopectin chains with 25 < DP ≤ 60 and DP ≤ 14 and apparent amylose contents of rice lines.
Conclusions
The wide structural variation of rice starch has been confirmed by solid-state 13C CP/MAS NMR combined with deconvolution and subtraction methods. The data obtained by the deconvolution spectra after subtracting amorphous spectra were consistent with our concept of the structure of the starch derived from five rice lines (Figure 8). These procedures simultaneously generated large amounts of information about the nonordered and A-, B-, and V-type ordered structures of rice. The content of the V-type ordered structure increased with increasing amylose content. The starch prepared from the SSIIIa/BEIIb-deficient mutant formed a B-type ordered structure with a much higher nonordered content than the other four rice lines. These data indicated that 13C CP/MAS NMR analysis is useful for analyzing starch from rice strains with different genetic backgrounds.
Materials and Methods
Materials
This study investigated wild-type mutant rice cultivars with a wide variation in starch structure. Most indica rice cultivars are thought to have wild-type biosynthetic enzymes that largely affect the starch structure. In contrast, most japonica rice cultivars are leaky (L) mutants of SSIIa with a degree of polymerization (DP) from 6–12 to DP13–24 from amylopectin branch chains and GBSSI, which synthesizes amylose. The DP13–24 chain contents of amylopectin and amylose are lower in japonica than in indica rice cultivars.27,28 Here, we analyzed typical indica (SS2a/GBSS1, IR36) and typical japonica (ss2aL/gbss1L, Nipponbare) rice cultivars and three rice starch biosynthetic enzyme mutants isolated from japonica rice cultivars. The GBSSI-deficient mutant29 (ss2aL/gbss1, EM21) does not contain amylose and it has an amylopectin structure that is similar to Nipponbare. The SSIIIa-deficient mutant30 (ss2aL/ss3a/gbss1L, e1) has a specific starch structure, in which the amount of amylopectin long chains (DP ≥ 33) is decreased and the apparent amylose content is 10% higher than that of Nipponbare.4 Both SSIIIa- and BEIIb-deficient mutants31 (ss2aL/ss3a/gbss1L/be2b, #4019) have a significantly high apparent amylose content and significantly fewer amylopectin chains (DP ≤ 14) compared with Nipponbare.4Figure 9 shows the traits of the five rice lines as three-dimensional plots based on amylopectin structure and apparent amylose content. Most rice starches have the A-type ordered structure, whereas the BEIIb-deficient mutant has the B-type ordered structure,32 and only the starch derived from the SSIIIa/BEIIb-deficient mutant has the B-type ordered structure. Rice flour of Nipponbare was treated using a shear and heat milling machine33 (SHMM) to obtain starch with an amorphous (nonordered) structure.
Sample Preparation for Solid-State 13C CP/MAS NMR
Rice grains were polished using a PEARLEST grain polisher (Kett Electric Laboratory, Tokyo, Japan) for 60 s and then homogenized in a Milser blender (Iwatani Corp., Tokyo, Japan) for 10 s.
Solid-State 13C CP/MAS NMR Analysis
All 13C cross-polarization and magic-angle spinning (CP/MAS) nuclear magnetic resonance (NMR) spectra were obtained using an Avance 600 Wide Bore spectrometer with a double-bearing CP/MAS probe (BL4DVT) (Bruker, Billerica, MA). Dipolar decoupling was systematically applied during the acquisition sequence. The spinning rate was 10 kHz at room temperature in a 4 mm ZrO2 rotor. A satisfactory signal-to-noise ratio was obtained after 10 000 accumulations. A repetition time of 2 s appeared to be sufficient, and an optimal contact time was selected on the order of 1.25 ms after probing a range of 0.75–2.25 ms. Spectra were referenced using the high-field resonance of adamantane (29.5 ppm).
The NMR spectra were analyzed using TopSpin 3.6.0 software (Bruker). All spectra were deconvoluted using the SOLA solid line shape program included in TopSpin software. The amorphous standard was nonordered rice (see Materials), and the degree of the ordered structure was determined as described16 for spectrum subtraction.
Acknowledgments
The authors are grateful to Prof. Akihiro Nishioka and Dr. Hiroko Yano at Yamagata University for providing amorphous rice starch.
Supporting Information Available
The Supporting Information is available free of charge at https://pubs.acs.org/doi/10.1021/acsomega.0c03113.
Superimposed spectra (Power Point) (Figure S1); 13C CP/MAS NMR spectra for waxy, amorphous rice powder from japonica, and waxy subtraction (Power Point) (Figure S2); 13C CP/MAS NMR data for C6 region (Table S1); 13C CP/MAS NMR data for C1 region (Table S2); 13C CP/MAS NMR subtraction data for C1 region (Table S3); 13C CP/MAS NMR subtraction data for C6 region (Table S4) (PDF)
Author Contributions
This study was supported by the Tojuro Iijima Foundation for Food Science and Technology; the Science and Technology Research Promotion Program for Agriculture, Forestry, and Fisheries and Food Industry (25033AB); and the Grant-in-Aid for JSPS fellows from the Japan Society for the Promotion of Science (19H01608).
The authors declare no competing financial interest.
Supplementary Material
References
- Nakamura Y. Towards a better understanding of the metabolic system for amylopectin biosynthesis in plants: rice endosperm as a model tissue. Plant Cell Physiol. 2002, 43, 718–725. 10.1093/pcp/pcf091. [DOI] [PubMed] [Google Scholar]
- Smith A. M.; Denyer K.; Martin C. The Synthesis of the Starch Granule. Annu. Rev. Plant Physiol. Plant Mol. Biol. 1997, 48, 67–87. 10.1146/annurev.arplant.48.1.67. [DOI] [PubMed] [Google Scholar]
- Fujita N. Starch biosynthesis in rice endosperm. Agric-Biosci. Monogr. 2014, 4, 1–18. 10.5047/agbm.2014.00401.0001. [DOI] [Google Scholar]
- Takahashi T.; Fujita N. Thermal and rheological characteristics of mutant rice starches with widespread variation of amylose content and amylopectin structure. Food Hydrocolloid 2017, 62, 83–93. 10.1016/j.foodhyd.2016.06.022. [DOI] [Google Scholar]
- Ollivon M. R. Calorimetric and Thermodielectrical Measurements of Water Interactions with Some Food Materials. Adv. Exp. Med. Biol. 1991, 302, 175–189. 10.1007/978-1-4899-0664-9_8. [DOI] [PubMed] [Google Scholar]
- Cheetham N. W. H.; Tao L. P. Variation in crystalline type with amylose content in maize starch granules: an X-ray powder diffraction study. Carbohydr. Polym. 1998, 36, 277–284. 10.1016/S0144-8617(98)00007-1. [DOI] [Google Scholar]
- Sevenou O.; Hill S. E.; Farhat I. A.; Mitchell J. R. Organisation of the external region of the starch granule as determined by infrared spectroscopy. Int. J. Biol. Macromol. 2002, 31, 79–85. 10.1016/S0141-8130(02)00067-3. [DOI] [PubMed] [Google Scholar]
- Kizil R.; Irudayaraj J.; Seetharaman K. Characterization of irradiated starches by using FT-Raman and FTIR spectroscopy. J. Agric. Food Chem. 2002, 50, 3912–3918. 10.1021/jf011652p. [DOI] [PubMed] [Google Scholar]
- Kizil R.; Irudayaraj J. Discrimination of irradiated starch gels using FT-Raman spectroscopy and chemometrics. J. Agric. Food Chem. 2006, 54, 13–18. 10.1021/jf051491f. [DOI] [PubMed] [Google Scholar]
- Gidley M. J.; Bociek S. M. Molecular-Organization in Starches - a C-13 Cp Mas Nmr-Study. J. Am. Chem. Soc. 1985, 107, 7040–7044. 10.1021/ja00310a047. [DOI] [Google Scholar]
- Hewitt J. M.; Linder M.; Pérez S.; Buleon A. High-Resolution, Cp-Mas C-13-Nmr Spectra of Solid Amylodextrins and Amylose Polymorphs. Carbohydr. Res. 1986, 154, 1–13. 10.1016/S0008-6215(00)90017-X. [DOI] [Google Scholar]
- Horii F.; Yamamoto H.; Hirai A.; Kitamaru R. Structural Study of Amylose Polymorphs by Cross-Polarization Magic-Angle Spinning, C-13-Nmr Spectroscopy. Carbohydr. Res. 1987, 160, 29–40. 10.1016/0008-6215(87)80301-4. [DOI] [Google Scholar]
- Morgan K. R.; Furneaux R. H.; Larsen N. G. Solid-State Nmr-Studies on the Structure of Starch Granules. Carbohydr. Res. 1995, 276, 387–399. 10.1016/0008-6215(95)00173-Q. [DOI] [Google Scholar]
- Singh V.; Ali S. Z.; Divakar S. 13C Cp Mas Nmr-Spectroscopy of Native and Acid Modified Starches. Starch-Stärke 1993, 45, 59–62. 10.1002/star.19930450207. [DOI] [Google Scholar]
- Veregin R. P.; Fyfe C. A.; Marchessault R. H.; Taylor M. G. Characterization of the Crystalline-a and Crystalline-B Starch Polymorphs and Investigation of Starch Crystallization by High-Resolution C-13 Cp/Mas Nmr. Macromolecules 1986, 19, 1030–1034. 10.1021/ma00158a016. [DOI] [Google Scholar]
- Tan I.; Flanagan B. M.; Halley P. J.; Whittaker A. K.; Gidley M. J. A method for estimating the nature and relative proportions of amorphous, single, and double-helical components in starch granules by C-13 CP/MAS NMR. Biomacromolecules 2007, 8, 885–891. 10.1021/bm060988a. [DOI] [PubMed] [Google Scholar]
- Bogracheva T. Y.; Morris V. J.; Ring S. G.; Hedley C. L. The granular structure of C-type pea starch and its role in gelatinization. Biopolymers 1998, 45, 323–332. . [DOI] [Google Scholar]
- Bogracheva T. Y.; Wang Y. L.; Hedley C. L. The effect of water content on the ordered/disordered structures in starches. Biopolymers 2001, 58, 247–259. . [DOI] [PubMed] [Google Scholar]
- Paris M.; Bizot H.; Emery J.; Buzaré J. Y.; Buleon A. Crystallinity and structuring role of water in native and recrystallized starches by C-13 CP-MAS NMR spectroscopy 1: Spectral decomposition. Carbohydr. Polym. 1999, 39, 327–339. 10.1016/S0144-8617(99)00022-3. [DOI] [Google Scholar]
- Tang H. R.; Hills B. P. Use of C-13 MAS NMR to study domain structure and dynamics of polysaccharides in the native starch granules. Biomacromolecules 2003, 4, 1269–1276. 10.1021/bm0340772. [DOI] [PubMed] [Google Scholar]
- Gidley M. J.; Bociek S. M. C-13-Cp-Mas, Nmr-Studies of Frozen-Solutions of (1 - 4)-Alpha-D-Glucans as a Probe of the Range of Conformations of Glycosidic Linkages - the Conformations of Cyclomaltohexaose and Amylopectin in Aqueous-Solution. Carbohydr. Res. 1988, 183, 126–130. 10.1016/0008-6215(88)80052-1. [DOI] [Google Scholar]
- Imberty A.; Chanzy H.; Pérez S.; Bulèon A.; Tran V. The Double-Helical Nature of the Crystalline Part of a-Starch. J. Mol. Biol. 1988, 201, 365–378. 10.1016/0022-2836(88)90144-1. [DOI] [PubMed] [Google Scholar]
- Wu H. C. H.; Sarko A. Packing Analysis of Carbohydrates and Polysaccharides .8. Double-Helical Molecular-Structure of Crystalline B-Amylose. Carbohydr. Res. 1978, 61, 7–25. [Google Scholar]
- Wu H. C. H.; Sarko A. Packing Analysis of Carbohydrates and Polysaccharides .9. Double-Helical Molecular-Structure of Crystalline a-Amylose. Carbohydr. Res. 1978, 61, 27–40. [Google Scholar]
- Imberty A.; Perez S. A Revisit to the 3-Dimensional Structure of B-Type Starch. Biopolymers 1988, 27, 1205–1221. 10.1002/bip.360270803. [DOI] [Google Scholar]
- Kubo A.; Yuguchi Y.; Takeniasa M.; Suzuki S.; Satoh H.; Kitamura S. The use of micro-beam X-ray diffraction for the characterization of starch crystal structure in rice mutant kernels of waxy, amylose extender, and sugary1. J. Cereal Sci. 2008, 48, 92–97. 10.1016/j.jcs.2007.08.005. [DOI] [Google Scholar]
- Nakamura Y.; Francisco P. B.; Hosaka Y.; Sato A.; Sawada T.; Kubo A.; Fujita N. Essential amino acids of starch synthase IIa differentiate amylopectin structure and starch quality between japonica and indica rice varieties. Plant Mol. Biol. 2005, 58, 213–227. 10.1007/s11103-005-6507-2. [DOI] [PubMed] [Google Scholar]
- Sano Y. Differential Regulation of Waxy Gene-Expression in Rice Endosperm. Theor. Appl. Genet. 1984, 68, 467–473. 10.1007/BF00254822. [DOI] [PubMed] [Google Scholar]
- Fujita N.Manipulation of Rice Starch Properties For Application; Springer, 2015. [Google Scholar]
- Fujita N.; Yoshida M.; Kondo T.; Saito K.; Utsumi Y.; Tokunaga T.; Nishi A.; Satoh H.; Park J.-H.; Jane J.-L.; Miyao A.; Hirochika H.; Nakamura Y. Characterization of SSIIIa-Deficient mutants of rice: The function of SSIIIa and pleiotropic effects by SSIIIa deficiency in the rice endosperm. Plant Physiol. 2007, 144, 2009–2023. 10.1104/pp.107.102533. [DOI] [PMC free article] [PubMed] [Google Scholar]
- Asai H.; Abe N.; Matsushima R.; Crofts N.; Oitome N. F.; Nakamura Y.; Fujita N. Deficiencies in both starch synthase IIIa and branching enzyme IIb lead to a significant increase in amylose in SSIIa-inactive japonica rice seeds. J. Exp. Bot. 2014, 65, 5497–5507. 10.1093/jxb/eru310. [DOI] [PMC free article] [PubMed] [Google Scholar]
- Tanaka N.; Fujita N.; Nishi A.; Satoh H.; Hosaka Y.; Ugaki M.; Kawasaki S.; Nakamura Y. The structure of starch can be manipulated by changing the expression levels of starch branching enzyme llb in rice endosperm. Plant Biotechnol. J. 2004, 2, 507–516. 10.1111/j.1467-7652.2004.00097.x. [DOI] [PubMed] [Google Scholar]
- Murakami S.; Fujita N.; Nakamura Y.; Inouchi N.; Oitome N. F.; Koda T.; Nishioka A. Effects of shear and milling treatment on molecular structures of rice starch. Starch - Stärke 2017, 70, 1700164 10.1002/star.201700164. [DOI] [Google Scholar]
- Miura S.; Crofts N.; Saito Y.; Hosaka Y.; Oitome N. F.; Watanabe T.; Kumamaru T.; Fujita N. Starch Synthase IIa-Deficient Mutant Rice Line Produces Endosperm Starch With Lower Gelatinization Temperature Than Japonica Rice Cultivars. Front. Plant Sci. 2018, 9, 645. 10.3389/fpls.2018.00645. [DOI] [PMC free article] [PubMed] [Google Scholar]
Associated Data
This section collects any data citations, data availability statements, or supplementary materials included in this article.


