

Abstract
Telomerase, a key enzyme involved in telomere homeostasis, is a major player involved in or required for sustained cell proliferation. It is expressed in ∼90% tumor but rarely in normal somatic cells. Therefore, telomerase serves as a diagnostic marker and therapeutic target of cancers. Although many methods are available for measuring telomerase activity, a convenient, fast, sensitive, and reliable method is still lacking for routine use in both clinics and research. Here, we present a single-enzyme sensitivity telomere repeat amplification protocol for quantifying telomerase activity. With multiple optimizations, the protocol pushes the ultimate detection limit down to a single telomerase complex, enabling measurement of telomerase activity of not only multiple cancerous/normal cell samples but also single cancer cells alone or even in the presence of 8000 normal cells. Implemented in a one-step mix-and-run format, the protocol offers a most sensitive, fast, accurate, and reproducible quantification of telomerase activity with linearity ranging from 20,000 HeLa cancer cells to a single telomerase complex. It requires minimal manual operation and experimental skill and is convenient for either low or high throughput of samples. We expect that the protocol should provide practical routine analyses of telomerase in both research and clinical applications. As an example, we demonstrate how telomerase activity evolves at the single-cell level and partitions in cell division in early mouse embryo development.
Introduction
Chromosomes in human cells are protected at their ends by telomeres composed of TTAGGG repetitive sequences and associated proteins. Telomere shortens during each round of cell division because of the end-replication problem. Such progressive telomere erosion, if not compensated, will eventually lead to cessation of cell division. Telomerase, a ribonucleoprotein enzyme, can add telomeric repeats to the 3′ end of telomere DNA.1 This enzyme plays an essential role in maintaining telomere length homeostasis in several important biological processes that require sustained cell proliferation, for example, carcinogenesis,2 embryonic development,3 and self-renewal of pluripotent stem cells.4 Telomerase is expressed in ∼85–95% of the tumor but rarely in somatic cells.5,6 Owing to its involvement in carcinogenesis, telomerase has long been considered a universal diagnostic marker and therapeutic target of cancers.7,8 On the other hand, telomerase is considered as a candidate to combat age-associated diseases.9 Transient enhancement or delivery of telomerase activity in cells10 brought promises to such applications. For these reasons, a routine telomerase assay should be extremely useful in healthcare and medicine.
Telomerase activity was detected in the early years by autoradiography of the isotope incorporated into the telomere extension product.11 Later, a telomere repeat amplification protocol (TRAP) was introduced, which used the polymerase chain reaction (PCR) to amplify the products elongated by telomerase.5 With greatly improved sensitivity, the TRAP has since become a common method for detecting telomerase activity. The original TRAP method has a few drawbacks that have led to modifications for improvement.12 The importance of the telomerase activity assay in biological and medical practice encouraged much effort in the improvement of available methods or development of new ones employing various biochemical, chemical, and physical technologies (for recent reviews, see refs12−16). For example, methods with single-cell sensitivity17,18 or capable of working with living cells19−21 have been reported. Although progress has been made, a robust method combining ease of operation, high throughput, and sensitivity, with applicability to both research and clinical practice is still in demand.
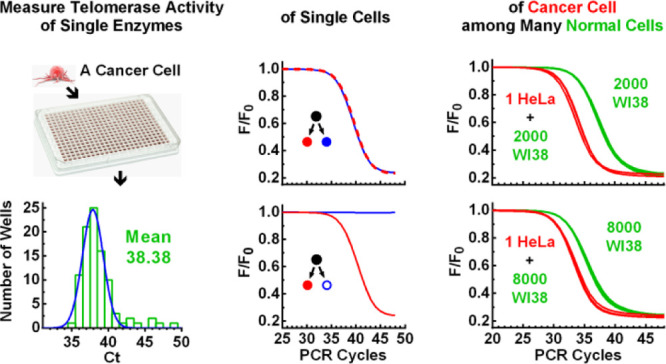
To meet such a demand, we developed a one-step mix-and-run PCR-based single-enzyme sensitivity telomere repeat amplification protocol (SES-TRAP) that is sensitive enough to detect the activity of a single telomerase complex physically separable by over-dilution. With such a superior sensitivity and flat background baseline, the SES-TRAP readily measures telomerase activity in cell populations, single cancer cells, and single telomerase complexes, without compromise in accuracy, dynamic range, reproducibility, flexibility in throughput, efficiency, convenience, and simplicity. Using this protocol, we were able to detect telomerase activity in normal human cells that were used to be considered as telomerase-negative and discriminate one single cancer cell from 8000 normal cells. To illustrate the single-cell applicability, we monitored the cellular lineage of changes in telomerase activity and telomerase activity partitioning at cell division in early mouse embryo development.
Results
Establishment of the SES-TRAP
The SES-TRAP was aimed to provide an accurate and sensitive but yet simple one-step mix-and-run protocol by using an all-in-one PCR solution, a fine-tuned and optimized blend of all ingredients needed to perform substrate extension, PCR amplification, and signal readout. Our SES-TRAP initially used the MTS22 and ACX23 primer with modifications. A 6-carboxyfluorescein amidite (FAM) dye and an iso-dC were attached to the 5′ end of the MTS (FMTS). In these assays, the FMTS was first extended in a multiwell plate by serially diluted lysate of HeLa cells that are telomerase-positive human cancerous cells. The extension products were then amplified by real-time PCR (RT-PCR) using the FMTS/ACX primer pair in the presence of Dabcyl-diGTP that, when incorporated into the amplicons, quenched the FAM (Figure 1A), resulting in a decrease in fluorescence with ongoing PCR cycles.24 This approach ensured that the fluorescent signal was inversely proportional to the copy number of the amplicons to avoid dependence on amplicon size, telomerase processivity, and staggered annealing between the ACX and the extension/amplicon product.23Figure 1B shows a representative assay with cell lysates starting from 12,000 down to 1 equiv cell per well. Threshold cycle (Ct) values were calculated as the number of PCR cycles required to quench 10% of the initial fluorescence as an indication of telomerase activity, which showed satisfactory linearity between 1 and 12,000 cells (Figure 1C). However, the assay was unable to discriminate the zero- and one-cell samples such that the sensitivity was limited to a few cells.
Figure 1.
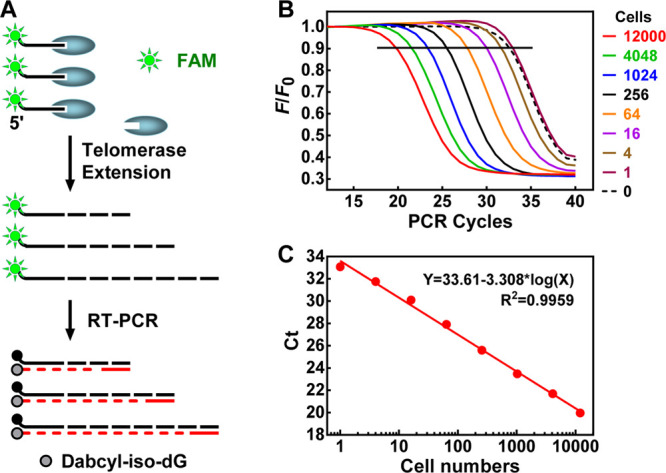
Measurements of telomerase activity by TRAP. (A) Primer extension by telomerase and fluorescence quenching in the PCR amplicon. Site-specific incorporation of dabcyl-iso-dGMP near the FAM dye in the upstream primer of the amplicons resulted in a decrease in fluorescence. (B) RT-PCR amplification of telomerase extension products produced by serially diluted HeLa cell lysate using the FMTS/ACX primer pair. The cell lysate was diluted to the indicated cell number equivalents shown at the right side of the panel. (C) Standard curve derived from panel B of telomerase activity (Ct) vs the cell number.
The background signal of the zero-cell sample suggested that the FMTS primer was incorporated into the amplicons during the later PCR cycles without being extended by telomerase because of the formation of primer dimers25 probably involving two wobble G/T base pairings (Figure S1).26 To overcome this problem, we extensively screened sequences and obtained an optimized telomerase substrate (FOTS) to use as an upstream primer without forming the wobble G/T base pairings (Figure S1). Figure 2A shows an assay of serially diluted cell lysates starting from 4000 down to 1.2 equiv cells per well. Zero-cell samples were used as telomerase-negative controls that showed almost no decrease in fluorescence accompanying the PCR cycles. In supporting of this, the zero-cell sample also showed no signal in polyacrylamide gel electrophoresis in the regular TRAP assay (Figure S2). This flat background PCR baseline made it easy to distinguish telomerase-positive samples from negative ones. A linear amplification was obtained in the whole dilution range, with an R2 value of 0.9977 (Figure 2B). The result demonstrated that the assay was sensitive enough to detect telomerase activity in a single HeLa cell. Using lysates from isolated nuclei, the measurement was significantly improved, resulting in wider linearity ranging from 20,000 down to 0.2 cells (Figure 2C,D). This improvement for larger cell numbers might be due to the removal of inhibitory compounds in the cytoplasm. Real samples in practice may significantly vary in cell numbers. The large range of linearity of the protocol should greatly ease sample handling.
Figure 2.
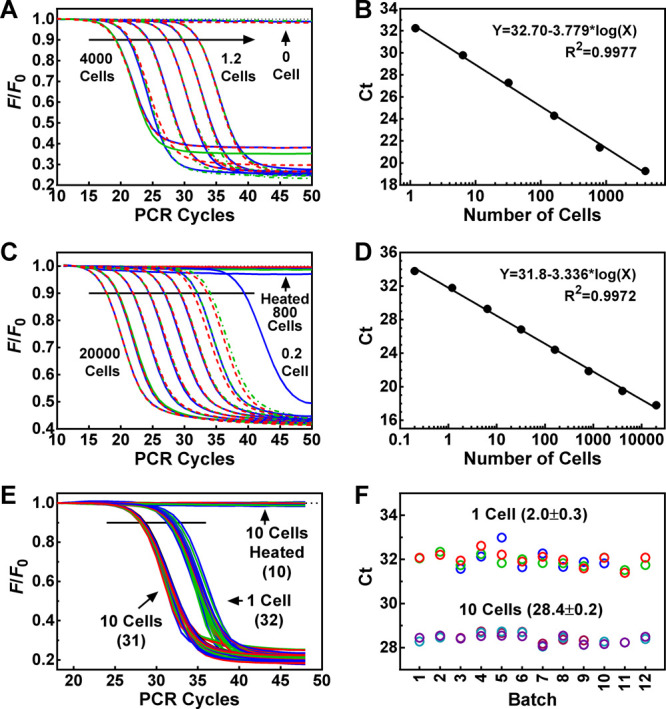
Measurements of telomerase activity in HeLa cells using the FOTS/ACX primer pair. (A) RT-PCR amplification of telomerase extension products produced by serially diluted cell lysate. Cell lysates were diluted to 4000, 800, 160, 32, 6.4, 1.2 cell equivalent and assayed for telomerase activity in triplets (red, green, and blue lines). (B) Standard curve derived from panel A of telomerase activity (Ct) vs cell number. (C,D) Same as (A,B) except that nuclei lysate (20,000, 4000, 800, 160, 32, 6.4, 1.2, 0.2 cell equivalent) was used. (E) Reproducibility of telomerase assays. Cell lysate stored at −80 °C was diluted to 1 or 10 cells. A total of 12 batches of assays were performed over 3 months at roughly equal time intervals with samples each in triplicate or duplicate. Numbers in parentheses indicate the total number of samples assayed. (F) Ct values derived from (E) with mean ± SD. Zero-cell or heat-inactivated cell lysates were used as telomerase-negative controls that all appeared as flat lines in the panels on the left side.
Reproducibility of the SES-TRAP
Given the improvement of the background signal, our following experiments were all carried out with the FOTS/ACX primer pair. To examine the reproducibility of the protocol, we prepared a HeLa cell lysate and stored 50,000 cell/mL aliquots at −80 °C. During a storage period of three months, 12 batches of assays were performed at weekly intervals using samples containing 1 cell and 10 cells diluted from the aliquots (Figure 2E). The results showed that the measurements resulted in a very small variation of the Ct values (Figure 2F), indicating that the protocol is reproducible, and telomerase activity can be reliably measured for long-term storage samples.
Measurement of Telomerase Activity in Single- and Multiple-Cell Samples
The high sensitivity and flat baseline of the assays prompted us to measure real single- and multiple-cell samples, for which a defined number of cells were collected into wells on a PCR plate by flow cytometry. Figure 3A gives the Ct values of single-cell, 10-cell, and 50-cell samples, respectively. It can be seen that the single HeLa cell samples feature a wide variation in their telomerase activities around an average of 31.8 Ct. When the number of cells increased to 10 and 50, the mean Ct values dropped to 28.5 and 25.7, respectively, with a much narrower variation as expected.
Figure 3.

Measurement of telomerase activity in multiple and single HeLa cell samples. Single or multiple cells were sorted into a multiwell PCR plate by a flow cytometer and telomerase assayed. (A) Single- and multiple-cell samples. (B) TERT-transfected single cells. Transfected cells expressed a TERT-EGFP (TERT+) or EGFP (TERT−) protein. (C) Single cells in different phases of a cell cycle. Distribution was fitted by a Gaussian function. The numbers above the bars indicate the mean Ct values.
To verify that the protocol truly detected telomerase activity, we expressed the TERT protein component of telomerase in the HeLa cells by transfection with a plasmid coding the TERT protein and assayed telomerase activity in single cells. In comparison with the cells transfected with a control vector, the TERT-expressing cells displayed much higher telomerase activity with a much smaller variation in the Ct values (Figure 3B).
Telomerase activity has been reported to vary during the cell cycle with the highest level in S-phase and lowest in the G2/M phase cells.27 Soon, it was found that telomerase activity does not vary with the cell cycle in dividing cells, and the variations in the former case might be caused by the toxic effects of the chemical compounds used.28 Because the two studies were conducted with a population of cells, we thought our single-cell measurement might provide more insight by resolving the distribution of telomerase activities among individual cells. The results in Figure 3C show that both the averaged value and distribution of telomerase activities did not show meaningful differences in the three phases of a cell cycle examined.
After seeing the ability to measure telomerase activity in single HeLa cells, three more cell lines were further tested (Figure S3). Of them, the U-2 OS showed a much lower activity (Ct = 40.6) than that of the HeLa cells (Ct = 31.8). The difference in the Ct values (8.8) between the two cell types implied that the telomerase activity in the U-2 OS was 28.8 (445)-fold lower than in the HeLa cells. Because it was reported that there are ∼240 (<445) active telomerase monomers per HeLa cell,29 such a result suggested that one U-2 OS cell contained less than one telomerase on average, and our protocol might detect the activity of a single telomerase complex.
Quantitation of the Number and Activity of Single Telomerase Complexes in Single HeLa Cells
The aforementioned results prompted our curiosity to determine the number and activity of telomerase enzymes. We prepared two cell lysate samples equivalent to one and two single HeLa cells, respectively, by serial dilution. Each sample was then further diluted into a 384-well PCR plate, and telomerase activity in each well was determined (Figure 4A). We found that the number of telomerase-positive wells was far smaller than the total number of wells on the plate. This fact suggested that physically separable telomerase enzymes were efficiently isolated into individual wells.
Figure 4.

Measurement of the number and activity of single telomerase by over-dilution. (A) Distribution of activity of single telomerase complexes. Two sets of cell lysate samples equivalent to one and two HeLa cells, respectively, were each diluted in a 384-well PCR plate, and telomerase activity in each well was measured. Three independent assays were conducted, giving a total of positive wells of 96 and 185, respectively, for the one cell and two cells. (B) Gaussian fitting of the Ct values from (A). Numbers in the panels indicate the mean Ct values. (C) Extension of linearity of the telomerase assay to single telomerase complexes. The mean reciprocal of the number of telomerase-positive wells and the corresponding Ct value from (B) were plotted (red and green point) along with a standard curve of Ct vs cell number (black points and line). Numbers beside the bars indicate the mean Ct values.
In three such measurements, the number of the telomerase-positive wells was 33, 33, and 30, respectively, for the 1 cell equivalents and 68, 58, and 59 for the 2 cell equivalents, resulting in an average of 32 (96/3) and 30.8 (185/6) positive wells per cell equivalent, respectively. From this, we derived that there are approximately 31 functional telomerase enzymes in one HeLa cell, on average. Regarding the number of telomerase molecules in human cells, it has been reported that there are 20–50 molecules of telomerase in a HEK-293 cell30 or ∼240 active telomerase monomers per HEK 293T or HeLa cell.29 Our result is consistent with the former report if one telomerase enzyme represented one telomerase molecule or consistent with the latter if one telomerase enzyme represented a complex involving multiple telomerase molecules. Because the variation in the Ct values was large, it was also possible that a telomerase enzyme was complexed with different regulatory proteins.31
We combined the Ct values from the three measurements and obtained an average Ct of 38.36 and 38.38, respectively for the one-cell and two-cell equivalents (Figure 4B). These two virtually identical numbers obtained by different folds of dilution indicated that the telomerase activities were physically fully separated, and each well represented a single telomerase complexed with other subunits, as previously described.31
The number of telomerase-positive wells gives the minimal fold of dilutions required to isolate the individual telomerase enzymes. Therefore, the reciprocal of the number of telomerase-positive wells represented the fraction of a single cell a positive well represented in terms of telomerase, which is 0.031 (1/32) and 0.032 (1/30.8) cell, respectively, for the one-cell and two-cell equivalents. When we plotted these two numbers against their average Ct (38.36 and 38.38), we found the two coordinate pairs overlapped well with the standard curve produced independently using the same cell lysate (Figure 4C). This result demonstrated that the linearity of the protocol could be extended down to the average of single telomerase complexes.
The distribution of Ct values in Figure 4B shows that the telomerase enzymes have a large variation in catalytic activity. It seemed that they could be classified into two groups: a major one at the lower Ct side that is well-fitted by a Gaussian function and a minor one at the higher Ct side without obvious features. Stochastic results are usually seen in PCR with a small number of templates. The limited number of templates that could be created by a single telomerase complex might contribute to the variation in the Ct values owing to the stochastic effect. We also performed an over-dilution for a mouse embryo fibroblast (MEF) cell line (Figure S4), which yielded an average of 0.54 telomerase enzyme per cell. A value of less than one suggested that telomerase was only expressed in a fraction of the MEF cells.
Telomerase Activity in Normal Fibroblast Cells
Normal somatic cells are usually regarded as telomerase-negative.5,6 For example, the WI-38 cell line has been used as a telomerase-negative control in telomerase assays.32 There was a possibility that telomerase activity was not detected in some normal cells because the previously available methods were not sensitive enough. Given the extremely high sensitivity of the SES-TRAP, we assayed WI-38 cells in the absence and presence of one HeLa cell equivalent (Figure 5). We found that telomerase activity was readily detected when the samples had more than 100 WI-38 cells (Figure 5A–E, green curves), indicating a presence of telomerase activity in the WI-38 cells. However, telomerase activity was not detected in a one WI-38 cell-equivalent (Figure 5E, blue dashed curves), implying that telomerase was only expressed in a very small fraction of the WI-38 cells.
Figure 5.

Telomerase activity in various numbers of normal human WI-38 fetal lung fibroblast cells in the absence and presence of a single HeLa cell. (A–E) RT-PCR amplification in the presence or absence of one HeLa cell and the indicated number of WI-38 cells. (F) Ct as a function of WI-38 cell numbers. Intersection (black arrowhead) shows that approximately 9200 WI-38 cells are equivalent to one HeLa cell in telomerase activity. Measurements were performed in triplicates. Fluorescence traces for the 8000 WI-38 heated cells (panel E) were slightly nudged down to avoid overlap with those of the “No Cell” and “1 WI38” samples.
The Ct values of the WI-38 samples were proportional to the number of cells in the samples (Figure 5F, green line). The interception of the fitted line with the Ct of the one HeLa cell equivalent indicated that approximately 9200 WI-38 cells were equivalent to one HeLa cell in telomerase activity (Figure 5F, black arrowhead). Because a HeLa cell contained only a few tens of telomerase enzymes that were far smaller than the number of 9200 WI-38 cells, it could then be deduced that a very small subpopulation of the WI-38 cells expressed telomerase in low quantity. When the assays for the WI-38 cells were conducted in the presence of one HeLa equivalent, the telomerase from HeLa became dominant and could still be distinguished when mixed with up to 8000 WI-38 cells (Figure 5A–D, red vs green curves). These results imply that the protocol may be used to identify tumor cells in samples containing an excess amount of normal cells.
Telomerase Activity in Single Cells during Early Mouse Embryo Development
To further demonstrate potential applications of the protocol, we measured telomerase activity in single mouse cells during the early embryo development (Figure 6A). Telomerase activity was readily detected in mature eggs, resulting in a Ct that is comparable to that in HeLa cells (Figure 6B). It started to decline until the four- and eight-cell stage at which both the average telomerase activity (Figure 6B) and the percentage of telomerase-positive cells (Figure 6C) reached the lowest level. Starting from this point, telomerase activity per cell and the percentage of telomerase-positive cells began to rise until the early blastocyst attachment stage. The timeline of this increase in telomerase activity correlated with the main wave of gene expression called mid-preimplantation gene activation,33 suggesting that telomerase activity was required from this stage onward for implantation and continued embryonic growth.
Figure 6.
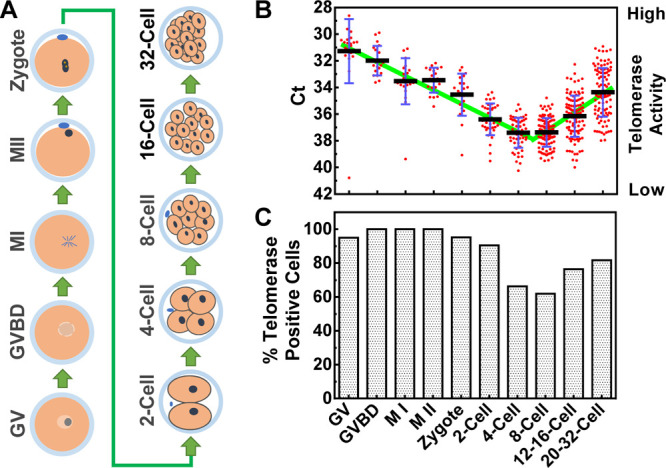
Analysis of telomerase activity of single cells during the early development of the mouse embryo. Single cells from multicell samples were isolated by pronase digestion and Ca2+ depletion. (A) Illustration of the lineage of embryo development. GV, germinal vesicle; GVBD, germinal vesicle breakdown, M I, metaphase I; M II, metaphase II. (B) Telomerase activities. Telomerase-negative cells were excluded. (C) Percent of telomerase-positive cells.
For the two-cell stage samples, we examined telomerase activities in each offspring. The results suggested both symmetric and asymmetric partitioning of telomerase activities during the cell division (Figure S5). The vast majority of the sister pairs showed differences of less than 1.7 Ct; two sister pairs displayed a complete loss of telomerase in one of the cells. In principle, a small difference in telomerase activity in a sister pair could be the result of asymmetric partitioning of the telomerase or difference in the freshly expressed telomerase after division or both. The telomerase divergence continued onward from the two-cell stage. We assayed four-cell and eight-cell stage samples, and the results are given in Figure 7 together with three representative results from the two-cell stage samples (Figure S5). From these results, we can see that an increased probability of loss of telomerase activity might contribute to the decline in the overall telomerase activity in the three stages. During this lineage, telomerase expression was turned off in some cells. In a technical aspect, it is impossible to obtain two cells with the same telomerase activity before a measurement. The detection of the symmetrical partitioning of telomerase activity in sister cell pairs illustrated the excellent reproducibility of the protocol.
Figure 7.

(A–I) Asymmetric partitioning or loss of telomerase activity in offspring observed at the two-cell, four-cell, and eight-cell stages. Sister cells were manually separated and each put in a well on a PCR plate and assayed for telomerase activities. The darkness of circles denotes the level of telomerase activity.
Discussion
By a combination of careful designing and optimization on the cell lysing, sample processing, and primer sequences, we established a most practical, sensitive, fast, accurate, quantitative, and reproducible protocol with a large range of linearity for the measurement of telomerase activity. The mix-and-run strategy greatly simplifies the operation and, most importantly, minimizes errors in sampling and the possibility of contaminations. In comparison with the currently available or reported methods (Table S1),12−14 the SES-TRAP is the first practical one that displays the most sensitive detection of telomerase activity at a single telomerase complex level so far. It reliably works at the population, cellular, and subcellular levels for telomerase-positive cells. The SES-TRAP also makes measurement possible in other types of cells, including normal cells, at a population, or single-cell level. The wide linearity and superior sensitivity of the SES-TRAP facilitate the measurement of samples with wide variation in cell numbers that are common in clinical practice. Taking advantage of the real-time PCR platform, the assays can be easily performed at a flexible throughput scale in both research and clinics.
The ability to reliably detect telomerase activity in single cells should assist the characterization and functional study of individual cells in heterogeneous cell populations. The lineage of changes in telomerase activity in the early development of mouse embryo indicated that telomerase expression is turned off in a fraction of cells but maintained in the others. This phenomenon may reflect the involvement of telomerase in embryonic differentiation, which deserves further exploration. Tumors accommodate highly heterogeneous cell populations with distinctive characteristics of clinical significance such as sensitivity to drugs and prediction of treatment outcome. The single-cell capability of the SES-TRAP may also be useful for identifying rare cells in a cell population that could not otherwise be detected by other telomerase assays. For instance, cancer stem cells and pluripotent stem cells may be identified from other cells in mixed populations. These rare cells may be more important than a bulky population. Measurement of telomerase activity in these cells should greatly help explore the functional roles they play. The capability of the SES-TRAP to measure telomerase activity in cells previously regarded as telomerase-negative also provides an opportunity to study the role of low telomerase expression in such cells.
The SES-TRAP should find potential applications in healthcare and clinics. For example, the detection of telomerase activity in tissue biopsy and circulating tumor cells in the blood may help diagnose cancer. Cancer stem cells sustain tumor growth and post-therapy relapse.34 Therefore, quantitative profiling of telomerase activity in general and detection/evaluation of cancer stem cells in particular by telomerase activity in a tumor cell population may provide crucial information regarding malignancy, metastasis, and patient outcome. Another example of such instances is the finding that liver stem cells, existing in a small amount and expressing high levels of telomerase, regenerate hepatocytes to repair an injured liver.35 Measurement of telomerase activity in and assessment of the abundance of such cells may help predict organ renewal and rejuvenation.
Conclusions
We established the most sensitive method that can measure the activity of a single telomerase complex at high throughput so far using the popular thermocyclers without compromise in accuracy, dynamic range, reproducibility, flexibility in throughput, efficiency, convenience, and simplicity. The method requires little technical skill and is easily applicable in both research and clinical applications such as diagnosis of cancer, evaluation/prediction of tumor malignancy, metastasis, patient outcome, and the assessment of organ renewal and rejuvenation.
Materials and Methods
DNA and PCR Reagent
PCR primers were purchased from Takara Biotechnology (Dalian, China). Their sequences (5′–3′) are as follows: FMTS, FAM-(iso-dC)-AGCATCCGTCGAGCAGAGTT;22 ACX, GCGCGG(CTTACC)3CTAACC; FOTS, FAM-(iso-dC)-CAGCATCCGTCACCGAGAGTT. 2× hot-start PCR solution was supplied by Telo-Quant Biotechnique (Tianjin, China). Dabcyl-iso-dGTP was synthesized as described.24
Cell Culture and Transfection
Hela, HeLa-S3, and WI-38 cells were cultured in Dulbecco’s modified Eagle’s medium (DMEM) containing 10% fetal bovine serum (FBS) at 37 °C with 5% CO2. HeLa-S3 cells were grown to 60–80% confluence in six-well plates before transfection. The CDS region of the TERT gene from NM_198253.2 was cloned into a pIRES2-EGFP vector between the EcoR I and Sma I sites to obtain a p-TERT-IRES2-EGFP. The transfection mixture contained 1 μg of p-TERT-IRES2-EGFP or control pIRES2-EGFP and 8 μL of lipofectamine 2000 (Invitrogen). Transfected cells were cultured at 37 °C for 24 h before being assayed for telomerase activity.
Preparation of the Cell Lysate
Cells cultured to 50–70% confluence were detached by treatment with 0.05% trypsin (Gibco). After the addition of DMEM containing 10% FBS, the cells were harvested by centrifugation at 500g for 5 min. The cells were then washed three times with phosphate-buffered saline (PBS), pH 7.4, and suspended in ice-cold suspension buffer [10 mM Tris-HCl, pH 7.5, 150 mM NaCl, 1.5 mM MgCl2, 0.5 mM 4-(2-aminoethyl)benzenesulfonyl fluoride hydrochloride (AEBSF)]. The cell suspension was slowly dispersed into two volumes of CHAPS lysis buffer [15 mM Tris-HCl, pH 7.5, 2 mM MgCl2, 1.5 mM EGTA, 0.75% CHAPS (w/v), 15% glycerol (v/v), 7.5 mM dithiothreitol (DTT), 0.75 mM AEBSF, 1.5 U/μL RNase inhibitor, and 0.6 mg/mL bovine serum albumin (BSA)]. After incubating on ice for 30 min, the cell lysate was centrifuged at 16,000g for 20 min. The supernatant was collected, aliquoted into PCR tubes, and stored at −80° C. Samples were thawed only once before use.
Preparation of the Nuclei Lysate
Cells were cultured and harvested as mentioned before and suspended in ice-cold suspension buffer containing 0.5% NP40, maintained on ice for 5–10 min during which the tubes were inverted six times at approximately equal intervals. Nuclei were collected by centrifugation of the suspension at 800g for 5 min and resuspended in the suspension buffer. The nuclei suspension was then slowly mixed with two volumes of CHAPS lysis buffer, and the mixture was left on ice for 30 min. The nuclei lysate was centrifuged at 16,000g for 20 min, and the supernatant was collected, dispensed, and stored as mentioned before.
Preparation of Single and Multiple Cell Samples by Flow Cytometry
Cells were cultured and harvested as mentioned before, and the cell pellet was suspended in DMEM containing 10% FBS. The suspension was centrifuged at 500g for 3 min and the pellet was then resuspended in PBS. For simple analyses, propidium iodide was added to the cell suspension at 1 μg/mL. For cell cycle-based analyses, the cell pellet was resuspended in prewarmed DMEM containing 2% FBS and 5 μg/mL Hoechst 33342, and the suspension was incubated at 37 °C for 20 min. Cells were sorted on a MoFlo XDP flow cytometer (Beckman) into a 384-well PCR plate preloaded with 1 μL of CHAPS lysis buffer per well. Samples were maintained on ice for 15 min before the telomerase assay.
Animals
Specific-pathogen-free mice were obtained from Beijing Vital River Laboratories and housed in the animal facilities of the Chinese Academy of Sciences. All of the studies were carried out in compliance with the Guidelines for the Use of Animals in Research issued by the Institute of Zoology, Chinese Academy of Sciences. Oocytes, zygotes, and embryos were collected from female CD-1 background mice.
Mouse Embryo Single-Cell Collection
For superovulation, 8 week-old female mice were injected with pregnant mare’s serum gonadotropin (PMSG) for 5 IU, followed by injection of human chorionic gonadotropin (hCG) 48 h later for the same dose. Germinal vesicle (GV), germinal vesicle breakdown (GVBD), metaphase I (MI) oocytes were collected from the chopped ovaries 48 h after PMSG injection. Metaphase II (MII) oocytes were collected from the oviducts of the female mice 16 h after hCG injection.
Zygotes (PN5), late two-cell, eight-cell embryos were collected at defined periods as described,36 except that the four-cell embryos, 10–16 morulas, 20–32 morulas were collected at 50, 75, and 85 h after hCG injection, respectively.
Embryos were treated with pronase solution (Sigma) and pipetted with a fine pulled-glass needle to remove the zona pellucida and incubate in the Ca2+-free Hepes-CZB medium for about 12 min to remove the polar body. To avoid contaminants, all oocytes were washed in the Hepes-CZB medium three times. Separated single cells were transferred into PCR tubes containing 2 μL of CHAPS lysis buffer and incubated on ice for 20 min.
Telomerase Activity Assay
Both telomerase extension and PCR were carried out in the same well in either 10 μL (384-well plate) or 20 μL (96-well plate) of RCR solution containing 20 mM Tris-HCl (pH 8.3), 1.5 mM MgCl2, 63 mM KCl, 0.2 mg/mL BSA, 1 mM DTT, 1 mM AEBSF, 0.2 U/μL RNase inhibitor (Thermo), 50 μM dNTP, 1 U Hemo klentaq DNA polymerase (NEB), 0.2 μM primers, and 2.5 μM dabcyl-diGTP with one-tenth of the total volume of the cell or nuclei lysate. The assays started with an extension reaction at 25 °C for 20 min followed by incubation at 94 °C for 2 min before 50 times of thermocycles of 94 °C 30 s, 57 °C 30 s, 72 °C 30 s on a QuantStudio 12K Flex RT-PCR System (Life Technologies, USA). Fluorescence was measured at the end of each cycle at 72 °C. Ct value was calculated as the number of PCR cycles required to quench 10% of the initial fluorescence.
Acknowledgments
This work was supported by the National Natural Science Foundation of China, grant number 21672212, 21432008, and 21708042, and Changzhi Medical College, LN201901.
Supporting Information Available
The Supporting Information is available free of charge at https://pubs.acs.org/doi/10.1021/acsomega.0c03246.
Comparisons of TRAP assay variants, Base-pairing at the 3′ end of potential self-dimer of the FMTS and FOTS primer, polyacrylamide gel electrophoresis, distribution of telomerase activity in single A549, H1975, and U-2 OS cells, activity distribution of single telomerase complexes detected in mouse embryo fibroblast (MEF) cells, asymmetric partitioning or loss of telomerase activity in offspring observed at the 2-cell stage of mouse embryo development (PDF)
Author Contributions
⊥ K.-w.Z. and C.L. equally to the work.
The authors declare no competing financial interest.
Supplementary Material
References
- Wu R. A.; Upton H. E.; Vogan J. M.; Collins K. Telomerase Mechanism of Telomere Synthesis. Annu. Rev. Biochem. 2017, 86, 439–460. 10.1146/annurev-biochem-061516-045019. [DOI] [PMC free article] [PubMed] [Google Scholar]
- Dogan F.; Biray Avci C. Correlation between telomerase and mTOR pathway in cancer stem cells. Gene 2018, 641, 235–239. 10.1016/j.gene.2017.09.072. [DOI] [PubMed] [Google Scholar]
- Zeng S.; Liu L.; Sun Y.; Xie P.; Hu L.; Yuan D.; Chen D.; Ouyang Q.; Lin G.; Lu G. Telomerase-mediated telomere elongation from human blastocysts to embryonic stem cells. J. Cell Sci. 2014, 127, 752–762. 10.1242/jcs.131433. [DOI] [PubMed] [Google Scholar]
- Liu L. Linking Telomere Regulation to Stem Cell Pluripotency. Trends Genet. 2017, 33, 16–33. 10.1016/j.tig.2016.10.007. [DOI] [PubMed] [Google Scholar]
- Kim N.; Piatyszek M.; Prowse K.; Harley C.; West M.; Ho P.; Coviello G.; Wright W.; Weinrich S.; Shay J. Specific association of human telomerase activity with immortal cells and cancer. Science 1994, 266, 2011–2015. 10.1126/science.7605428. [DOI] [PubMed] [Google Scholar]
- Shay J. W.; Bacchetti S. A survey of telomerase activity in human cancer. Eur. J. Cancer 1997, 33, 787–791. 10.1016/s0959-8049(97)00062-2. [DOI] [PubMed] [Google Scholar]
- Arndt G. M.; MacKenzie K. L. New prospects for targeting telomerase beyond the telomere. Nat. Rev. Cancer 2016, 16, 508–524. 10.1038/nrc.2016.55. [DOI] [PubMed] [Google Scholar]
- Xu Y.; Goldkorn A. Telomere and Telomerase Therapeutics in Cancer. Genes 2016, 7, 22. 10.3390/genes7060022. [DOI] [PMC free article] [PubMed] [Google Scholar]
- Boccardi V.; Paolisso G. Telomerase activation: a potential key modulator for human healthspan and longevity. Ageing Res. Rev. 2014, 15, 1–5. 10.1016/j.arr.2013.12.006. [DOI] [PubMed] [Google Scholar]
- Ramunas J.; Yakubov E.; Brady J. J.; Corbel S. Y.; Holbrook C.; Brandt M.; Stein J.; Santiago J. G.; Cooke J. P.; Blau H. M. Transient delivery of modified mRNA encoding TERT rapidly extends telomeres in human cells. FASEB J. 2015, 29, 1930–1939. 10.1096/fj.14-259531. [DOI] [PMC free article] [PubMed] [Google Scholar]
- Morin G. B. The human telomere terminal transferase enzyme is a ribonucleoprotein that synthesizes TTAGGG repeats. Cell 1989, 59, 521–529. 10.1016/0092-8674(89)90035-4. [DOI] [PubMed] [Google Scholar]
- Skvortsov D. A.; Zvereva M. E.; Shpanchenko O. V.; Dontsova O. A. Assays for detection of telomerase activity. Acta Naturae 2011, 3, 48–68. 10.32607/20758251-2011-3-1-48-68. [DOI] [PMC free article] [PubMed] [Google Scholar]
- Zhou X.; Xing D. Assays for human telomerase activity: progress and prospects. Chem. Soc. Rev. 2012, 41, 4643–4656. 10.1039/c2cs35045a. [DOI] [PubMed] [Google Scholar]
- Zhang X.; Lou X.; Xia F. Advances in the detection of telomerase activity using isothermal amplification. Theranostics 2017, 7, 1847–1862. 10.7150/thno.18930. [DOI] [PMC free article] [PubMed] [Google Scholar]
- Wang L.-j.; Ma F.; Tang B.; Zhang C.-y. Sensing telomerase: From in vitro detection to in vivo imaging. Chem. Sci. 2017, 8, 2495–2502. 10.1039/c6sc04801c. [DOI] [PMC free article] [PubMed] [Google Scholar]
- Yang B.; Shi L.; Lei J.; Li B.; Jin Y. Advances in optical assays for detecting telomerase activity. Luminescence 2019, 34, 136–152. 10.1002/bio.3595. [DOI] [PubMed] [Google Scholar]
- Wang D.; Zhang Y.; Zhao X.; Xu Z. Plasmonic colorimetric biosensor for visual detection of telomerase activity based on horseradish peroxidase-encapsulated liposomes and etching of Au nanobipyramids. Sens. Actuators, B 2019, 296, 126646. 10.1016/j.snb.2019.126646. [DOI] [Google Scholar]
- Li X.; Cui Y.; Du Y.; Tang A.; Kong D. Label-Free Telomerase Detection in Single Cell Using a Five-Base Telomerase Product-Triggered Exponential Rolling Circle Amplification Strategy. ACS Sens. 2019, 4, 1090–1096. 10.1021/acssensors.9b00334. [DOI] [PubMed] [Google Scholar]
- Fan H.; Bai H.; Liu Q.; Xing H.; Zhang X.-B.; Tan W. Monitoring Telomerase Activity in Living Cells with High Sensitivity Using Cascade Amplification Reaction-Based Nanoprobe. Anal. Chem. 2019, 91, 13143–13151. 10.1021/acs.analchem.9b03410. [DOI] [PubMed] [Google Scholar]
- Wang X.; Yang D.; Liu M.; Cao D.; He N.; Wang Z. Highly sensitive fluorescence biosensor for intracellular telomerase detection based on a single patchy gold/carbon nanosphere via the combination of nanoflare and hybridization chain reaction. Biosens. Bioelectron. 2019, 137, 110–116. 10.1016/j.bios.2019.05.004. [DOI] [PubMed] [Google Scholar]
- Ye S.; Wu Y.; Wan F.; Li Y. A seesaw ratiometric probe for dual-spectrum imaging and detection of telomerase activity in single living cells. Chem. Commun. 2019, 55, 9967–9970. 10.1039/c9cc03870a. [DOI] [PubMed] [Google Scholar]
- Szatmari I.; Aradi J. Telomeric repeat amplification, without shortening or lengthening of the telomerase products: a method to analyze the processivity of telomerase enzyme. Nucleic Acids Res. 2001, 29, 3e. 10.1093/nar/29.2.e3. [DOI] [PMC free article] [PubMed] [Google Scholar]
- Kim N.; Wu F. Advances in quantification and characterization of telomerase activity by the telomeric repeat amplification protocol (TRAP). Nucleic Acids Res. 1997, 25, 2595–2597. 10.1093/nar/25.13.2595. [DOI] [PMC free article] [PubMed] [Google Scholar]
- Sherrill C. B.; Marshall D. J.; Moser M. J.; Larsen C. A.; Daudé-Snow L.; Prudent J. R.; Shapiro G.; Prudent J. R. Nucleic acid analysis using an expanded genetic alphabet to quench fluorescence. J. Am. Chem. Soc. 2004, 126, 4550–4556. 10.1021/ja0315558. [DOI] [PubMed] [Google Scholar]
- Fajkus J. Detection of telomerase activity by the TRAP assay and its variants and alternatives. Clin. Chim. Acta 2006, 371, 25–31. 10.1016/j.cca.2006.02.039. [DOI] [PubMed] [Google Scholar]
- Kneale G.; Brown T.; Kennard O.; Rabinovich D. G T base-pairs in a DNA helix: the crystal structure of d(G-G-G-G-T-C-C-C). J. Mol. Biol. 1985, 186, 805–814. 10.1016/0022-2836(85)90398-5. [DOI] [PubMed] [Google Scholar]
- Zhu X.; Kumar R.; Mandal M.; Sharma N.; Sharma H. W.; Dhingra U.; Sokoloski J. A.; Hsiao R.; Narayanan R. Cell cycle-dependent modulation of telomerase activity in tumor cells. Proc. Natl. Acad. Sci. U.S.A. 1996, 93, 6091–6095. 10.1073/pnas.93.12.6091. [DOI] [PMC free article] [PubMed] [Google Scholar]
- Holt S. E.; Aisner D. L.; Shay J. W.; Wright W. E. Lack of cell cycle regulation of telomerase activity in human cells. Proc. Natl. Acad. Sci. U.S.A. 1997, 94, 10687–10692. 10.1073/pnas.94.20.10687. [DOI] [PMC free article] [PubMed] [Google Scholar]
- Xi L.; Cech T. R. Inventory of telomerase components in human cells reveals multiple subpopulations of hTR and hTERT. Nucleic Acids Res. 2014, 42, 8565–8577. 10.1093/nar/gku560. [DOI] [PMC free article] [PubMed] [Google Scholar]
- Cohen S. B.; Graham M. E.; Lovrecz G. O.; Bache N.; Robinson P. J.; Reddel R. R. Protein composition of catalytically active human telomerase from immortal cells. Science 2007, 315, 1850–1853. 10.1126/science.1138596. [DOI] [PubMed] [Google Scholar]
- Hukezalie K. R.; Wong J. M. Y. Structure-function relationship and biogenesis regulation of the human telomerase holoenzyme. FEBS J. 2013, 280, 3194–3204. 10.1111/febs.12272. [DOI] [PubMed] [Google Scholar]
- Trujillo K. A.; Hines W. C.; Vargas K. M.; Jones A. C.; Joste N. E.; Bisoffi M.; Griffith J. K. Breast field cancerization: isolation and comparison of telomerase-expressing cells in tumor and tumor adjacent, histologically normal breast tissue. Mol. Cancer Res. 2011, 9, 1209–1221. 10.1158/1541-7786.mcr-10-0424. [DOI] [PMC free article] [PubMed] [Google Scholar]
- Bell C. E.; Calder M. D.; Watson A. J. Genomic RNA profiling and the programme controlling preimplantation mammalian development. Mol. Hum. Reprod. 2008, 14, 691–701. 10.1093/molehr/gan063. [DOI] [PMC free article] [PubMed] [Google Scholar]
- Beck B.; Blanpain C. Unravelling cancer stem cell potential. Nat. Rev. Cancer 2013, 13, 727–738. 10.1038/nrc3597. [DOI] [PubMed] [Google Scholar]
- Lin S.; Nascimento E. M.; Gajera C. R.; Chen L.; Neuhöfer P.; Garbuzov A.; Wang S.; Artandi S. E. Distributed hepatocytes expressing telomerase repopulate the liver in homeostasis and injury. Nature 2018, 556, 244–248. 10.1038/s41586-018-0004-7. [DOI] [PMC free article] [PubMed] [Google Scholar]
- Du Z.; Zheng H.; Huang B.; Ma R.; Wu J.; Zhang X.; He J.; Xiang Y.; Wang Q.; Li Y.; Ma J.; Zhang X.; Zhang K.; Wang Y.; Zhang M. Q.; Gao J.; Dixon J. R.; Wang X.; Zeng J.; Xie W. Allelic reprogramming of 3D chromatin architecture during early mammalian development. Nature 2017, 547, 232–235. 10.1038/nature23263. [DOI] [PubMed] [Google Scholar]
Associated Data
This section collects any data citations, data availability statements, or supplementary materials included in this article.