

Abstract

Sulfonated solid acid materials, such as sulfonated carbon catalysts, are promising materials as heterogeneous catalysts for the hydrolysis of esters and polysaccharides in water solvents. The catalytic active site is a sulfonic acid functional group. Compared to conventional strong acidic ion-exchange resin catalysts, sulfonated carbon materials have less sulfonic acid functional groups but higher catalytic activity for hydrolysis of polysaccharides per catalyst weight. However, the details of catalytic properties and the substrate suitability of both catalysts are unclear. In this study, the hydrolytic activities and the adsorption properties of both catalysts were investigated for various oligosaccharides and polysaccharides with varying degrees of polymerization (DP). The catalytic activities for the hydrolysis with increase of the DP of saccharides were found to increase over the sulfonated carbon catalyst but decrease over strong acidic ion-exchange resin catalyst. The inverse catalytic properties attribute to the dependence of the amounts of adsorption and/or penetration of saccharides on the DP. Moreover, the catalytic activity per acidic sites of strong acidic ion-exchange resin is in good agreement with the value obtained by multiplying the catalytic activity of a dilute sulfuric acid by the penetration degrees.
Introduction
Biomass resources are renewable and promising as a sustainable chemical resource for fuels and intermediates.1−3 Polysaccharides are the largest biomass component. Estimates indicate that more than 90% of the carbohydrate mass in nature exist in the form of polysaccharides.4 Many researchers have studied the conversion of polysaccharides into monosaccharides. Conventionally, mineral acids5,6 and enzymes7 are used for the hydrolysis of polysaccharides. However, mineral acids entail difficulties of product separation, the necessity of waste effluent treatment, reactor corrosion, and the further degradation of monosaccharide. Enzymatic methods are adversely affected by the high cost of enzymes, slow reaction rates, and high substrate selectivity. Therefore, various solid acids with strong and/or weak acidic sites have been investigated for use in the hydrolysis of polysaccharides.8−32 Recently, sulfonated carbon catalysts have attracted attention.9,10 The first sulfonated carbon catalysts were reported by Hara et al.33 They prepared a carbonaceous catalyst by sulfonation of incompletely carbonized sugars. The sulfonated carbon materials showed catalytic activities for the hydrolysis of esters and hydrolytic depolymerization of cellulose under aqueous media by many groups.11−17 A sulfonated activated carbon (AC-SO3H) catalyst pretreated under hydrothermal conditions at 200 °C and its catalytic activity for conversion of ball-milled cellulose into glucose under hydrothermal conditions at 150 °C also were reported.11,17 Such sulfonated carbon catalysts were shown also for hydrolysis of various polysaccharides such as starch17−21 and hemicellulose.22−25 However, to develop environmentally friendly processes for biomass conversions, the sulfonated carbon catalysts are demanded to improve catalytic activity.
Amberlyst and Amberlite resins, which are commercially available ion exchange resin, have sulfonic acid groups, similarly to the sulfonated carbon catalysts.9 Amberlyst 70 used in this study has a macroporous structure of styrene–divinylbenzene copolymers. It has high thermal stability among Amberlyst and Amberlite resins.34−37 Typical Amberlyst resins have 2.5–5.4 mmol g–1 of sulfonic acid groups,37 whereas the sulfonated carbon catalysts have 0.05–5.7 mmol g–1 of sulfonic acid groups.9 However, for cellulose hydrolysis, the catalytic activity of AC-SO3H catalyst was found to be significantly higher than that of Amberlyst resin catalysts.11,12 The sulfonated activated carbon catalyst showed higher activity than the Amberlyst catalysts, probably because of the adsorption phenomenon. Because the adsorption behavior of glucose and oligosaccharides on carbon materials are becoming clear38−41 but little is known about the adsorption and penetration behavior on the Amberlyst catalysts, the relevant details have not been elucidated. By clarifying the reason, it is expected that knowledge to enhance the activity of the sulfonated solid acid catalysts will be obtained.
This study investigated relations between the adsorption properties and the catalytic activities to clarify the reasons for which the sulfonated activated carbon catalyst showed higher activity than the Amberlyst catalyst. For several oligosaccharides and starch with varying degrees of polymerization, the surface concentrations of saccharides for both catalysts were estimated by the adsorption amounts with HPLC methods and the penetration amounts with phenol–sulfuric acid method. In addition, the catalytic activities and the catalytic mechanism for hydrolysis of the saccharides over both catalysts were examined kinetically using the surface concentrations of the saccharides.
Experimental Section
Materials
Activated carbon (AC) was purchased from Wako Pure Chemical Industries. Amberlyst 70 was purchased from Organo Corp. Concentrated (95%) sulfuric acid, tetramethylammonium bromide, tetrabutylammonium bromide, sodium azide, and sodium nitrate were purchased from Wako Pure Chemical Industries. 1 M HCl, 1 M NaOH, and 1 M NaCl were purchased from Wako Pure Chemical Industries. d-glucose, d-maltose, d-maltotriose, d-cellobiose, and starch (soluble) were purchased from Wako Pure Chemical Industries. Starch (soluble) is a low molecular weight polysaccharide with an average degree of polymerization (DP) of 30. Maltotetraose, maltopentaose, and cellopentaose were purchased from Hayashibara Corp. Xylobiose, d-trehalose, and d-lactose were purchased from Tokyo Chemical Industry.
Catalyst Synthesis and Pretreatment
We prepared a sulfonated activated carbon (AC-SO3H) catalyst by sulfonation of commercially available activated carbon (AC) powder (1.0 g) with concentrated sulfuric acid (20 mL) at 150 °C for 16 h under flowing Ar (40 mL/min).11,42 After repeated washing with 3 L of distilled water at 80 °C, the obtained powder was pretreated hydrothermally at 200 °C for 3 h using a Teflon-lined autoclave (100 mL) to prevent elution of SO42– ions during catalytic reactions under hydrothermal conditions at 120 °C. Then, it was washed again until sulfate ions were no longer detected in the wash water, and it was dried at 100 °C. Amberlyst 70 was dried at 100 °C for 6 h under flowing Ar (50 mL/min).
Catalyst Characterization
AC-SO3H and Amberlyst 70 were characterized by titration, CHNS elemental analysis, N2 adsorption, and TG-DTA measurements. In titration methods developed by Boehm,43 5, 10, and 20 mg of catalyst were added to 20 mL aqueous solution of sodium hydroxide to ascertain the total surface acidic sites and to sodium chloride, tetramethylammonium bromide (TMA-Br), and tetrabutylammonium bromide (TBA-Br) to ascertain the strong acid functional groups. The chemical compositions of catalysts were found using CHNS elemental analysis (vario MACRO cube; Elementar). N2 adsorption/desorption isotherms were measured with a gas adsorption measurement (MicrotracBEL Corp., BELSORP-max). Before measurements, samples were dried at 100 °C for 4 h. The total surface area was calculated using the Brunauer–Emmett–Teller (BET) method. Pore size distributions were calculated from the adsorption data using the Grand Canonical Monte Carlo (GCMC) model for N2 adsorption at 77 K on carbon materials with slit pore structures (MicrotracBEL Corp.).44,45 According to the N2 adsorption/desorption isotherm of AC-SO3H (Figure S1), its pore structure was confirmed to be slit type. The saturated water contents were quantified using a thermogravimetric method (TG/DTA6200; Seiko Corp.) in the following manner. Before the TG measurement, first, 2 mL of water was warmed to 40 °C under air in an electric heating incubator (Sanyo Corp.). Then, 20 mg of catalyst was dispersed in water at 40 °C for 30 min. The suspension was hot-filtrated with a glass fiber filter. A part of the wet catalysts was immediately moved onto a platinum pan. The weight loss of the wet catalysts was found using a TG analyzer under flowing N2, as shown in Figure S2. The errors were within ±2%.
Saccharide Adsorption and Saccharide Penetration
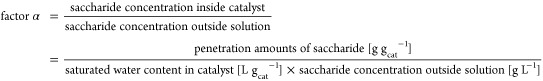
Saccharide adsorption and penetration properties of catalysts were ascertained using HPLC and the phenol–sulfuric acid method, respectively. Before adsorption, the saccharide aqueous solution was warmed to 40 °C and kept constant at 40 °C with stirring under air in an electric heating incubator (Sanyo Corp.). A certain amount of catalyst was introduced into the saccharide aqueous solution and stirred at 40 °C for a certain time between 1.0 min and 6 h. The mixture at 40 °C was then hot filtrated with a glass fiber filter. We carried out the adsorption experiments at 40 °C because 40 °C meets the following requirement conditions: almost no reaction occurs even on AC-SO3H an Amberlyst 70, it is easy to adjust the same and constant temperature always, and a usual magnetic stirrer can be used. The filtrate solution was analyzed by an HPLC method (HLC-8320GPC; Tosoh Corp.) for the mobile phase of 50 mM NaNO3 containing 0.02% NaN3 aqueous solution, RI detector, and a column (OHpak SB-804 HQ; Shodex) at 30 °C. A TOC analyzer (TOC-VCPN; Shimadzu Corp.) was also used to determine organic carbon in the filtrate solution, and it was confirmed that the values corresponded to those by the HPLC method. The filtrated catalyst was dried at 40 °C overnight. Saccharide content in the catalyst was analyzed using the phenol–sulfuric acid method46,47 as follows: 2 mg of catalyst was introduced into a test tube. Then, 0.5 mL of 5% phenol aqueous solution was added rapidly. Subsequently, 2.5 mL of concentrated sulfuric acid was added immediately. The sample absorbance was measured using a UV spectrophotometer at 490 nm (UV-1800; Shimadzu Corp.). The saccharide concentration in catalysts was estimated using the adsorption or penetration amounts of saccharide and the saturated water content as follows:
The penetration degree was evaluated as factor α. Factor α was calculated as follows:
 |
Saccharide Hydrolysis
The catalytic reactions were conducted in a closed reactor at 120 °C. Saccharides, catalysts, and water were introduced into a 10 mL glass reactor under air at ambient pressure. The reactor was closed and heated at 120 °C for 5 min–24 h in an oil bath while stirring with 350 rpm. After the reactions, the reaction mixtures were filtered. Then, the filtrate solution was analyzed using an HPLC system for the mobile phase of 5 mM H2SO4 aqueous solution with an RI detector (L-2490; Hitachi Ltd.), a UV–vis detector (L-2420; Hitachi Ltd.) and a column (RSpak KC-811; Shodex) at 40 °C and a GPC (HLC-8320GPC; Tosoh Corp.) for the mobile phase of 50 mM NaNO3 containing 0.02% NaN3 aqueous solution with an RI detector and a column (OHpak SB-804 HQ; Shodex) at 30 °C. Total concentrations of water-soluble organic compounds (WSOCs) in the resultant solutions were found using a TOC analyzer. Product yields were calculated as shown below.
In this study, the reaction rates were considered from the initial glucose production rates because the decrease amounts of oligosaccharides determined by HPLC were the sum of conversion and adsorption. Initial glucose production rates [h–1] over catalysts were calculated using the time courses of glucose productions [mol gcat–1 h–1] and the molar amounts of sulfonic acid in the catalysts [mol gcat–1].
Results and Discussion
As solid acid catalysts for the hydrolysis of saccharides, AC-SO3H and Amberlyst 70 both have sulfonic acid functional groups and aromatic ring-based networks or pores. On the other hand, the main differences are considered to be the concentration of the sulfonic acid functional groups and the accessibility of saccharides to the sulfonic acid functional groups. Therefore, first, the concentrations of sulfonic acid functional groups and the other acidic functional groups were estimated by the titration methods using NaCl, NaOH, and larger probe such as tetrabutylammonium ions. Next, nitrogen adsorption and sugar adsorption experiments were conducted. Then, we will discuss the numbers of sulfonic acid functional groups accessible to the substrate and the substrate concentration near the catalytically active site.
The acid site densities of AC-SO3H and Amberlyst 70 catalysts were found using a titration method. Table 1 presents the sulfonic acid groups determined using NaCl were 0.4 and 2.4 mmol g–1 for AC-SO3H and Amberlyst 70 catalysts, respectively, which were almost identical as S contents estimated from CHNS elemental analysis of 0.4 and 2.2 mmol g–1 for AC-SO3H and Amberlyst 70 catalysts. The total acid sites found using NaOH were, respectively, 3.0 and 2.5 mmol g–1 for AC-SO3H and Amberlyst 70 catalysts. These results indicate that the acid sites of Amberlyst 70 catalysts were almost exclusively sulfonic acid functional groups to be about 2.4 mmol g–1, whereas the AC-SO3H catalyst had about 0.4 mmol –1 of sulfonic acid functional groups and about 2.6 mmol g–1 of other weakly acidic functional groups, such as phenolic hydroxyl, lactone, and carboxy groups.
Table 1. Acid Site of AC-SO3H and Amberlyst 70.
| contenta | acid
site |
||||
|---|---|---|---|---|---|
| catalyst | S (mmol g–1) | NaClb (mmol g–1) | NaOHc (mmol g–1) | TMA-Br (mmol g–1) | TBA-Br (mmol g–1) |
| AC | 0.0 | 0.01 | 0.8 | 0.02 | 0.08 |
| AC-SO3H | 0.4 | 0.43 | 3.0 | 0.43 | 0.64 |
| Amberlyst 70 | 2.2 | 2.4 | 2.5 | 2.5 | 2.4 |
S contents estimated from CHNS elemental analysis.
Strong acid sites found using a NaCl titration method.
Total acid sites found using a NaOH titration method.
To estimate the amounts of the sulfuric acid functional groups accessible to oligosaccharides, titrations using tetramethylammonium bromide (TMA-Br) and tetrabutylammonium bromide (TBA-Br) were conducted. The molecular sizes of maltose and maltopentaose calculated using the molecular dynamics method were, respectively, about 1.0 nm × 0.6 nm × 0.4 nm and about 2.2 nm × 0.6 nm × 0.4 nm. The maltose sizes were similar to those of cellobiose reported earlier (1.1 nm × 0.7 nm × 0.4 nm).39 Therefore, the effective molecular diameters of maltose and maltopentaose were estimated as equal to or smaller than that of the TBA ion calculated using the molecular dynamics method at approximately 1.0 nm. As Table 1 shows, the consumption amounts of TMA and TBA cations were, respectively, about 0.43 and 0.64 mmol g–1 for the AC-SO3H catalyst, and about 2.5 and 2.4 mmol g–1, respectively, for Amberlyst 70. For both catalysts, the active sites estimated using TMA-Br and TBA-Br were roughly the same as those determined using NaCl in Table 1. However, AC-SO3H consumed TBA cations in a larger amount than TMA cations. Because the produced H-Br was determined by neutralization in the titration experiments, a part of TBA cations might exchange with parts of weakly acidic functional groups or might adsorb electrostatically on the carbon surface. So, parent AC with 0.8 mmol g–1 of weakly acidic functional groups was also used for the titration experiments. Then, the AC consumed 0.02 mmol g–1 of TMA cations and 0.08 mmol g–1 of TBA cations, which corresponded to 2.5 and 10% of weakly acidic functional groups on the AC, respectively. Subtracting the AC results from the AC-SO3H results, the amounts of sulfonic acid functional groups found using TMA-Br and TBA-Br were both about 0.4 and 0.5 mmol g–1 for AC-SO3H catalyst. The results suggested that TMA and TBA cations were accessible to almost all sulfonic acid functional groups of both catalysts, which suggested that most of the sulfonic acid functional groups were located at extra surface, macro- and mesopores, and/or micropores larger than a size of TBA cation. The results demonstrated that the oligosaccharides can have access to almost all sulfonic acid functional groups of both catalysts.
The BET surface area, pore volume, and pore size were estimated using N2 adsorption–desorption isotherms for the AC-SO3H catalyst (Table 2 and Figure S1). For Amberlyst 70 catalyst, data from the supplier are also presented in Table 2.35,36 Surface areas of AC-SO3H and Amberlyst 70 were, respectively, 1.0 × 10³ m2 g–1 and about 36 m2 g–1. The pore volumes of AC-SO3H and Amberlyst 70 were, respectively, 0.84 cm3 g–1 and about 0.002 cm3 g–1. The pore size distribution of AC-SO3H and parent AC is shown in Figure S3. The average pore sizes of AC and AC-SO3H were about 3 nm and 2 nm, respectively. The average pore size of Amberlyst 70 was about 22 nm. Those pore sizes were larger than the diameter of oligosaccharides such as maltose and maltopentaose. The findings from the N2 adsorption and the titration indicate that the oligosaccharides can have access to almost all sulfonic acid functional groups of both catalysts.
Table 2. Textural Properties of AC-SO3H and Amberlyst 70.
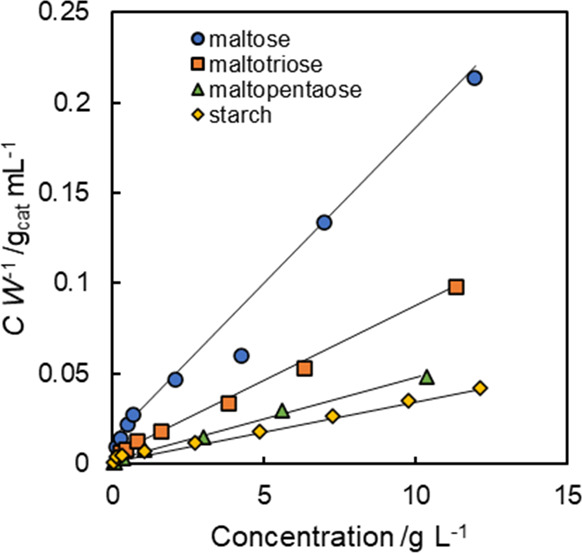
The saturated water contents of both catalysts were found using a thermogravimetric method after the AC-SO3H and Amberlyst 70 catalysts were removed from water. Figure S2 portrays thermogravimetry diagrams of the AC-SO3H (a) and Amberlyst 70 (b). The wet AC-SO3H and Amberlyst 70 catalysts respectively lost 41 and 45% weights under air flow at 100 °C for 10 h. Furthermore, as shown in Figure S2, when the temperature increased to 300 °C, almost no weight loss was observed for both catalysts. From those results, the saturated water contents of AC-SO3H and Amberlyst 70 catalysts were estimated respectively as 1.4 and 1.3 mL g–1. Both saturated water contents were larger than the total pore volume found by N2 adsorption–desorption isotherms of both catalysts. That result might be attributable to the macropores, which were not measured as pores using the N2 adsorption method, or the swelling properties of the catalysts in water. The adsorption amounts of maltose, maltotriose, maltopentaose, and starch at 40 °C were estimated from decreases in the saccharide concentrations in the solutions. As presented in Figure 1, for all substrates, AC-SO3H showed large amounts of adsorption. The adsorption amounts increased concomitantly with increase of the concentrations less than 5 g L–1. The adsorption amounts were almost identical over 5 g L–1 of the concentrations. However, the adsorption amounts of saccharides on Amberlyst 70 were negative, suggesting that almost no adsorption of saccharides on Amberlyst 70 occurred. The results also suggest that the negative values might mean that saccharide concentrations in the solutions increased because water entered the Amberlyst 70 selectively.
Figure 1.

Adsorption isotherm of malto-oligosaccharides and starch on (a) AC-SO3H and (b) Amberlyst 70. Adsorption conditions: saccharides 0.5–10 mg, catalyst 20 mg, distilled water 2 mL at 40 °C for 30 min.
Earlier reports have also described similar adsorption behavior of glucans on carbons and assigned them as isotherms of Langmuir type.38,39 Although this experimental condition does not look at the definition of Langmuir adsorption theory, it is reported that in many cases of the similar liquid-phase adsorption behavior with saturated adsorption the isothermal adsorption followed Langmuir’s equation (eq 1).38,48 Then, Wmax of eq 1 was taken as the adsorption capacity at 40 °C.
| 1 |
where C (g L–1) is the concentration of saccharides, W (mg g–1) is the specific adsorption amount, Wmax (mg g–1) is the adsorption capacity, and Kads (L g–1) is a constant related to the adsorption equilibrium. The Langmuir plot of AC-SO3H shown in Figure 2 was linear for all tested saccharides, which was apparently similar to Langmuir type I. Table 3 presents the determined Wmax and Kads. The values of Wmax increased from 41 to 2.1 × 10² with the increase of the degree of polymerization (DP) of saccharides. The values of Kads also increased from 6.8 × 10² to 5.6 × 10³ with the increase of DP. Earlier reports have described that Wmax and Kads increased concomitantly with the increase of DP in β-1,4-glucan adsorption on carbon materials.39,40
Figure 2.
Langmuir plots of malto-oligosaccharides and starch on AC-SO3H. Adsorption conditions: 0.5–10 mg saccharides, 20 mg catalyst, and 2 mL distilled water at 40 °C for 30 min.
Table 3. Langmuir Parameters for the Adsorption of Malto-Oligosaccharide and Starch onto AC-SO3H at 40 °Ca.
| saccharides | DP | Wmax/g L–1 | Kads/M–1 |
|---|---|---|---|
| maltose | 2 | 41 | 6.8 × 10² |
| maltotriose | 3 | 86 | 9.7 × 10² |
| maltopentaose | 5 | 1.5 × 10² | 2.6 × 10³ |
| starch | 30 | 2.1 × 10² | 5.6 × 10³ |
Adsorption conditions: 0.5–10 mg saccharides, 20 mg catalyst, 2 mL distilled water at 40 °C for 30 min.
Figure 1 shows that saccharides were not adsorbed onto Amberlyst 70. Then, Amberlyst 70 was removed from the saccharide aqueous solutions after the adsorption experiments. The penetration amounts of saccharides included in the Amberlyst 70 were found using the phenol–sulfuric acid method. Figure 3 presents effects of saccharide concentrations on the penetration amounts of malto-oligosaccharides and starch in Amberlyst 70. The penetration amounts of saccharides in Amberlyst 70 increased concomitantly with the increase of the saccharide concentrations of the solutions for all saccharides. In Figure 3, a dotted line shows the saccharide loading amounts calculated using the concentration of the solution and the volumes of the saturated water contents of the Amberlyst 70. The penetration amounts of saccharide in Amberlyst 70 were below the dotted line, which indicated that the concentration of saccharides inside Amberlyst 70 were lower than the solution outside. The penetration degrees as the ratios of the penetration amounts of saccharides in the Amberlyst 70 to those of the dotted line. The penetration degrees were designated as factor α in Table 4. Factor α decreased from 0.48 to 0.19 with increased DP of the saccharides. In consequence, results indicate that the adsorption amounts of saccharides increased concomitantly with the increased DP of saccharides on AC-SO3H, although the saccharides adsorbed only slightly onto Amberlyst 70. The amounts of saccharides penetrating into Amberlyst 70 decreased concomitantly with the increased DP of saccharides.
Figure 3.

Loading amounts of malto-oligosaccharides and starch in Amberlyst 70. Conditions: 0.5–10 mg saccharides, 20 mg catalyst, and 2 mL distilled water at 40 °C for 30 min.
Table 4. Penetration Degrees of Saccharides in the Amberlyst 70.
| saccharides | DP | α |
|---|---|---|
| maltose | 2 | 0.48 |
| maltotriose | 3 | 0.41 |
| maltopentaose | 5 | 0.32 |
| starch | 30 | 0.19 |
The respective catalytic activities of AC-SO3H and Amberlyst 70 catalysts were investigated for the hydrolysis of oligosaccharides such as maltose, maltotriose, maltotetraose, maltopentaose, and polysaccharides such as starch with an average DP of 30. The low molecular weight starch was soluble in water. First, we present changes in glucose yields in hydrolysis of maltose and starch over AC-SO3H, Amberlyst 70, and parent AC catalysts in Figure 4. The AC without sulfonic acid functional group but with weakly acidic functional groups showed low catalytic activity for hydrolysis of maltose and starch. In contrast, the AC-SO3H and Amberlyst 70 showed high catalytic activity. Those results suggest that the sulfonic acid functional groups are active sites for hydrolysis under the reaction conditions.49,50 In the initial stages of catalytic reactions, the glucose yields increased monotonically with reaction times over both AC-SO3H and Amberlyst 70 catalysts. The obtained products in starch hydrolysis were glucose and oligosaccharides, as shown in Figure S4. Other products such as 5-hydroxymethylfurfural and organic acids were not observed. The glucose formation rates for the maltose hydrolysis over AC-SO3H and Amberlyst 70 catalysts were, respectively, 4.1 and 12 μmol h–1, as shown in Table S1. The Amberlyst 70 catalyst showed higher catalytic activity per catalyst weight than the AC-SO3H catalyst, which can be explained by the sulfonic acid functional group amounts per catalyst weight. By contrast, the glucose formation rates in the starch hydrolysis over AC-SO3H and Amberlyst 70 catalysts were, respectively, 7.8 and 0.65 μmol h–1. That result demonstrates that AC-SO3H showed a 12 times higher catalytic activity than that of Amberlyst 70. Table S1 shows that the glucose formation rates in the hydrolysis over AC-SO3H increased with the increase of DP of oligosaccharides, as follows: 5.5 (maltotoriose), 6.4 (maltotetraose), and 9.8 (maltopentaose) μmol h–1. In contrast, the glucose formation rates in the hydrolysis of maltotriose, maltotetraose, and maltopentaose over Amberlyst 70 decreased with the increase of DP of saccharides. Very recently Chen et al. reported similar DP dependency for cello-oligosaccharide hydrolysis over Amberlyst 70 and oxidized carbon with weakly acidic functional groups.41 The catalytic activity differences of AC-SO3H and Amberlyst 70 catalysts could not be explained as simply according to the amounts of sulfonic acid functional groups.
Figure 4.
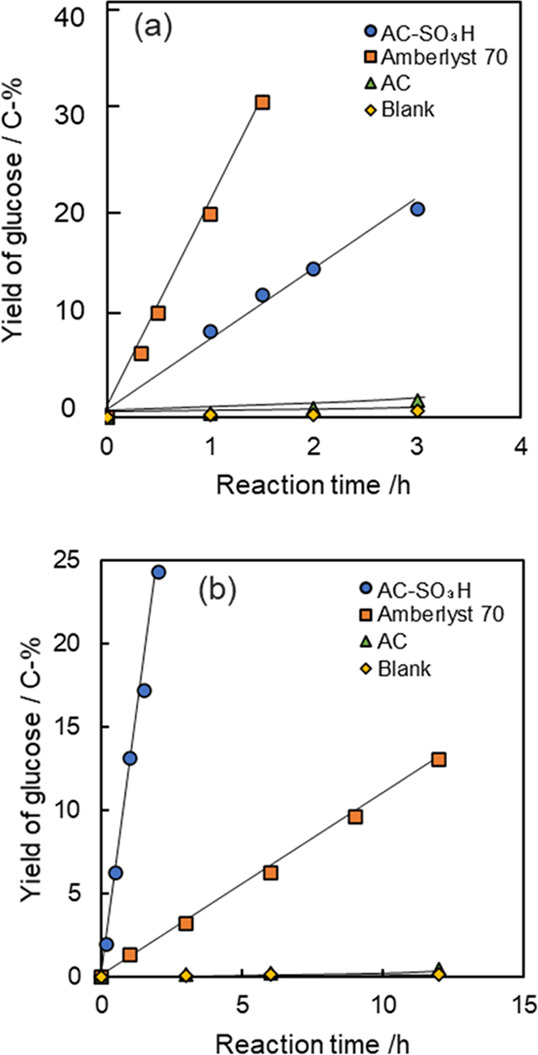
Changes in glucose yields during (a) maltose hydrolysis and (b) starch hydrolysis at 120 °C. Reaction conditions: 10 mg saccharides, 20 mg catalysts, and 2 mL distilled water.
The catalytic activities of AC-SO3H and Amberlyst 70 catalysts for the hydrolysis of disaccharides and malto-oligosaccharides are described in Figure 5 together with Table S1. The glucose formation rates in disaccharides hydrolysis depend on the kind of disaccharide, which might be attributable to differences in bonding modes such as β-1,4-glycoside bond, which were corresponded to the previous reports.51,52 It is particularly interesting, however, that the order of reactivity of the disaccharides was the same on both catalysts, and the order was as follows: xylobiose > lactose > maltose > cellobiose > trehalose. Furthermore, the ratios (=r1/r2) of the reaction rates of the disaccharides hydrolysis over the AC-SO3H catalyst (=r1) and the Amberlyst 70 catalyst (=r2) were approximately the same between 0.38 and 0.31 (see Table S1). In addition, the ratios (=r1/r2) of the reaction rates of oligosaccharides increased with the increase of DP of saccharides. Also, the ratios (=r1/r2) of the reaction rates of the hydrolysis of cellopentaose and maltopentaose over the AC-SO3H catalyst and the Amberlyst 70 catalyst were similar to be 4.0 and 3.4 (see Table S1), as well as those of disaccharides.
Figure 5.

Glucose formation rate r1 and r2 over AC-SO3H and Amberlyst 70 catalysts, respectively, and the catalytic activity ratios of r1/r2 for the hydrolysis of various disaccharides and malto-oligosaccharides. Reaction conditions: saccharides 0.5–25 mg, catalyst 20 mg, and distilled water 2 mL at 120 °C.
Furthermore, the ratios (= r1/r2) of the reaction rates of starch with average DP of 30 over the AC-SO3H catalyst and the Amberlyst 70 catalyst was 12 (Table S1). These results indicate that the ratios (=r1/r2) of the reaction rates over the AC-SO3H catalyst (= r1) and the Amberlyst 70 catalyst (=r2) in the hydrolysis of oligosaccharides and polysaccharides depend on the DP of saccharides.
Next, the catalytic activities per sulfonic acid functional group of AC-SO3H and Amberlyst 70 were studied kinetically for the hydrolysis of maltose, maltotriose, maltotetraose, maltopentaose, and starch. The initial rates of saccharides hydrolysis can be represented by the following equations.53
| 2 |
Therein, r (h–1) stands for the initial glucose formation rate per sulfonic acid group, k (mol–1 h–1 L) is the rate constant, [saccharide]i (mol L–1) denotes the initial concentration of each saccharide, and m expresses the reaction order. Figure S5 and Table S2 show that the initial glucose formation rates and the initial saccharide concentrations had a linear relation with a slope of approximately 1 for the hydrolysis of all saccharides over both catalysts. Therefore, the reaction order m was determined to be first order. The initial reaction rates were proportional to the initial concentrations as shown by the following equation.
| 3 |
The rate constants of glucose formation for hydrolysis of malto-oligosaccharides and starch calculated using eq 3 are given in Table 5. The rate constants k1 of AC-SO3H were of the following order: maltose (45) < maltotriose (66) < maltotetraose (1.1 × 10²) < maltopentaose (2.2 × 10²) < starch (1.4 × 10³). Rate constant k1 increased considerably with increasing DP of saccharides. In contrast, the rate constants k2 of Amberlyst 70 were of the following order: maltopentaose (9.2) < maltotetraose (10) < maltotriose (12) < starch (14) < maltose (20). The rate constant k2 decreased significantly with increasing DP of the saccharides, except for starch, which was the reverse order for the AC-SO3H catalyst. Starch was considered an exception in the order. It was because the DP of starch 30 was average; in contrast, the DP of oligosaccharides was constant. The above order about the rate constant k2 might indicates that DP of starch reacted in the initial period were lower than 30. For comparison, the hydrolysis of malto-oligosaccharides and starch was conducted in a 0.01 mol L–1 H2SO4 aqueous solution without solid catalysts. Rate constant k3 of the diluted sulfuric acid was of the following order: maltotetraose (31) < maltopentaose (33) < maltotriose (34) < maltose (41) < starch (1.2 × 10²). Rate constants k3 tended to be similar to k2; they were 2–3 times higher than k2, except for starch. Vlachos et al. reported the effects of malto-saccharide chain length on the rate constants for the hydrolysis using LiBr-AMSH.54 The results were consistent with the DP dependencies found for Amberlyst 70 and 0.01 M H2SO4 in our results.
Table 5. Glucose Formation Rate Constants of Malto-Oligosaccharides and Starch over the AC-SO3H, Amberlyst 70 and 0.01 M H2SO4a.
| rate
constant k/L mol–1 h–1 |
||||||
|---|---|---|---|---|---|---|
| saccharides | DP | k1: AC-SO3H | k2 (k2′): Amberlyst 70 | k3: 0.01 M H2SO4 | k1/k3 | k2/k3 |
| maltose | 2 | 45 | 20 (42) | 41 | 1.1 | 0.50 |
| maltotriose | 3 | 66 | 12 (29) | 34 | 1.9 | 0.34 |
| maltotetraose | 4 | 1.1 × 10² | 10 (n.d.) | 31 | 3.4 | 0.30 |
| maltopentaose | 5 | 2.2 × 10² | 9.2 (29) | 33 | 6.7 | 0.28 |
| starch | 30 | 1.4 × 10³ | 14 (74) | 1.2 × 10² | 12 | 0.11 |
Reaction conditions: 0.5–25 mg saccharides, 20 mg catalyst, 2 mL distilled water (or dilute acid) at 120 °C for 10 min–12 h.
Comparison of the rate constants k1 of the AC-SO3H catalyst with the rate constant k3 of dilute sulfuric acid shows that k1 was higher than k3 for all the hydrolysis of malto-oligosaccharides and starch. The ratios of k1/k3 increased concomitantly with the increase of the DP, as in the following order: maltose (1.1) < maltotriose (1.9) < maltotetraose (3.4) < maltopentaose (6.7) < starch (12). In contrast, comparison of the rate constants k2 of the Amberlyst 70 catalyst with the rate constant k3 of dilute sulfuric acid reveals that k2 was lower than k3 for all tested saccharides. Furthermore, the ratios of k2/k3 decreased concomitantly with the increase of DP in the following order: maltose (0.50) > maltotriose (0.34) > maltotetraose (0.30) > maltopentaose (0.28) > starch (0.11). As described above, the rate constants k1, k2, and k3 differed. One difference between solid catalyst and dilute sulfuric acid in the reaction steps is the adsorption step.
In the case of the Amberlyst 70 catalyst, catalytic activity k2 was compared with factor α in Table 4. Factor α relates to the penetration ratios estimated at 40 °C. It should change at 120 °C. However, since the chemical structure of Amberlyst 70 and the penetration mechanism of saccharides into Amberlyst 70 are considered to be almost the same at 40 and 120 °C, the correlation of the magnitude relationship among the saccharides also would be almost the same at 40 and 120 °C. Both the rate constant k2 and factor α decreased concomitantly with the increase of DP, which indicated the good correlation found between the catalytic activities and the saccharide contents inside Amberlyst 70. The ratios (=k2/α) were designated as the constant k2′. The reaction rates over Amberlyst 70 catalysts were represented as the following equation.
| 4 |
Constants k2′ were 42 (maltose), 29 (maltotriose), 29 (maltopentaose), and 74 (starch). Except for starch, because of the average DP in the case of starch, constants k2′ of the oligosaccharides were close to the rate constant k3 of the sulfuric acid, which suggests that the rate constants per effective sulfonic acid functional groups of the Amberlyst 70 catalyst were similar to those of the sulfuric acid for the hydrolysis of oligosaccharides. Also for starch, k2′ (=74) was significantly closer to k3 (=120) than k2 (=14). In addition, it was considered that one of the causes of much smaller k2 than k1 and k3 for starch hydrolysis was in factor α of the penetration degree.
In the case of AC-SO3H, both rate constant k1 (Table 5) and Wmax (Table 3) increased concomitantly with the increase of the DP, which suggests that good correlation was found between the catalytic activities and adsorption amounts of saccharides. Dornash et al. also reported that the adsorption capacity of sulfonated mesoporous carbon catalysts increased with increasing the chain length of cello-oligosaccharides, which favors the hydrolysis over a sulfonated mesoporous carbon catalyst.40 Kobayashi et al. reported that hydrolysis of saccharides is activated by adsorption of saccharide on carbon surface with CH−π interactions and hydrophobic interactions and adsorbed saccharide molecules quickly diffuse on the carbon surface with low barrier even in micropores.55 In this study, since the parent AC has higher adsorption capacities for maltose and starch than those of AC-SO3H (see Table S3), the saccharide adsorption sites would be not mainly sulfonic acid functional groups but mainly graphene sheets of carbon surface by hydrophobic effects. The good DP correlation between catalytic activity and saccharide adsorption suggests that the adsorbed saccharides on the carbon surface would diffuse to the active sites of the sulfonic acid functional groups and the surface diffusion would favor the catalytic reaction over the direct transfer of saccharides from the solution to the active sites. Possibly, during the adsorption process onto the AC-SO3H catalyst, the intermolecular hydrogen bonds of the saccharides were relaxed, which might accelerate the hydrolysis rate. Perhaps for this reason, the AC-SO3H showed higher catalytic activity per sulfonic acid functional group than that per sulfuric acid molecule in the diluted H2SO4.
Conclusions
In conclusion, this study investigated the relations between the adsorption properties and the catalytic activities of the sulfonated activated carbon (AC-SO3H) catalyst compared with the Amberlyst resin catalyst. The adsorption amounts and the penetration amounts of several malto-oligosaccharides with different degrees of polymerization (DP) and starch were measured. Also, the concentrations of sulfonic acid functional groups accessible to the saccharides and the saccharide concentrations near the catalytically active site were estimated. Also, the catalytic activities for hydrolysis of the saccharides were examined kinetically. These results demonstrate that the glucose formation rates of AC-SO3H for hydrolysis of malto-oligosaccharides and starch increased concomitantly with increased DP. The adsorption amounts of saccharides also increased concomitantly with increased DP. For AC-SO3H catalysts, the catalytic activities correlated well with the adsorption capacities. In addition, the catalytic activities per sulfonic acid functional group of AC-SO3H were higher than those per sulfuric acid molecule in 0.01 M H2SO4. In contrast, the glucose formation rates over Amberlyst 70 decreased concomitantly with increasing DP. The adsorption amounts of saccharides on Amberlyst 70 were negligibly small; however, the penetration amounts of saccharides into Amberlyst 70 decreased concomitantly with the increase of the DP. The catalytic activity of Amberlyst 70 correlated well with the ease of penetration of saccharides into Amberlyst 70. Also, probably, the catalytic activities per effective sulfonic acid functional group of Amberlyt 70 were close to those per sulfuric acid molecule in 0.01 M H2SO4.
From the comparison of reaction rates in this study, Amberlyst 70 with large amounts of high sulfonic acid functional groups is suitable for hydrolysis of oligosaccharides with DP = 3 or less. The catalytic activity of Amberlyst 70 is expected to be improved by increasing the penetration. The elucidation of the relationship between the structure of resin and the penetration properties is a future subject. The sulfonated carbon catalysts are suitable for hydrolysis of saccharides with DP = 5 or higher. In addition, it also showed that the higher the adsorption amount, the higher the catalytic activity. Therefore, to enhance the activity of the sulfonated solid acid catalysts, it is expected that the adsorption capacity and the penetration degree of saccharides will be increased and that the acid strength and the proportion of strongly acidic groups without reducing the adsorption capacity will be developed.
Supporting Information Available
The Supporting Information is available free of charge at https://pubs.acs.org/doi/10.1021/acsomega.0c03932.
Catalyst characterization such as TG, adsorption isotherm, and pore size distribution; kinetics parameters for saccharide hydrolysis; and product distributions (PDF)
This research was partially supported by JSPS KAKENHI grant number JP19H02517 and by the Kochi University research project of the Biomass Refinery of Marine Algae and the Wood.
The authors declare no competing financial interest.
Supplementary Material
References
- Ragauskas A. J.; Williams C. K.; Davison B. H.; Britovsek G.; Cairney J.; Eckert C. A.; Frederick W. J. Jr.; Hallett J. P.; Leak D. J.; Liotta C. L.; Mielenz J. R.; Murphy R.; Temper R.; Tschaplinski T. T. The Path Forward for Biofuels and Biomaterials. Science 2006, 311, 484–489. 10.1126/science.1114736. [DOI] [PubMed] [Google Scholar]
- Huber G. W.; Iborra S.; Corma A. Synthesis of Transportation Fuels from Biomass: Chemistry, Catalysts, and Engineering. Chem. Rev. 2006, 106, 4044–4098. 10.1021/cr068360d. [DOI] [PubMed] [Google Scholar]
- Farrell A. E.; Plevin R. J.; Turner B. T.; Jones A. D.; O’Hare M.; Kammen D. M. Ethanol Can Contribute to Energy and Environmental Goals. Science 2006, 311, 506–508. 10.1126/science.1121416. [DOI] [PubMed] [Google Scholar]
- BeMiller J. N.Carbohydrate Chemistry for Food Scientists; Third ed.; Elsevier: West Lafayette, 2018. [Google Scholar]
- Li C.; Zhao Z. K. Efficient Acid-Catalyzed Hydrolysis of Cellulose in Ionic Liquid. Adv. Synth. Catal. 2007, 349, 1847–1850. 10.1002/adsc.200700259. [DOI] [Google Scholar]
- Torget R. W.; Kim J. S.; Lee Y. Y. Fundamental Aspects of Dilute Acid Hydrolysis/Fractionation Kinetics of Hardwood Carbohydrates. 1. Cellulose Hydrolysis. Ind. Eng. Chem. Res. 2000, 39, 2817–2825. 10.1021/ie990915q. [DOI] [Google Scholar]
- Brodeur G.; Yau E.; Badal K.; Collier J.; Ramachandran K. B.; Ramakrishnan S. Chemical and Physicochemical Pretreatment of Lignocellulosic Biomass: A Review. Enzyme Res. 2011, 2011, 1–17. 10.4061/2011/787532. [DOI] [PMC free article] [PubMed] [Google Scholar]
- Huang Y. B.; Fu Y. Hydrolysis of Cellulose to Glucose by Solid Acid Catalysts. Green Chem. 2013, 15, 1095–1111. 10.1039/c3gc40136g. [DOI] [Google Scholar]
- Konwar L. J.; Mäki-Arvela P.; Mikkola J. P. SO3H-Containing Functional Carbon Materials: Synthesis, Structure, and Acid Catalysis. Chem. Rev. 2019, 119, 11576–11630. 10.1021/acs.chemrev.9b00199. [DOI] [PubMed] [Google Scholar]
- Lam E.; Luong J. H. T. Carbon Materials as Catalyst Supports and Catalysts in the Transformation of Biomass to Fuels and Chemicals. ACS Catal. 2014, 4, 3393–3410. 10.1021/cs5008393. [DOI] [Google Scholar]
- Onda A.; Ochi T.; Yanagisawa K. Selective Hydrolysis of Cellulose into Glucose over Solid Acid Catalysts. Green Chem. 2008, 10, 1033–1037. 10.1039/b808471h. [DOI] [Google Scholar]
- Suganuma S.; Nakajima K.; Kitano M.; Yamaguchi D.; Kato H.; Hayashi S.; Hara M. Hydrolysis of Cellulose by Amorphous Carbon Bearing SO3H, COOH, and OH Groups. J. Am. Chem. Soc. 2008, 130, 12787–12793. 10.1021/ja803983h. [DOI] [PubMed] [Google Scholar]
- Kitano M.; Yamaguchi D.; Suganuma S.; Nakajima K.; Kato H.; Hayashi S.; Hara M. Adsorption-Enhanced Hydrolysis of β-1,4-Glucan on Graphene-Based Amorphous Carbon Bearing SO3H, COOH, and OH Groups. Langmuir 2009, 25, 5068–5075. 10.1021/la8040506. [DOI] [PubMed] [Google Scholar]
- Kobayashi H.; Yabushita M.; Komanoya T.; Hara K.; Fujita I.; Fukuoka A. High-Yielding One-Pot Synthesis of Glucose from Cellulose Using Simple Activated Carbons and Trace Hydrochloric Acid. ACS Catal. 2013, 3, 581–587. 10.1021/cs300845f. [DOI] [Google Scholar]
- Zhang M.; Wu M.; Liu Q.; Wang X.; Lv T.; Jia L. Graphene Oxide Mediated Cellulose-Derived Carbon as a Highly Selective Catalyst for the Hydrolysis of Cellulose to Glucose. Appl. Catal. A. 2017, 543, 218–224. 10.1016/j.apcata.2017.06.033. [DOI] [Google Scholar]
- Chen G.; Wang X.; Jiang Y.; Mu X.; Liu H. Insights into Deactivation Mechanism of Sulfonated Carbonaceous Solid Acids Probed by Cellulose Hydrolysis. Catal. Today 2019, 319, 25–30. 10.1016/j.cattod.2018.03.069. [DOI] [Google Scholar]
- Onda A.; Ochi T.; Yanagisawa K. Hydrolysis of Cellulose Selectively into Glucose over Sulfonated Activated-Carbon Catalyst under Hydrothermal Conditions. Top. Catal. 2009, 52, 801–807. 10.1007/s11244-009-9237-x. [DOI] [Google Scholar]
- Nata I. F.; Irawan C.; Mardina P.; Lee C.-K. Carbon-Based Strong Solid Acid for Cornstarch Hydrolysis. J. Solid State Chem. 2015, 230, 163–168. 10.1016/j.jssc.2015.07.005. [DOI] [Google Scholar]
- Yamaguchi D.; Hara M. Starch Saccharification by Carbon-Based Solid Acid Catalyst. Solid State Sci. 2010, 12, 1018–1023. 10.1016/j.solidstatesciences.2009.12.002. [DOI] [Google Scholar]
- Onda A. Selective Hydrolysis of Cellulose and Polysaccharides into Sugars by Catalytic Hydrothermal Method Using Sulfonated Activated-Carbon. J. Jpn Pet. Inst. 2012, 55, 73–86. 10.1627/jpi.55.73. [DOI] [Google Scholar]
- Onda A.; Onda S.; Koike M.; Yanagisawa K.; Tsubaki S.; Hiraoka M. Catalytic Hydrolysis of Polysaccharides Derived from Fast-Growing Green Macroalgae. ChemCatChem 2017, 9, 2638–2641. 10.1002/cctc.201700100. [DOI] [Google Scholar]
- Li X.; Shu F.; He C.; Liu S.; Leksawasdi N.; Wang Q.; Qi W.; Alam M. A.; Yuan Z.; Gao Y. Preparation and Investigation of Highly Selective Solid Acid Catalysts with Sodium Lignosulfonate for Hydrolysis of Hemicellulose in Corncob. RSC Adv. 2018, 8, 10922–10929. 10.1039/C7RA13362F. [DOI] [PMC free article] [PubMed] [Google Scholar]
- Lin Q.; Zhang C.; Wang X.; Cheng B.; Mai N.; Ren J. Impact of Activation on Properties of Carbon-Based Solid Acid Catalysts for the Hydrothermal Conversion of Xylose and Hemicelluloses. Catal. Today 2019, 319, 31–40. 10.1016/j.cattod.2018.03.070. [DOI] [Google Scholar]
- Ormsby R.; Kastner J. R.; Miller J. Hemicellulose Hydrolysis Using Solid Acid Catalysts Generated from Biochar. Catal. Today 2012, 190, 89–97. 10.1016/j.cattod.2012.02.050. [DOI] [Google Scholar]
- Mäki-Arvela P.; Salmi T.; Holmbom B.; Willför S.; Murzin D. Y. Synthesis of Sugars by Hydrolysis of Hemicelluloses – A Review. Chem. Rev. 2011, 111, 5638–5666. 10.1021/cr2000042. [DOI] [PubMed] [Google Scholar]
- Yabushita M.; Kobayashi H.; Fukuoka A. Catalytic transformation of cellulose into platform chemicals. Appl. Catal., B 2014, 145, 1–9. 10.1016/j.apcatb.2013.01.052. [DOI] [Google Scholar]
- Van de Vyver S.; Peng L.; Geboers J.; Schepers H.; de Clippel F.; Gommes C. J.; Goderis B.; Jacobs P. A.; Sels B. F. Sulfonated silica/carbon nanocomposites as novel catalysts for hydrolysis of cellulose to glucose. Green Chem. 2010, 12, 1560–1563. 10.1039/c0gc00235f. [DOI] [Google Scholar]
- Van Pelt A. H.; Simakova O. A.; Schimming S. M.; Ewbank J. L.; Foo G. S.; Pidko E. A.; Hensen E. J. M.; Sievers C. Stability of functionalized activated carbon in hot liquid water. Carbon 2014, 77, 143–154. 10.1016/j.carbon.2014.05.015. [DOI] [Google Scholar]
- Gazit O. M.; Katz A. Understanding the Role of Defect Sites in Glucan Hydrolysis on Surfaces. J. Am. Chem. Soc. 2013, 135, 4398–4402. 10.1021/ja311918z. [DOI] [PubMed] [Google Scholar]
- Chung P.-W.; Charmot A.; Olatunji-Ojo O. A.; Durkin K. A.; Katz A. Hydrolysis Catalysis of Miscanthus Xylan to Xylose Using Weak-Acid Surface Sites. ACS Catal. 2014, 4, 302–310. 10.1021/cs400939p. [DOI] [Google Scholar]
- To A. T.; Chung P.-W.; Katz A. Weak-Acid Sites Catalyze the Hydrolysis of Crystalline Cellulose to Glucose in Water: Importance of Post-Synthetic Functionalization of the Carbon Surface. Angew. Chem., Int. Ed. 2015, 54, 11050–11053. 10.1002/anie.201504865. [DOI] [PubMed] [Google Scholar]
- Rinaldi R.; Meine N.; vom Stein J.; Palkovits R.; Schüth F. Which Controls the Depolymerization of Cellulose in Ionic Liquids: The Solid Acid Catalyst or Cellulose?. ChemSusChem 2010, 3, 266–276. 10.1002/cssc.200900281. [DOI] [PubMed] [Google Scholar]
- Toda M.; Takagaki A.; Okamura M.; Kondo J. N.; Hayashi S.; Domen K.; Hara M. Green Chemistry: Biodiesel Made with Sugar Catalyst. Nature 2005, 438, 178. 10.1038/438178a. [DOI] [PubMed] [Google Scholar]
- Tanabe K.; Misono M.; Hattori H.; Ono Y.. New Solid Acids and Bases, Firsted.; Elsevier Science: Sapporo, 1990. [Google Scholar]
- Leyva F.; Orjuela A.; Miller D. J.; Gil I.; Vargas J.; Rodríguez G. Kinetics of Propionic Acid and Isoamyl Alcohol Liquid Esterification with Amberlyst 70 as Catalyst. Ind. Eng. Chem. Res. 2013, 52, 18153–18161. 10.1021/ie402349t. [DOI] [Google Scholar]
- Haas R.Amberlyst 70 Product Data Sheet; Rohm Haas: Philadelphia, PA, USA, 2005. [Google Scholar]
- Siril P. F.; Cross H. E.; Brown D. R. New Polystyrene Sulfonic Acid Resin Catalysts with Enhanced Acidic and Catalytic Properties. J. Mol. Catal. A. 2008, 279, 63–68. 10.1016/j.molcata.2007.10.001. [DOI] [Google Scholar]
- Chung P.-W.; Charmot A.; Gazit O. M.; Katz A. Glucan Adsorption on Mesoporous Carbon Nanoparticles: Effect of Chain Length and Internal Surface. Langmuir 2012, 28, 15222–15232. 10.1021/la3030364. [DOI] [PubMed] [Google Scholar]
- Yabushita M.; Kobayashi H.; Hasegawa J.; Hara K.; Fukuoka A. Entropically Favored Adsorption of Cellulosic Molecules onto Carbon Materials through Hydrophobic Functionalities. ChemSusChem 2014, 7, 1443–1450. 10.1002/cssc.201301296. [DOI] [PubMed] [Google Scholar]
- Dornath P.; Ruzycky S.; Pang S.; He L.; Dauenhauer P.; Fan W. Adsorption-Enhanced Hydrolysis of Glucan Oligomers into Glucose over Sulfonated Three-Dimensionally Ordered Mesoporous Carbon Catalysts. Green Chem. 2016, 18, 6637–6647. 10.1039/C6GC02221A. [DOI] [Google Scholar]
- Chen P.; Shrotri A.; Fukuoka A. Unraveling the hydrolysis of β-1,4-glycosidic bonds in cello-oligosaccharides over carbon catalysts. Catal. Sci. Technol. 2020, 10, 4593–4601. 10.1039/D0CY00783H. [DOI] [Google Scholar]
- Onda A.; Ochi T.; Yanagisawa K. New Direct Production of Gluconic Acid from Polysaccharides Using a Bifunctional Catalyst in Hot Water. Catal. Commun. 2011, 12, 421–425. 10.1016/j.catcom.2010.10.023. [DOI] [Google Scholar]
- Boehm H. P. Some Aspects of the Surface Chemistry of Carbon Blacks and Other Carbons. Carbon 1994, 32, 759–769. 10.1016/0008-6223(94)90031-0. [DOI] [Google Scholar]
- Olivier J. P. Improving the Models Used for Calculating the Size Distribution of Micropore Volume of Activated Carbons from Adsorption Data. Carbon 1998, 36, 1469–1472. 10.1016/S0008-6223(98)00139-0. [DOI] [Google Scholar]
- Sweatman M. B.; Quirke N. Characterization of Porous Materials by Gas Adsorption at Ambient Temperatures and High Pressure. J. Phys. Chem. B 2001, 105, 1403–1411. 10.1021/jp003308l. [DOI] [Google Scholar]
- Hodge J. E.; Hofreiter B. T.. Method in Carbohydrate Chemistry; Whistler R. L.; Wolfram M. L. eds.; Academic Press, 1962, 1, 380–394. [Google Scholar]
- Masuko T.; Minami A.; Iwasaki N.; Majima T.; Nishimura S.-I.; Lee Y. C. Carbohydrate analysis by a phenol-sulfuric acid method in microplate format. Anal. Biochem. 2005, 339, 69–72. 10.1016/j.ab.2004.12.001. [DOI] [PubMed] [Google Scholar]
- Abe I. Applicability of the Langmuir and Freundlich equations to activated carbon adsorption in water. Kagaku To Kogyo 1987, 61, 82–83. [Google Scholar]
- Pang J.; Wang A.; Zheng M.; Zhang T. Hydrolysis of Cellulose into Glucose over Carbons Sulfonated at Elevated Temperatures. Chem. Commun. 2010, 46, 6935–6937. 10.1039/c0cc02014a. [DOI] [PubMed] [Google Scholar]
- Fukuhara K.; Nakajima K.; Kitano M.; Kato H.; Hayashi S.; Hara M. Structure and Catalysis of Cellulose-Derived Amorphous Carbon Bearing SO3H Groups. ChemSusChem 2011, 4, 778–784. 10.1002/cssc.201000431. [DOI] [PubMed] [Google Scholar]
- Vilcocq L.; Castilho P. C.; Carvalheiro F.; Duarte L. C. ChemSusChem 2014, 7, 1010. 10.1002/cssc.201300720. [DOI] [PubMed] [Google Scholar]
- Oomori T.; Khajavi S. H.; Kimura Y.; Adachi S.; Matsuno R. Biochem. Eng. J. 2004, 18, 143. 10.1016/j.bej.2003.08.002. [DOI] [Google Scholar]
- Enslow K. R.; Bell A. T. The Kinetics of Bronsted Acid-Catalyzed Hydrolysis of Hemicellulose Dissolved in 1-Ethyl-3-Methylimidazolium Chloride. RSC Adv. 2012, 2, 10028–10036. 10.1039/c2ra21650g. [DOI] [Google Scholar]
- Ebikade E.; Lym J.; Wittreich G.; Saha B.; Vlachos D. G. Kinetic Studies of Acid Hydrolysis of Food Waste-Derived Saccharides. Ind. Eng. Chem. Res. 2018, 57, 17365–17374. 10.1021/acs.iecr.8b04671. [DOI] [Google Scholar]
- Kobayashi H.; Fukuoka A. Development of Solid Catalyst-Solid Substrate Reactions for Efficient Utilization of Biomass. Bull. Chem. Soc. Jpn. 2018, 91, 29–43. 10.1246/bcsj.20170263. [DOI] [Google Scholar]
Associated Data
This section collects any data citations, data availability statements, or supplementary materials included in this article.