Abstract
Purpose
To investigate the feasibility of accelerating prostate diffusion-weighted imaging (DWI) by reducing the number of acquired averages and denoising the resulting image using a proposed guided denoising convolutional neural network (DnCNN).
Materials and Methods
Raw data from the prostate DWI scans were retrospectively gathered between July 2018 and July 2019 from six single-vendor MRI scanners. There were 103 datasets used for training (median age, 64 years; interquartile range [IQR], 11), 15 for validation (median age, 68 years; IQR, 12), and 37 for testing (median age, 64 years; IQR, 12). High b-value diffusion-weighted (hb DW) data were reconstructed into noisy images using two averages and reference images using all 16 averages. A conventional DnCNN was modified into a guided DnCNN, which uses the low b-value DW image as a guidance input. Quantitative and qualitative reader evaluations were performed on the denoised hb DW images. A cumulative link mixed regression model was used to compare the readers’ scores. The agreement between the apparent diffusion coefficient (ADC) maps (denoised vs reference) was analyzed using Bland-Altman analysis.
Results
Compared with the original DnCNN, the guided DnCNN produced denoised hb DW images with higher peak signal-to-noise ratio (32.79 ± 3.64 [standard deviation] vs 33.74 ± 3.64), higher structural similarity index (0.92 ± 0.05 vs 0.93 ± 0.04), and lower normalized mean square error (3.9% ± 10 vs 1.6% ± 1.5) (P < .001 for all). Compared with the reference images, the denoised images received higher image quality scores from the readers (P < .0001). The ADC values based on the denoised hb DW images were in good agreement with the reference ADC values (mean ADC difference ranged from −0.04 to 0.02 × 10⁻³ mm2/sec).
Conclusion
Accelerating prostate DWI by reducing the number of acquired averages and denoising the resulting image using the proposed guided DnCNN is technically feasible.
Supplemental material is available for this article.
© RSNA, 2020
Summary
A convolutional neural network trained on the pairs of low and high signal-to-noise ratio diffusion-weighted (DW) images from 103 prostate scans successfully denoised the DW images acquired with two averages, enabling acceleration of DW prostate MRI.
Key Points
■ Substantial acceleration of high b-value diffusion-weighted images is technically feasible by reducing the number of acquired averages from 16 to two and applying a denoising convolutional neural network (DnCNN) to denoise the accelerated noisy images.
■ Using low b-value diffusion-weighted images as guidance images in the guided DnCNN leads to improved denoising performance compared with the conventional DnCNN without guidance image input.
■ The probability of obtaining a higher score with denoised diffusion-weighted images is significantly greater than the probability of obtaining a higher score with the reference images.
Introduction
Multiparametric MRI is a trusted method for detection and staging of prostate cancer (1,2). Diffusion-weighted imaging (DWI) is a major component of the multiparametric MRI examinations. Diffusion-weighted (DW) images are acquired using at least two b values to calculate apparent diffusion coefficient (ADC) maps (2). To minimize susceptibility to bulk motion, DWI acquisition is performed using the single-shot echo-planar imaging approach (3), which results in low signal-to-noise ratio (SNR) in the prostate. Low SNR of DWI is problematic not only because it affects image quality, but also because it leads to the noise-induced bias of the MRI magnitude signal (4,5), which subsequently affects the ADC calculation (6) and repeatability (7).
To compensate for the low SNR of prostate DWI, image acquisition is repeated multiple times to obtain the average measurement with an improved SNR. For high b-value DW (hb DW) images (b value ≥ 1000 sec/mm2), the number of averages can range from eight to 16 (8,9). For single-shot echo-planar DWI, acquisition time is a product of repetition time, number of diffusion directions, and number of averages. Thus, a high number of averages leads to long scan time, increased susceptibility to unwanted patient movement, and compromised patient comfort.
Although reducing the number of averages could accelerate DWI, it would result in a lower SNR, greater noise-induced signal intensity bias, and inaccurate ADC maps. We hypothesize that lower SNR of accelerated DWI acquisition can be compensated for by denoising DW images using a convolutional neural network (CNN). The CNN is a class of artificial intelligence computing systems that can successfully improve image quality of noisy MR images (10,11). We propose to develop and train a CNN for denoising of hb DW prostate images acquired with only two averages and subsequently evaluate the effect of denoising on the quality of DW images and the ADC maps.
Materials and Methods
Clinical Dataset
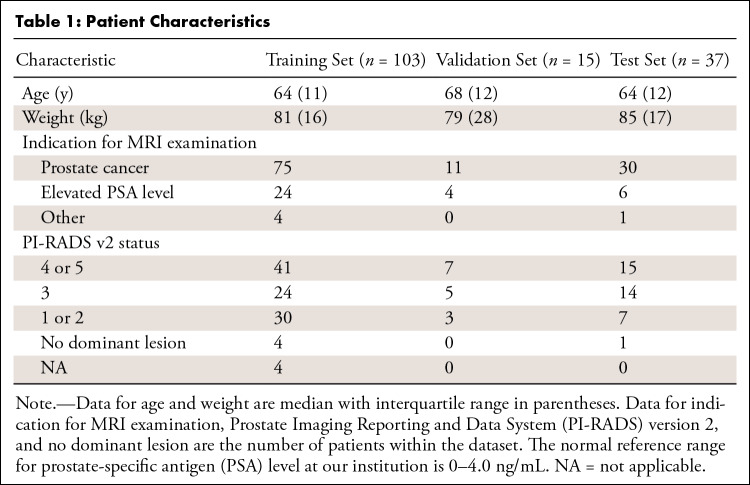
Approval from the institutional review board and waiver of the requirement for informed consent was obtained for this retrospective study. Raw DWI data from 174 patient scans were acquired on separate nonconsecutive days between July 2018 and July 2019. All cases, for which raw data were available, were included. On inspection of the images corresponding to the raw data, datasets from 19 patients were excluded because of severe geometric distortion (n = 5), motion artifacts (n = 1), or an apparent SNR of less than 15 (n = 13). The apparent SNR of hb DW images was measured by dividing the average signal in a contour encompassing the prostate by the standard deviation in a contour placed in a region of no visible signal (12). One hundred fifty-five patients were included (Table 1). The dataset on a patient level was divided into three groups for training (103 patients [median age, 64 years; interquartile range {IQR}, 11], 2564 images, 66%), validation (15 patients [median age, 68 years; IQR, 12], 346 images, 10%), and testing (37 patients [median age, 64 years; IQR, 12], 949 images, 24%). All sets were kept separate. The data were not used in previously published studies.
Table 1:
Patient Characteristics
MRI Scans
Images were acquired with six 3-T MRI scanners (Discovery MR750w and Signa Architect, GE Healthcare, Waukesha, Wis). Details on MRI acquisition are found in Appendix E1 (supplement). The raw data were reconstructed offline (Appendix E2 [supplement]) to generate the images (Fig 1). The low b-value DW (lb DW) images were reconstructed using all corresponding averages (two or four). The not-accelerated hb DW images, which are referred to as reference images, were reconstructed using all available averages (average of 16). The accelerated hb DW images, which are referred to as noisy, were reconstructed using only two averages.
Figure 1:
Schematic flow of image preprocessing steps (details are in Appendix E3 [supplement]). Raw k-space data from one diffusion-weighted (DW) scan is reconstructed to produce three types of images: guidance (low b-value DW image reconstructed with all available averages), noisy (high b-value DW image reconstructed using two averages), and reference (high b-value DW image, reconstructed using 16 averages).
Guided DnCNN
The proposed denoising CNN was based on the deep denoising CNN (DnCNN), which uses residual learning to separate noise from a noisy observation (13). Training of DnCNN requires pairs of noisy and clean images. Here, the term noisy describes the hb DW images reconstructed using two averages. The reference hb DW images, defined previously, are used as clean images. The architecture of the DnCNN (13) was preserved with one modification to incorporate a guidance image (Appendix E3 [supplement]), a concept proposed for guided image filtering by He et al (14). In addition to the noisy hb DW image input, the guidance image (lb DW image) was passed to the network via the second input channel (Fig 2). The output, unmodified, had a single channel containing the estimated residual image. The denoised image was obtained by subtracting the residual image from the noisy image. The mean squared error (MSE) between the denoised and reference hb DW images was used as loss function. The proposed network is referred to as guided DnCNN. Several versions of the DnCNN and guided DnCNN were trained, and the model with optimal performance on the validation set was used on the test set (Appendix E3 [supplement]).
Figure 2:
Denoising convolutional neural network (DnCNN) design. Guidance image is only used in the guided DnCNN. Residual image is estimation of noise, which is subtracted from the noisy image to produce the denoised image. Mean squared error (MSE), calculated between the denoised image and the reference image, is used as loss function. BN = batch normalization, Conv = convolutional, ReLU = rectified linear units.
Evaluation of Guided DnCNN and Denoised DW Images
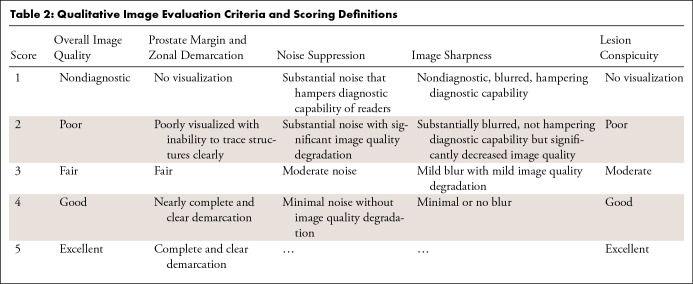
To quantify the effect of denoising DW images using the guided DnCNN, the peak SNR (PSNR) and structural similarity index metrics and normalized MSE were computed for 949 noisy and denoised images relative to the corresponding reference image. Qualitative evaluation was performed by two diagnostic body radiologists with 6 (C.D.) and 4 (E.A.A.) years of experience. The readers were blinded to the project goals and any associated details. The readers independently reviewed noisy, reference, and denoised hb DW images presented in a randomized order (scenarios where by chance one type of image would be immediately followed by another type of image for the same patient were avoided by manually adjusting the order). The corresponding ADC maps were displayed side-by-side with the hb DW images. The ADC maps were calculated by pixelwise computation of the slope of the logarithmized signals at the lb DW and hb DW images.
The scoring system was based on previous studies (9,15,16) (Table 2). In all 37 test patients, the readers ranked overall image quality, prostate margin and zonal anatomy demarcation (MZD), noise suppression, and image sharpness of the prostate and other visible anatomic structures. In a subset of 15 patients who were reported to have one or more lesions with a score of 4 or 5 per the Prostate Imaging Reporting and Data System version 2, the readers also ranked lesion conspicuity, defined as the ability to differentiate the index lesion from adjacent prostatic tissue. The cases that required ranking of lesion conspicuity were marked. The index lesions were not marked.
Table 2:
Qualitative Image Evaluation Criteria and Scoring Definitions
Evaluation of the ADC Maps
The ADC maps, calculated using the noisy, reference, and denoised hb DW images, further referred to as noisy, reference, and denoised ADC maps, were analyzed. Normalized MSE was calculated relative to the reference ADC. The average ADC values were measured in the obturator internus muscle and peripheral and transition zones of the prostate and prostate index lesion. Contours were drawn on the slices with clear representation of the anatomy, and average values of ADC for each contour were recorded.
Statistical Analysis
A cumulative link mixed model was used to compare the readers’ scores (17). The cluster effect of multiple measures from the same patient was modeled via random effects. The effect of the reader was tested. Weighted Cohen κ was used to examine the concordance between the readers, and 95% confidence intervals (CI) for each κ were calculated. The agreement between the ADC values was examined using Bland-Altman analysis (18). The PSNR, structural similarity index, and normalized MSE, calculated for all 949 images in the test set, were compared using a Wilcoxon signed rank test.
R software with the package ordinal (version 3.6.0, R Foundation for Statistical Computing, Vienna, Austria) and IBM SPSS Statistics software (version 25.0, IBM, Armonk, NY) were used. For small sample size, the data were reported as median and IQR. Averaged continuous data were reported as means with standard deviations. Statistical significance was defined as P < .05.
Results
Evaluation of Guided DnCNN and Denoised DW Images
Examining the performance of the networks on the validation set (Appendix E4 [supplement]) demonstrated that the guided DnCNN yielded lower MSE compared with the original DnCNN. The original DnCNN and guided DnCNN with a patch size of 60 × 60 and a depth of 20 were applied to the test set. Denoising significantly improved PSNR, structural similarity index, and normalized MSE. The noisy hb DW images had a PSNR of 14.15 dB ± 2.58, structural similarity index of 0.58 ± 0.07, and the normalized MSE was 149.4% ± 29.5. The original DnCNN produced images with a PSNR of 32.79 dB ± 3.64, structural similarity index of 0.92 ± 0.05, and reduced normalized MSE to 3.9% ± 10. Compared with the original DnCNN, the guided DnCNN had a higher PSNR of 33.74 dB ± 3.64, structural similarity index of 0.93 ± 0.04 (for both P < .001), and lower normalized MSE of 1.6% ± 1.5 (P < .001).
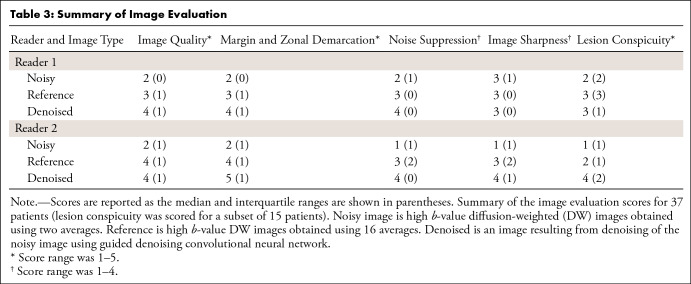
Figure 3 shows representative noisy, reference, and denoised hb DW images obtained using original and guided DnCNNs. For this scan, the repetition time was 7833 msec, and diffusion was acquired in three orthogonal directions separately, resulting in a scan time of 376 seconds for the reference hb DW acquisition. Noisy and denoised hb DW images reconstructed from only two averages corresponded to an acquisition time of 47 seconds. Using only two averages produced noisy images with a high level of noise and elevated signal intensity in the background tissue (the result of noise-induced signal bias) compared with the reference images. The denoised images showed that denoising with either DnCNN or guided DnCNN reduced the level of noise in the images. However, the guided DnCNN design enabled restoration of the anatomic structures, which were not visible on the images denoised using the original DnCNN but which were present in the reference DW images. In addition, denoising with either of the approaches compensated for the noise-induced signal intensity bias; this can be appreciated by examining the signal intensity level in the background tissue. Figure 4 shows representative signal intensity profiles from the noisy, reference, and denoised images shown in Figure 3, A. The signal intensity profile of the denoised image demonstrated both reduction of the noise peak-to-peak fluctuations and noise-induced signal bias, closely matching it to the level of signal intensity seen in the reference image.
Figure 3:
Denoising using denoising convolutional neural network (DnCNN) and guided DnCNNs. A, B, Two separate slices from the same patient. C, D, Zoomed-in view of the boxed regions in A and B. Low b-value images were used in guided DnCNN only. The reference image is a high b-value diffusion-weighted (DW) image reconstructed using 16 averages corresponding to an acquisition time of 376 seconds. Noisy image is a high b-value DW image reconstructed using two averages corresponding to an acquisition time of 47 seconds. DnCNN and guided DnCNN correspond to a noisy image denoised using either original DnCNN or guided DnCNN. Anatomic structures are better visualized on guided DnCCN images compared with DnCNN images; for example, the right hip joint (arrows in A and B), rectum (arrowheads in B), junction between the peripheral zone and transition zone (dashed arrows in C), and bladder wall (* in D). White dashed line in the noisy image in A shows the location of the intensity profiles plotted in Figure 4. Acquisition times are proportional to the repetition time of 7833 msec, three diffusion directions, and corresponding number of averages.
Figure 4:
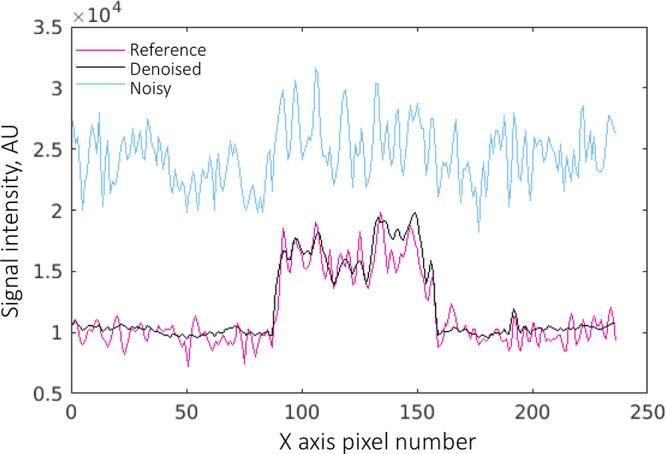
Signal intensity profiles from the reference, denoised with guided denoising convolutional neural network, and noisy high b-value diffusion-weighted images shown in Figure 3, A. Denoising reduces the peak-to-peak noise fluctuations and noise-induced signal bias. AU = arbitrary units.
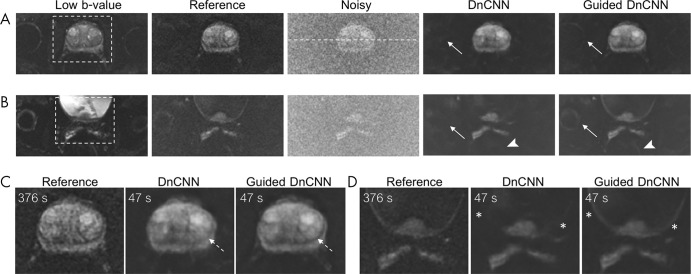
The results of the reader study, carried out on the images denoised using the guided DnCNN, are shown in Table 3. In the overall image quality category, the denoised images received the median score of 4 (IQR, 1) from reader 1, and the median score of 4 (IQR, 1) from reader 2. The reference images received the median scores of 3 (IQR, 1) and 4 (IQR, 1) from the two readers, respectively. The cumulative link mixed model showed that the probability of obtaining a higher score for denoised images was greater than the probability of obtaining a higher score for the reference images for all scoring categories (for image quality, MZD, noise suppression: P < .0001, for image sharpness: P = .03, for lesion conspicuity: P = .0008). The difference between the readers was not significant for the image quality, MZD, image sharpness, and lesion conspicuity categories, and was significant for the noise suppression category (P = .01). The agreement between the readers was moderately strong, κ = 0.76 (95% CI: 0.67, 0.86), 0.74 (95% CI: 0.59, 0.89), and 0.75 (95% CI: 0.67, 0.82) for the image quality, MZD, and noise suppression categories, respectively. The agreement was moderate (κ = 0.58 with 95% CI: 0.35, 0.81) for the lesion conspicuity, and fairly weak for the image sharpness (κ = 0.194 with 95% CI: −0.35, 0.74) categories.
Table 3:
Summary of Image Evaluation
Evaluation of the ADC Maps
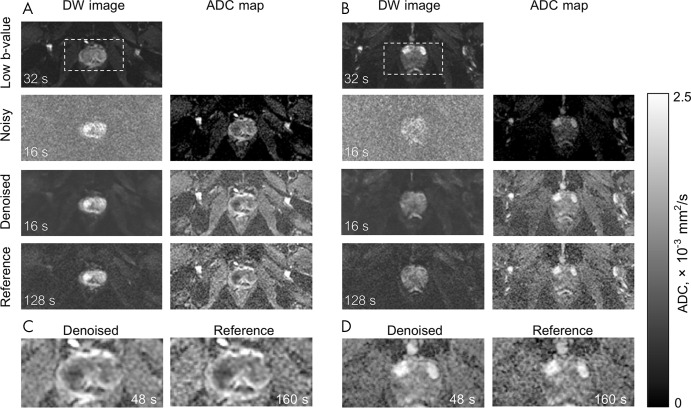
Figure 5 shows the representative ADC maps derived from the noisy, denoised, and reference hb DW images for two patients. For these scans, repetition time was 8000 msec, and diffusion was acquired in one direction (“3-in-1”), resulting in a scan time of 128 seconds for the reference images. The denoised and noisy hb DW images corresponded to a scan time of 16 seconds because of an eightfold reduction in the number of averages. The acquisition time for reference ADC maps, calculated as a sum of the scan times for the lb DW and hb DW images, was 160 seconds. The scan time for the noisy and denoised ADC maps was 48 seconds. Denoised ADC maps appear comparable to the reference ADC maps; however, they require 70% shorter scan time. The normalized MSE of the denoised ADC maps, 1.8% ± 3.5, was lower than the normalized MSE of the noisy ADC maps, 79.3% ± 91.3 (P < .001).
Figure 5:
Representative examples of diffusion-weighted (DW) images and derived apparent diffusion coefficient (ADC) maps. A and B show images from two separate patients (not used in Figure 3). DW image column contains low b-value image (four averages), noisy and/or denoised (two averages), and reference (16 averages) high b-value DW images. Low b-value image was used to compute the ADC maps. Noisy ADC maps strongly underestimate ADC values. Denoised ADC maps with an acquisition time of 48 seconds are comparable with the reference ADC maps with an acquisition time of 160 seconds. Zoomed-in view on the boxed regions from A and B are displayed in C and D. Acquisition times are based on a repetition time of 8000 msec, single diffusion direction, and corresponding number of averages.
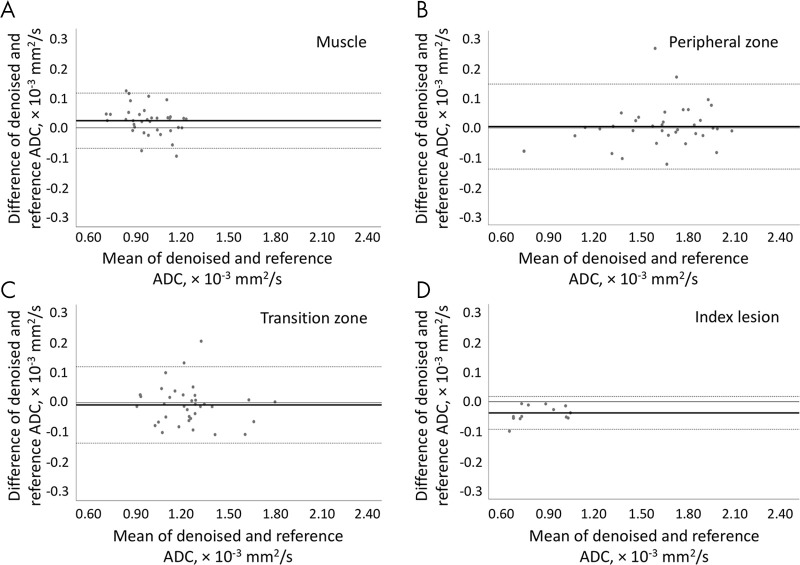
The noisy ADC maps (Table 4) yielded much lower ADC values in all tissues compared with the reference values (P ≤ .001). The denoised ADC values were comparable to the reference ADC values. In the muscle, the median denoised ADC value was 0.97 (IQR, 0.22) × 10-3 mm2/sec, and the reference ADC value was 0.98 (IQR, 0.23) × 10-3 mm2/sec. In the peripheral zone, the median denoised ADC value was 1.62 (IQR, 0.41) × 10-3 mm2/sec, and the reference ADC value was 1.64 (IQR, 0.42) × 10-3 mm2/sec. In the transition zone, the median denoised ADC value was 1.24 (IQR, 0.21) × 10-3 mm2/sec, and the reference ADC value was 1.22 (IQR, 0.22) × 10-3 mm2/sec. In the index lesion, the median denoised ADC value was 0.74 (IQR, 0.31) × 10-3 mm2/sec, and the reference value was 0.72 (IQR, 0.34) × 10-3 mm2/sec. Figure 6 shows the Bland-Altman plots between the denoised and reference ADC values. For muscle tissue ADC, a bias of 0.02 × 10⁻³ mm2/sec was observed with 95% limits of agreement of −0.07 and 0.12 × 10⁻³ mm2/sec. For the peripheral zone, the bias was 0.004 × 10⁻³ mm2/sec with 95% limits of agreement −0.14 and 0.15 × 10⁻³ mm2/sec. For the transition zone, the bias was −0.008 × 10⁻³ mm2/sec with the limits of agreement −0.14 and 0.12 × 10⁻³ mm2/sec. In cancer lesions, the ADC bias was −0.04 × 10⁻³ mm2/sec with the limits of agreement −0.09 and 0.02 × 10⁻³ mm2/sec.
Table 4:
Average and Median ADC Values
Figure 6:
Bland-Altman plots show per-patient analysis between apparent diffusion coefficient (ADC) values measured using the reference ADC map and the denoised ADC map in, A, muscle, B, peripheral zone, C, transition zone, and, D, cancer lesion. The solid line represents the mean difference (bias), and the dotted lines represent the 95% limits of agreement.
Discussion
This work showed that acceleration of prostate DWI was feasible using a reduced number of averages and CNN-based denoising without loss of perceived image quality. The guided DnCNN was proposed by making a modification to a previously described denoising method, DnCNN (13). The network was trained and tested on the DW prostate images obtained at six single-vendor 3-T scanners. The accelerated hb DW images, reconstructed with two averages and subsequently denoised, were evaluated with respect to the reference images and reconstructed with 16 averages. The resulting ADC maps were compared with the reference ADC maps, and the agreement between the ADC values was examined.
The framework of training a DnCNN model (13), using noisy and reference MR images reconstructed from the same data set, was previously described to accelerate arterial spin labeling imaging of the brain (19). The original DnCNN network was trained on pairs of noisy (10 averages) and reference (40 averages) images. In our study, the performance of original DnCNN was suboptimal when resolving small anatomic features of low signal intensity, motivating the development of the guided DnCNN. The guided DnCNN design was based on the previous studies demonstrating the benefits of the multicontrast input for image denoising of brain arterial spin-labeling images and reduced contrast material dose contrast-enhanced brain images (11,20). Similar to the guided image-filtering methods (14,21) in which an additional image of the same structures is used to prevent oversmoothing of the edges, in guided DnCNN, the guidance lb DW prostate image improves the denoising performance.
Compared with the original denoising method, the guided DnCNN yielded the higher PSNR and structural similarity index and lower normalized MSE. It also enabled the restoration of features with a very low signal, comparable with what was visualized in the reference hb DW images. The reader study showed that the denoised hb DW images, which require much shorter scan time, had significantly higher scores compared with the reference images. Two considerations explain these results. First, in prostate DW reference images, the SNR increase is achieved by averaging repeated measurements. Such an approach is prone to image blurring because of involuntary anatomic motion, such as peristalsis and rectal distention (22,23). Therefore, reducing the number of averages should reduce motion-related blurring, and thus may lead to the perceived higher image quality. Second, denoising suppresses noise and affects the overall perception of image quality, which may lead to perceived improved image quality in the denoised images. Similarly, in a reader study of denoised digital subtraction angiography images acquired with one-quarter of contrast material dose, the denoised images were ranked higher than the reference full-dose images (24).
Unlike the noisy natural images, often modeled by adding Gaussian noise, the noise in the magnitude MR images follows Rician distribution (5), and in the images with low signal intensity it introduces a bias. In this work, we showed that the guided DnCNN, trained on the pairs of the actual noisy and reference MR magnitude images, not only reduced the standard deviation of noise but also reduced the signal intensity bias to the level of bias seen in the reference DW images.
Deriving ADC maps from the denoised hb DW images resulted in ADC values comparable with the reference ADC maps with normalized MSE lower than 5%. The ADC values measured using the denoised ADC maps demonstrated good agreement with the ADC values measured from the reference ADC maps. Bias with an absolute value of 0.04 × 10⁻³ mm2/sec or smaller was observed on the Bland-Altman plots examining the ADC values in muscle, prostate index lesion, and peripheral or transition zones. The 95% limits of agreement between the denoised and reference ADC maps were acceptable and comparable with the results of DWI repeatability studies. For example, in a repeatability study examining the agreement between the prostate ADC measurements acquired twice on the same day in 18 patients, the 95% limits of agreement between the two measurements of the median tumor ADC values were −0.27 and 0.26 × 10⁻³ mm2/sec (25). The observed good agreement between the ADC values from the denoised and reference ADC maps indicated that guided DnCNN denoising of the accelerated noisy hb DW images provided noninferior hb DW images and ADC maps.
The study had several limitations. First, the denoising model was trained on the data from six MRI scanners of a single vendor, and only the datasets for which SNR of the reference images was 15 or higher were used, which potentially can affect the generalizability of the model. Second, because the noise-free ground truth DW images or ADC maps were not attainable, the network was trained on the available and clinically relevant highest quality estimates of the prostate hb DW images for a b value of 1000 sec/mm2. It would be of value to explore a “noise2noise” denoising paradigm that does not require the ground truth “clean” images for model training (26). Its applicability to MRI magnitude image noise with nonzero mean may be limited (27). Other limitations were the relatively small size of the test set of 37 patients, the small number of cases in which the lesion appearance was evaluated (15 patients), and the small number of the readers.
In conclusion, this retrospective study presented quantitative and qualitative evidence for technical feasibility of accelerating prostate DWI by reducing the number of acquired averages to two and denoising the resulting image. Future work will focus on establishing the effect of this acceleration framework on the diagnostic performance of the denoised DW images and ADC maps.
APPENDIX
SUPPLEMENTAL FIGURES
Acknowledgments
Acknowledgments
We thank Dr Kai Zhang for publicly sharing his DnCNN code. We also thank Dr John Pauly and Dr Charles R. Schmidtlein for valuable discussions, and we thank Daniel Lafontaine for his assistance with computing services. We thank James Keller for his help with editing and preparing this manuscript.
Supported in part by NIH/NCI Cancer Center Support Grant P30 CA008748.
Disclosures of Conflicts of Interest: E.A.K. Activities related to the present article: work partly funded by NIH/NCI Cancer Center support grant (P30 CA008748). Activities not related to the present article: disclosed no relevant relationships. Other relationships: disclosed no relevant relationships. E.A.A. disclosed no relevant relationships. C.D. disclosed no relevant relationships. I.H. disclosed no relevant relationships. E.K. disclosed no relevant relationships. Y.M. disclosed no relevant relationships. M.M.F. Activities related to the present article: disclosed no relevant relationships. Activities not related to the present article: employee of GE Healthcare; holds stock options in GE Healthcare. Other relationships: disclosed no relevant relationships. Z.Z. disclosed no relevant relationships. R.O. disclosed no relevant relationships. H.A.V. disclosed no relevant relationships. O.A. Activities related to the present article: disclosed no relevant relationships. Activities not related to the present article: disclosed no relevant relationships. Other relationships: author is on the scientific advisory board for Ezra AI.
Abbreviations:
- ADC
- apparent diffusion coefficient
- CI
- confidence interval
- CNN
- convolutional neural network
- DnCNN
- denoising CNN
- DW
- diffusion weighted
- DWI
- diffusion-weighted imaging
- hb DW
- high b value DW
- IQR
- interquartile range
- lb DW
- low b value DW
- MSE
- mean squared error
- MZD
- prostate margin and zonal anatomy demarcation
- PSNR
- peak SNR
- SNR
- signal-to-noise ratio
References
- 1.Barentsz JO, Weinreb JC, Verma S, et al. Synopsis of the PI-RADS v2 guidelines for multiparametric prostate magnetic resonance imaging and recommendations for use. Eur Urol 2016;69(1):41–49. [DOI] [PMC free article] [PubMed] [Google Scholar]
- 2.Richenberg J, Løgager V, Panebianco V, Rouviere O, Villeirs G, Schoots IG. The primacy of multiparametric MRI in men with suspected prostate cancer. Eur Radiol 2019;29(12):6940–6952. [DOI] [PMC free article] [PubMed] [Google Scholar]
- 3.Turner R, Le Bihan D. Single-shot diffusion imaging at 2.0 Tesla. J Magn Reson (1969) 1990;86(3):445–452. [Google Scholar]
- 4.Henkelman RM. Measurement of signal intensities in the presence of noise in MR images. Med Phys 1985;12(2):232–233. [DOI] [PubMed] [Google Scholar]
- 5.Gudbjartsson H, Patz S. The Rician distribution of noisy MRI data. Magn Reson Med 1995;34(6):910–914. [DOI] [PMC free article] [PubMed] [Google Scholar]
- 6.Mazaheri Y, Vargas HA, Nyman G, Shukla-Dave A, Akin O, Hricak H. Diffusion-weighted MRI of the prostate at 3.0 T: comparison of endorectal coil (ERC) MRI and phased-array coil (PAC) MRI-The impact of SNR on ADC measurement. Eur J Radiol 2013;82(10):e515–e520. [DOI] [PubMed] [Google Scholar]
- 7.Gibbs P, Pickles MD, Turnbull LW. Repeatability of echo-planar-based diffusion measurements of the human prostate at 3 T. Magn Reson Imaging 2007;25(10):1423–1429. [DOI] [PubMed] [Google Scholar]
- 8.Rosenkrantz AB, Chandarana H, Pfeuffer J, et al. Zoomed echo-planar imaging using parallel transmission: impact on image quality of diffusion-weighted imaging of the prostate at 3T. Abdom Imaging 2015;40(1):120–126. [DOI] [PubMed] [Google Scholar]
- 9.O’Donohoe RL, Dunne RM, Kimbrell V, Tempany CM. Prostate MRI using an external phased array wearable pelvic coil at 3T: comparison with an endorectal coil. Abdom Radiol (NY) 2019;44(3):1062–1069. [DOI] [PubMed] [Google Scholar]
- 10.Kim KH, Choi SH, Park S-H. Improving arterial spin labeling by using deep learning. Radiology 2018;287(2):658–666. [DOI] [PubMed] [Google Scholar]
- 11.Gong E, Pauly JM, Wintermark M, Zaharchuk G. Deep learning enables reduced gadolinium dose for contrast-enhanced brain MRI. J Magn Reson Imaging 2018;48(2):330–340. [DOI] [PubMed] [Google Scholar]
- 12.Mazaheri Y, Vargas HA, Nyman G, Akin O, Hricak H. Image artifacts on prostate diffusion-weighted magnetic resonance imaging: trade-offs at 1.5 Tesla and 3.0 Tesla. Acad Radiol 2013;20(8):1041–1047. [DOI] [PMC free article] [PubMed] [Google Scholar]
- 13.Zhang K, Zuo W, Chen Y, Meng D, Zhang L. Beyond a gaussian denoiser: residual learning of deep cnn for image denoising. IEEE Trans Image Process 2017;26(7):3142–3155. [DOI] [PubMed] [Google Scholar]
- 14.He K, Sun J, Tang X. Guided image filtering. IEEE Trans Pattern Anal Mach Intell 2013;35(6):1397–1409. [DOI] [PubMed] [Google Scholar]
- 15.Sosna J, Pedrosa I, Dewolf WC, Mahallati H, Lenkinski RE, Rofsky NM. MR imaging of the prostate at 3 Tesla: comparison of an external phased-array coil to imaging with an endorectal coil at 1.5 Tesla. Acad Radiol 2004;11(8):857–862. [DOI] [PubMed] [Google Scholar]
- 16.Shah ZK, Elias SN, Abaza R, et al. Performance comparison of 1.5-T endorectal coil MRI with 3.0-T nonendorectal coil MRI in patients with prostate cancer. Acad Radiol 2015;22(4):467–474. [DOI] [PMC free article] [PubMed] [Google Scholar]
- 17.Bates D, Mächler M, Bolker B, Walker S. Fitting linear mixed-effects models using lme4. arXiv:1406.5823. [preprint] https://arxiv.org/abs/1406.5823. Posted 2014. Accessed December 2019. [Google Scholar]
- 18.Bland JM, Altman DG. Statistical methods for assessing agreement between two methods of clinical measurement. Lancet 1986;1(8476):307–310. [PubMed] [Google Scholar]
- 19.Xie D, Bai L, Wang Z. Denoising Arterial Spin Labeling Cerebral Blood Flow Images Using Deep Learning. arXiv:1801.09672. [preprint] https://arxiv.org/abs/1801.09672. Posted 2018. Accessed December 2019. [Google Scholar]
- 20.Gong E, Pauly J, Zaharchuk G, eds. Boosting SNR and/or resolution of arterial spin label (ASL) imaging using multi-contrast approaches with multi-lateral guided filter and deep networks. Proceedings of the Annual Meeting of the International Society for Magnetic Resonance in Medicine, Honolulu, Hawaii, 2017. [Google Scholar]
- 21.Ham B, Cho M, Ponce J. Robust guided image filtering using nonconvex potentials. IEEE Trans Pattern Anal Mach Intell 2018;40(1):192–207. [DOI] [PubMed] [Google Scholar]
- 22.Padhani AR, Khoo VS, Suckling J, Husband JE, Leach MO, Dearnaley DP. Evaluating the effect of rectal distension and rectal movement on prostate gland position using cine MRI. Int J Radiat Oncol Biol Phys 1999;44(3):525–533. [DOI] [PubMed] [Google Scholar]
- 23.Caglic I, Hansen NL, Slough RA, Patterson AJ, Barrett T. Evaluating the effect of rectal distension on prostate multiparametric MRI image quality. Eur J Radiol 2017;90:174–180. [DOI] [PubMed] [Google Scholar]
- 24.Söderman M, Holmin S, Andersson T, Palmgren C, Babić D, Hoornaert B. Image noise reduction algorithm for digital subtraction angiography: clinical results. Radiology 2013;269(2):553–560. [DOI] [PubMed] [Google Scholar]
- 25.Barrett T, Lawrence EM, Priest AN, et al. Repeatability of diffusion-weighted MRI of the prostate using whole lesion ADC values, skew and histogram analysis. Eur J Radiol 2019;110:22–29. [DOI] [PubMed] [Google Scholar]
- 26.Lehtinen J, Munkberg J, Hasselgren J, et al. Noise2noise: learning image restoration without clean data. arXiv:1803.04189. [preprint] https://arxiv.org/abs/1803.04189. Posted 2018. Accessed December 2019. [Google Scholar]
- 27.Zhussip M, Soltanayev S, Chun SY. Theoretical analysis on Noise2Noise using Stein’s Unbiased Risk Estimator for Gaussian denoising: towards unsupervised training with clipped noisy images. arXiv:1902.02452. [preprint] https://arxiv.org/abs/1902.02452. Posted 2019. Accessed December 2019. [Google Scholar]
Associated Data
This section collects any data citations, data availability statements, or supplementary materials included in this article.


![Schematic flow of image preprocessing steps (details are in Appendix E3 [supplement]). Raw k-space data from one diffusion-weighted (DW) scan is reconstructed to produce three types of images: guidance (low b-value DW image reconstructed with all available averages), noisy (high b-value DW image reconstructed using two averages), and reference (high b-value DW image, reconstructed using 16 averages).](https://cdn.ncbi.nlm.nih.gov/pmc/blobs/20a6/8082338/7d9bfd2b81bc/ryai.2020200007.fig1.jpg)

