

Abstract
The notion of a U-shape in happiness – well-being is highest for people in their 20s, decreasing to its nadir in midlife, and then rising into old age – has captured the attention of the media who cite it as evidence for a midlife crisis. We argue support for the purported U-shape is not as robust and generalizable as often assumed, and present our case with the following arguments: (1) Cross-sectional studies are inadequate for drawing conclusions about within-person change in happiness across the lifespan; (2) Cross-sectional evidence with respect to the ubiquity and robustness of the U-shape in general levels of happiness and life satisfaction is mixed; (3) Longitudinal support for the U-shape in happiness and life satisfaction is also mixed; (4) Longitudinal research on subjective indicators of well-being other than general levels of happiness and life satisfaction challenges the U-shape; (5) When asked to reflect on their lives, middle-age to elderly adults tend to recall midlife as one of the more positive periods; and (6) A focus on a single trajectory of well-being is of limited scientific and applied value because it obscures diversity in pathways through life as well as its sources. Understanding happiness across the life course and moving the research field forward require a multi-disciplinary, collaborative approach.
Keywords: happiness, life satisfaction, U-shape, midlife crisis
In 2010, an article in The Economist proclaimed that happiness across the life course follows a “U-bend:” highest in youth followed by a decline to its nadir in midlife and an upswing thereafter (Anonymous, 2010). This claim has been echoed in media reports (e.g., Ingraham, 2017) and a recent book titled “The happiness curve: Why life gets better after 50” (Rauch, 2018). The idea of a U-shape in happiness (also known as the U-curve) emerged largely out of cross-sectional studies using single-item measures of well-being (e.g., happiness, life satisfaction) in large samples from diverse countries around the world (Blanchflower & Oswald, 2008; Stone, Schwartz, Broderick, & Deaton, 2010). Economist Andrew Oswald, one of the primary proponents of the U-shape argument, states “I view this as a first-order discovery about human beings that will outlive us by hundreds of years” (Rauch, 2018, p. 52).
The purported U-shape in happiness is interpreted by a number of economists as evidence that, as people move through the life course, they will experience a midlife trough, sometimes labeled a midlife crisis. Many laypeople, too, assume that crisis in midlife is common. An internet survey of Swiss respondents, for example, found that 92% believed in the existence of the midlife crisis and 71% knew someone who had experienced or was experiencing one (Freund & Ritter, 2009), similar to the beliefs of adults in the United States (Lachman, Lewkowicz, Marcus, & Payne, 1994; Wethington, 2000). The pervasiveness of a midlife crisis, however, is challenged by data from psychological studies (Baird, Lucas, & Donnellan, 2010; Galambos, Fang, Krahn, Johnson, & Lachman, 2015; Mroczek & Spiro, 2005; Whitbourne, 2010). The disciplinary difference between economists and psychologists regarding the existence of a midlife crisis has been highlighted in the media (Suddath, 2017) and in peer-reviewed articles (Easterlin, 2006; Frijters & Beatton, 2012; Headey, Muffels, & Wagner, 2010; Ulloa, Møller, & Sousa-Poza, 2013). When recently interviewed, economist David Blanchflower commented “‘How hard is that to see?’ when psychologists say they can’t find a U?” (Rauch, 2018, p. 66).
We believe that a more systematic discussion of the conceptual and methodological issues underlying disagreement about the U-shape in happiness is required, and present evidence that the U-shape is not as robust or generalizable as often argued. Our goal is to move beyond the disciplinary debate around whether mean levels of happiness are either higher or lower in midlife compared to other age periods. Instead, we should focus more on variability within and across people, highlighting the importance of questions about when and why some people are unhappy and what we can do about it. To start, we briefly review our understanding of happiness in the context of the empirical literature.
Conceptualizing and Measuring Happiness
The meaning of happiness has challenged social scientists for decades, with differing definitions and operationalizations. In a lay sense, happiness refers to the state of feeling or showing pleasure or contentment and is often used interchangeably with well-being (Mroczek & Kolarz, 1998; Oishi, 2010). In a long line of scientific writings, Diener and colleagues have framed happiness in terms of subjective well-being (SWB). In their view, SWB consists of multiple separable components including life satisfaction (a cognitive evaluation of the quality of one’s life), positive hedonic affect (the subjective experience and accumulation over time of positive emotion such as feeling happy), and low levels of negative affect such as sadness (Diener, Kahnemann, Tov, & Arora, 2010; Diener, Suh, Lucas, & Smith, 1999). As such, life evaluations and a preponderance of positive over negative affect (or affect balance) are considered key components of SWB. Satisfaction in domains such as marriage and work, and the specific variables of depression, anxiety, and anger (indicators of negative affect) and self-esteem and optimism have been mentioned as additional subjective indicators of well-being (Diener et al., 1999; Diener & Suh, 1999).
In contrast to the SWB framework, Ryff’s (1989) model of well-being includes six factors: purpose in life, self-acceptance, autonomy, personal growth, environmental mastery, and positive relationships. These dimensions together reflect eudaimonic well-being, an alternative to the SWB framework that taps into the meaningfulness of life (Ryff, 2014). Although eudaimonic well-being has become an additional focus in happiness studies (e.g., Dolan, Kudrna, & Stone, 2017; Steptoe, Deaton, & Stone, 2015), most investigations of the U-shape have taken a hedonic approach and measured life satisfaction and/or positive affect (i.e., happiness).
Three single-item hedonic measures have been commonly used in investigations of the U-curve. Life satisfaction, a cognitive judgment, is typically assessed by asking a question such as “All things considered, how satisfied are you with your life as a whole these days?” with options ranging from very dissatisfied to very satisfied. Cantril’s (1965) ladder is also a cognitive evaluation of life: “On which step of the ladder would you say you personally stand at this time?” with responses ranging from 0 (worst possible life) to 10 (best possible life). The affective dimension of SWB is often assessed with a happiness item such as “Taking all things together, would you say you are” very happy to not at all happy? Such items are considered valid global indices of well-being that assess how people judge or feel they are doing in general (Diener, Inglehart, & Tay, 2013; Oishi, 2010). A five-item Satisfaction with Life Scale (SWLS; Diener, Emmons, Larsen, & Griffin, 1985) has been used occasionally, as have measures of immediate or recent experiences (e.g., happiness/stress/worry experienced yesterday; Oishi, 2010; Steptoe et al., 2015).
Most U-shape studies explicitly or implicitly use measures associated with the SWB perspective, that is, cognitive evaluations (life satisfaction) and positive affect (happiness), hence, we primarily discuss SWB in this paper. Furthermore, we draw mostly on research using global indices of these dimensions (life satisfaction and happiness in general) rather than domain-specific (e.g., job satisfaction) or experiential measures (e.g., happiness felt yesterday) because of their widespread usage in large survey datasets examining the U-curve.
Challenging the U-shape
The U-shape in happiness relies on finding that young and old adults are happier than middle-aged adults. If the U-shape applies, then there should be a downward slide from the teens or early 20s into the 40s and 50s and a climb back up after the 50s (Galambos et al., 2015; Piper, 2015). Well-being in the transition to adulthood (teens through 20s), however, is characterized by diverse trajectories, with some young people thriving in this period and others floundering as they attempt to meet normative challenges (e.g., finishing education and finding work; finding a romantic partner; Krahn, Howard, & Galambos, 2015; Schulenberg, Bryant, & O’Malley, 2004). Some research shows depressive symptoms – indicative of negative affect – decrease on average from the late teens into the 20s and 30s although life circumstances and histories contribute to diversity in these trajectories (Galambos, Barker, & Krahn, 2006; Merikangas et al., 2003). Research specifically on within-person change in general levels of happiness between the teens and midlife is in short supply, but it is not clear that young people are happier than middle-aged adults as suggested by the U-curve (Galambos et al., 2015).
When people reach middle age they may review their earlier goals in the context of their achievements. For some, the realization of unmet aspirations or the perceived failure to have accomplished goals set as young adults could lead to a midlife low (Freund & Ritter, 2009; Schwandt, 2016). Considering the presumed upward climb after midlife, socioemotional selectivity theory suggests older adults’ awareness of a diminishing future leads to their preference for positive emotions and experiences, relative to younger adults, whose future timelines are longer (Carstensen, Isaacowitz, & Charles, 1999). Indeed, a meta-analysis of 100 studies found a reliable positivity effect in which older adults, more than do younger adults, naturally process (attend to and remember) positive more than negative information (Reed, Chan, & Mikels, 2014). Also consistent with the idea of increasing happiness after midlife, older adults often show more positive affect than middle-aged adults at least until very late life (e.g., Carstensen et al., 2011; Mroczek & Kolarz, 1998). These effects, however, tend to be relatively small and vary across dimensions of well-being (Lachman, 2015; Stone et al., 2010; Ulloa et al., 2013).
We believe the conclusion that happiness declines from late adolescence to midlife (the first half of the U-shape) is premature, and possibly wrong, and while there is better evidence of a rise in happiness after midlife, it is scientifically limiting to presuppose a single trajectory characterizes development of well-being across the life course. We present our case with the following arguments: (1) Cross-sectional studies are inadequate for drawing conclusions about within-person change in happiness; (2) Cross-sectional evidence with respect to the ubiquity and robustness of the U-shape is mixed; (3) Longitudinal support for the U-shape is also mixed; (4) Longitudinal research on subjective indicators of well-being other than general levels of happiness and life satisfaction challenges the U-shape; (5) When asked to reflect on their lives, middle-age to elderly adults tend to recall midlife as one of the more positive periods; and (6) A focus on mean-level happiness (i.e., the U-shape) obscures the more important question of diversity in well-being and its sources across the lifespan.
Recent Cross-sectional and Longitudinal Studies Examining the U-shape
To inform our discussion, we conducted a literature search of relevant articles published from 2013 to (June) 2019. The search was restricted to 2013 and later in view of an earlier literature review citing articles on the U-shape published through 2012 (Ulloa et al., 2013). The core collection of Web of Science and Medline were searched with these terms: (well-being OR life satisfaction OR happiness) AND age AND u-shape. This search generated 64 articles. We read the abstracts (and the articles when the abstracts were not informative enough) to determine whether the study met the following criteria: (1) published in a peer-reviewed journal in English; (2) tested for age differences (cross-sectional) or changes with age (longitudinal) in global measures of life satisfaction or happiness; and (3) spanned the teens or 20s into the 60s (cross-sectional studies), or had at least two times of measurement and spanned the periods of young adulthood to midlife, midlife to late life, or young adulthood to midlife to late life (longitudinal studies). Twenty-seven articles were retained after elimination of studies that did not fit the criteria or did not yield enough information to draw conclusions. In addition, we included two articles that the search did not identify but with which we were familiar.
Table 1 summarizes these 29 studies, identifying the data source, the happiness measure, and whether the results were consistent with a U-shape. Results of cross-sectional age comparisons are presented first, followed by longitudinal or accelerated longitudinal analyses. Accelerated longitudinal analyses are based on data from two or more birth cohorts or cross-sections tracked for a number of years; the repeated-measures data for these different age groups are spliced together to create an estimate of change across the life course.
Table 1.
Studies (2013-19) Illustrating Diversity in Age-related Differences and Trajectories of Happiness Across Life
| Author(s) and Year | Data Source | Happiness Measure |
Consistent with U-shape? (Yes, No, Mixed) |
|---|---|---|---|
| Cross-Sectional Analyses | |||
| Bardo (2017) | General Social Survey (United States) | 1-item happiness | No. Happiness increased from age 18 to 79, then declined. |
| Bauer et al. (2017) | Integrated Values Survey/Life in Transition Survey (20+ Europe and Central Asia countries) | 1-item life satisfaction | Mixed. Multiple age-related patterns depending on country and analysis. |
| Beja (2018) | World Values Survey (95 countries) | 1-item life satisfaction | Yes. Low point in mid-40s in 15- to 69-year-olds. |
| Blanchflower & Oswald (2019) | Behavioral Risk Factor Surveillance System (BRFSS; United States)/European Social Survey (ESS) | 1-item life satisfaction | Mixed. In BRFSS analyses with controls, U-shape with low point in 40s. Without controls, wave-shape with low at 23. In ESS analyses with controls, U-shape with low point in early 50s. Without controls, less pronounced rise after 50s. |
| Cheng et al. (2015) | British Household Panel Survey (BHPS)/Household, Income and Labour Dynamics in Australia Survey (HILDA)/German Socioeconomic Panel (GSOEP)/Medicine in Australia Balancing Life Employment and Life Study (MABEL) | 1-item life satisfaction | Yes. Low point ranges from 40.7 years to 53 years, depending on dataset. |
| Dolan et al. (2017) | American Time Use Survey | Cantril ladder | No. In sample age 15 to 80+, life evaluation higher among age 55+ participants compared to midlife group (50-54). Younger participants not consistently higher than midlife group. |
| Ferrante (2017) | Survey on Household Income and Wealth (Italy) | 1-item happiness | Mixed. In sample ages 19 to 97, no midlife low in unadjusted models; midlife low in conditional models depends on education. |
| Graham & Pozuelo (2017) | Gallup World Poll (46 countries) | Cantril ladder | Yes. In 44 of 46 countries, life evaluation low point ranged between 40 and 60 years of age. |
| Grover & Helliwell (2019) | Annual Population Survey (UK) | 1-item life satisfaction | Yes. Low point in mid-40s to early 50s. |
| Hellevik (2017) | Norwegian Monitor Study | 1-item life satisfaction; 1-item happiness | Mixed. In 15- to 79-year-olds, U-shape for life satisfaction without controls. No U for happiness in 15- to 79-year-olds, unless controls are added. |
| Kolosnitsyna et al. (2017) | Russian Longitudinal Monitoring Survey (RLMS) | 1-item life satisfaction | Mixed. In five cross-sectional samples, low point ranges from 50 to 70 depending on gender and year of measurement. |
| Laaksonen (2018) | ESS (30 countries) | 1-item happiness | Mixed. Yes, in half of the countries but only in models with controls. Low point ranges from below 40 to above 50. U-shape applies more to men than women. |
| Li (2016) | HILDA | 1-item life satisfaction | Mixed. U-shape but with low point in mid-30s. |
| Lin (2016) | Taiwan Social Change Survey | 1-item happiness | Yes. In sample age 18 to 60+, happiness lowest around age 50. |
| Morgan et al. (2015) | ESS (29 countries) | Three-item index (happiness and life satisfaction) | Mixed. Low point in midlife in wealthier countries but downward trend from age 20 to 79 in poorer countries. |
| Olaroiu et al. (2017) | Eurostat/OECD surveys (31 countries) | 1-item life satisfaction | Mixed. U-curve in 12 countries but linear trend downward in 19 countries in samples ages 16 to 75+ |
| Ruseski et al. (2014) | Population survey (Rheinberg, Germany) | 1-item happiness | Yes. In sample of 18- to 70-year-olds, happiness lowest at age 42. |
| Schwandt (2016) | GSOEP | 1-item life satisfaction | Yes. In sample ages 22 to 90, low point in mid-50s; decline after 75. |
| Steptoe et al. (2015) | Gallup World Poll (160 countries) | Cantril ladder | Mixed. Yes, in high-income English-speaking countries, but no in former Soviet Union and eastern Europe, Sub-Saharan Africa, and Latin America and Caribbean. |
| Xing & Huang (2014) | China (5 cities) | Satisfaction with Life Scale (SWLS) | No. Satisfaction increased across age. |
| Longitudinal or Accelerated Longitudinal Analyses: Young Adulthood to Midlife | |||
| Galambos et al. (2015) | Edmonton Transitions Study (Canada) | 1-item happiness | No. Increase from age 18 to 32, flat to age 43 in sample of high school students. Increase from age 23 to 37 in sample of university students. |
| Otterbach et al. (2018) | pairfam (Germany) | 1-item life satisfaction | Mixed. Steep decline from age 15 to 24 but then flat until age 44, in sample of 3 age groups followed for 8 years. |
| Piper (2015) | BHPS | 1-item life satisfaction | Yes. Decline in satisfaction with age among 16- to 30-year-olds followed for up to 11 years. |
| Longitudinal or Accelerated Longitudinal Analyses: Midlife to Late Life | |||
| Kolosnitsyna et al. (2017) | RLMS | 1-item life satisfaction | Mixed. For women 55+ followed for 4 years, satisfaction increased until late life. For men 60+, life satisfaction did not increase. |
| Shankar et al. (2015) | English Longitudinal Study of Ageing | SWLS | Yes. Satisfaction increased over 6 years in sample ages 52 and above. |
| Longitudinal or Accelerated Longitudinal Analyses: Young Adulthood to Midlife to Old Age | |||
| Baetschmann (2013) | GSOEP | 1-item life satisfaction | Mixed. In sample followed for up to 26 years, low point in satisfaction was at 55 and high point was at 70, but satisfaction increased over life cycle for more educated. |
| Bauer et al. (2017) | RLMS | 1-item life satisfaction | Mixed. Multiple age trajectories from age 18 to 88 depending on analysis, in sample followed for up to 18 years. |
| Cheng et al. (2015) | BHPS/HILDA/GSOEP/MABEL | 1-item life satisfaction | Yes. Low point is between 40 and 47, depending on data source. |
| Grover & Helliwell (2019) | BHPS | 1-item life satisfaction | No. No U (age and age2 not significant) controlling for earlier life satisfaction and marital status in 24- to 98-year-olds followed for 10 years. |
| Lachman et al. (2014) | Midlife in the United States (MIDUS) | 1-item life satisfaction | No. In 24- to 74-year-olds followed for 10 years, no change from 20s to 30s and 30s to 40s. Increased satisfaction from 40s to 50s and 50s to 60s, followed by decline from 60s to 70s. |
| Li (2016) | HILDA | 1-item life satisfaction | No. Inverted U or curvilinear decrease in sample age 18+ followed for over 12 years. |
| Mujcic & Oswald (2018) | HILDA | 1-item life satisfaction | Yes. Low point in early 40s, with or without controls for envy in sample followed for up to 8 years. |
| Wunder et al. (2013) | BHPS/GSOEP | 1 item life satisfaction | Yes. Low point at age 48 (BHPS) and 52 (GSOEP) in samples followed for up to 10 and 18 years, respectively. |
1. The Inadequacy of Cross-sectional Research
A key issue in research on the U-shape concerns the extent to which it is valid to draw conclusions about how people change over time (i.e., within-person or intraindividual change) on the basis of cross-sectional research. The shortcomings of cross-sectional research have long been recognized in economics and psychological research. For example, economist Herbert Parnes (1972), an original leader of the U.S. National Longitudinal Surveys on labor market behavior, argued “For some kinds of research questions… a series of ‘snapshots’ of a changing population is inadequate. What is required is a ‘motion picture’ of the same group of individuals over time” (p. 11). Developmental psychologists have also argued that cross-sectional research is hardly defensible as a measure of within-person change and that longitudinal research following the same individuals over multiple occasions is required if the goal is to observe human behavioral change (Baltes & Nesselroade, 1979). Methodologically, cross-sectional analyses can only answer questions about differences between persons of different ages (Molenaar, 2008; Schaie, 2000). Nevertheless, based largely on cross-sectional research, U-shape proponents conclude that individuals will develop into less happy beings as they age from their teens into their 40s after which they will recover and experience increasing happiness into old age (Blanchflower & Oswald, 2008). Even a cross-sectional observational study on the subjective well-being of great apes in captivity is cited as proof of the cross-species ubiquity of the U-shape (Weiss, King, Inoue-Murayama, Matsuzawa, & Oswald, 2012).
The flaws inherent in generalizing from age differences (i.e., between-persons comparisons) to within-person (intraindividual) change trajectories were demonstrated in studies on marital satisfaction, a domain-specific indicator of SWB (Diener et al., 1999). Early cross-sectional studies of married people consistently found support for a U-shape with a nadir in midlife (e.g., Anderson, Russell, & Schumm, 1983), leading Glenn (1990) to conclude “…a curvilinear relationship between family stage and some aspects of marital quality is about as close to being certain as anything ever is in the social sciences” (p. 823). Later longitudinal data on couples revealed the U-shape as an artifact of using between-person comparisons to infer intraindividual development (VanLaningham, Johnson, & Amato, 2001). Instead of a U-shape, longitudinal studies revealed a linear decrease in marital satisfaction (e.g., Karney & Bradbury, 1997). Recent research found the majority of couples maintain initial levels of marital satisfaction throughout their unions, with declines isolated to an initially less satisfied minority (Anderson, Van Ryzin, & Doherty, 2010; Lavner & Bradbury, 2010). We know from longitudinal research that unhappy couples that eventually divorced were not in the sample at older ages, so marital satisfaction appeared to be higher in later years (i.e., selection effect; VanLangingham et al., 2001). The implication for cross-sectional studies is that a sample will be biased at older ages towards more satisfied couples. Similar selectivity occurs with life satisfaction, such that people with lower life satisfaction are more likely to drop out of a study (Cheng, Powdthavee, & Oswald, 2015; Röcke & Lachman, 2008). As the notion of a U-shape depends on an upward swing in happiness at older ages, it could be that selection effects explain such results more than true age-related increases.
Cross-sectional studies confound age and cohort differences (people born in the same period of time share unique experiences that people born at different times do not), a limitation commonly acknowledged in the literature (Baird et al., 2010; Bell, 2014; Easterlin, 2006). Using Household, Income and Labour Dynamics of Australia (HILDA) survey data, Li (2016) demonstrated that the U in cross-sectional data is a result of averaging levels of life satisfaction of different birth cohorts, and that life satisfaction actually declined across the life course when appropriate within-person (fixed effects) longitudinal analyses were conducted. Li argued the age-happiness connection is in fact a “cohort-happiness” (p. 317) connection, a point that has been made as well by others (Bell, 2014; Frijters & Beatton, 2012).
In addition to cohort and selection effects, measurement differences and choice of control variables likely account for conflicting results across studies exploring the U-curve (Glenn, 2009; Laaksonen, 2018; Ulloa et al., 2013). Regardless of whether a U is found in cross-sectional data, people at different ages or in different age groups reporting different levels of happiness is not evidence of a developmental process that takes place within individuals across the lifespan. Longitudinal research is needed to investigate intraindividual change.
2. Cross-sectional Support for the U-shape is Mixed
Despite its limitations, cross-sectional research has been used to support claims of a midlife low in happiness, and even here, it is important to ask whether the data match the conclusion that the U is ubiquitous and robust. In a review of the literature on the U-shape in well-being through 2012, Ulloa et al. (2013) concluded “…it is difficult to say with certainty whether the relationship between age and well-being across the lifespan is linear or convex. Given that theory and empirics in all disciplines seem to argue against an inverted U-shaped relation, the concavity hypothesis can most likely be dismissed” (p. 240). Since Ulloa et al. published their review, more cross-sectional studies using measures of general life satisfaction and happiness have emerged, with results that also cast doubt on the pervasiveness of the U-shape.
Table 1 reveals that several cross-sectional studies documented a U in studies using life satisfaction, Cantril ladder, and happiness items (Beja, 2018; Cheng et al., 2015; Daroudi, Rashidian, Zeraati, Oliyaeemanesh, & Sari, 2016; Graham & Pozuelo, 2017; Grover & Helliwell, 2019; Lin, 2016; Ruseski, Humphreys, Hallman, Wicker, & Breuer, 2014; Schwandt, 2016), but others found mixed evidence. That is, the shape (and associated nadirs and peaks) of the age-happiness connection varied, depending on country and region of the world (Bauer, Levin, Boudet, Nie, & Sousa-Poza, 2017; Laaksonen, 2018; Morgan, Robinson, & Thompson, 2015; Steptoe et al., 2015), whether control variables such as education and marital status were included in analyses (Blanchflower & Oswald, 2019; Ferrante, 2017; Hellevik, 2017), year or period of time when the surveys were administered (Kolosnitsyna, Khorkina, & Dorzhiev, 2017; Olaroiu, Alexa, & van den Heuvel, 2017), and gender (Kolosnitsyna et al., 2017; Laaksonen, 2018). Some studies found a U-shape but the low point was outside of the typical range of midlife (defined as 40 to 60 years of age; Freund & Ritter, 2009), for example, in the 30s (Laaksonen, 2018; Li, 2016) or up to age 70 (Kolosnitsyna et al., 2017). One found a wave-shape with the lowest point at age 23 in a model without controls (Blanchflower & Oswald, 2019). A handful found no evidence of a U-shape on single-item happiness (Bardo, 2017), Cantril ladder (Dolan et al., 2017), and SWLS (Xing & Huang, 2014) measures. Altogether the diversity in these studies was not a function of which item or measure was used to assess well-being. Such variability across studies not only illustrates that the U in cross-sectional data is not robust across geographic, sociocultural, historical, and demographic contexts, but the low point in happiness is a moving target ranging between young adulthood and late life as well as within the 20-year period typically known as midlife.
3. Longitudinal Support for the U-shape is Mixed
Noting that “…either the psychologists have overlooked something important for a long time or … the methodology of economists begets different answers” Frijters and Beatton (2012, p. 526) analyzed longitudinal data from the German Socio-Economic Panel (GSOEP), British Household Panel Survey (BHPS), and HILDA to account for the difference in opinion. They found some support for the U-shape in life satisfaction in pooled cross-sectional analyses but the U vanished when selection (e.g., income, marriage) and time-in-panel effects were controlled via fixed effects analyses. Kassenboehmer and Haisken-DeNew (2012) also documented the disappearance of the U-shape in life satisfaction in the GSOEP after controls were introduced. Cheng et al. (2015) observed “all attempts to replicate the [U-shape] pattern in genuinely longitudinal data have been a failure” (p. 127), highlighting the importance of further longitudinal research to draw conclusions about change trajectories in happiness.
Since 2013 more longitudinal studies have emerged on the U-curve of happiness. A handful have examined whether there is a downward slide in happiness from the teens or 20s into midlife – the first half of the U-curve. Table 1 shows mixed evidence. In support, data from the BHPS found an over-time decline in life satisfaction among 16- to 30-year-olds tracked for 11 years (Piper, 2015). German Family Panel (pairfam) data (Otterbach, Sousa-Poza, & Møller, 2018) also showed a longitudinal decrease in life satisfaction across seven years, but only in one cohort (ages 15-17 years at baseline); life satisfaction showed little change in two other cohorts (ages 25-27 years and ages 35-37 years at baseline). In contrast, self-reported happiness increased in the Edmonton Transitions Study (ETS), which followed a community sample of 18-year-old Canadians for 25 years, as well as a sample of university graduates tracked from age 23 to 37 (Galambos et al., 2015). Even at the recent age 50 follow-up of the ETS community sample, the majority of participants were “very happy,” and obviously happier than they were in their late teens and 20s (see Figure 1).
Figure 1.
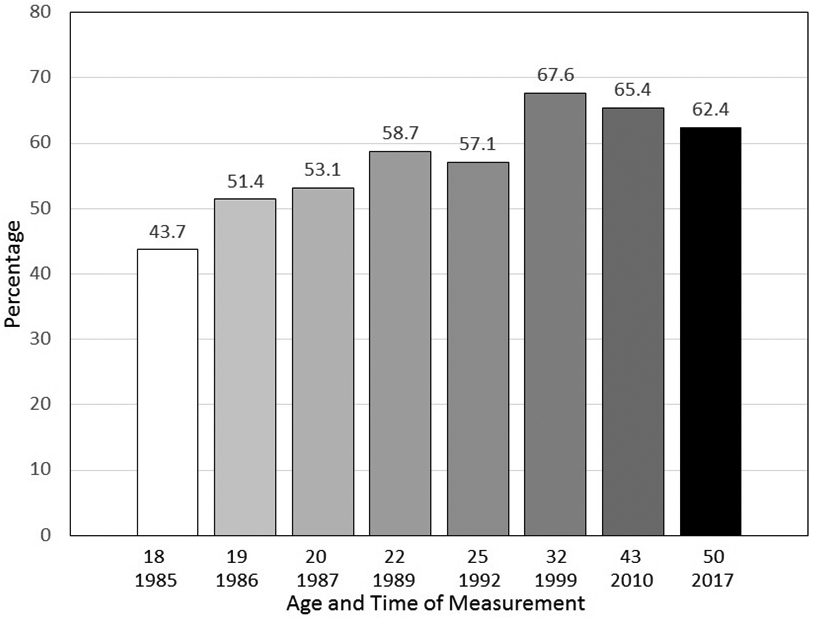
Percentage of “very happy” participants at each wave of longitudinal study (N = 402-967, unpublished data)
With respect to an upswing between midlife and late life (the second half of the U-curve), Table 1 shows mixed support. In a Russian sample, Kolosnitsyna et al. (2017) found that satisfaction increased until late life in women 55 years of age and older followed for four years. However, life satisfaction did not increase among men aged 60 and older. Consistent with the second half of the U, Shankar, Rafnsson, and Steptoe (2015) found that life satisfaction increased across six years in participants aged 52 and above in the English Longitudinal Study of Aging. Both studies contrast with earlier results of Mroczek and Spiro (2005); their 22-year longitudinal study of American men ages 40 and above at baseline showed an increase in life satisfaction to age 65 followed by a decrease.
Accelerated longitudinal studies tracking multiple age cohorts over time can shed some light on the existence of a presumed decline in happiness from early adulthood to midlife followed by a rebound (see Table 1). In support of the U-shape, life satisfaction reached a low point in the 40s or 50s in Australian (HILDA), British (BHPS), and German (GSOEP) samples followed for a decade or more (Cheng et al., 2015; Mujcic & Oswald, 2018; Wunder, Wiencierz, Schwarze, & Küchenhoff, 2013). But there has been mixed or no support for the U in other studies of GSOEP, BHPS, and HILDA data. Baetschmann (2013), for example, called attention to the great heterogeneity in nadirs, peaks, and paths of life satisfaction in GSOEP, demonstrating that while, on average, life satisfaction declined to age 55, and then rose to age 70, highly educated people became more satisfied across life and the less educated slid downward. Previously, using the GSOEP sample, Baird et al. (2010) reported stability in life satisfaction between age 16 and the 70s, followed by a drop.
In a study using BHPS data, Grover and Helliwell (2019) found support for the U when earlier life satisfaction was not controlled (i.e., the effects of age and the age-squared terms were significantly negative and positive, respectively) but in models controlling for earlier life satisfaction (a methodologically rigorous approach), the age terms dropped to non-significance. Li (2016) conducted fixed effects analyses to document decreasing life satisfaction across the life course in the HILDA sample, similar to the earlier report by Frijters and Beatton (2012). Such widely varying findings in more recent and earlier studies using the same data sources must give pause to the assumption of a single trajectory describing paths of happiness across the lifespan.
Given that so much of the (contradictory) longitudinal research on the U-curve has been conducted on subsamples from the same data sources, it is refreshing to see results from other studies. The Midlife in the United States (MIDUS) study followed 10-year age bands of adults ages 25-75 for a decade; there was no change in life satisfaction from the 20s to the 40s, but life satisfaction increased from the 40s to 60s, followed by decline until age 70 (Lachman, Teshale, & Agrigoroaei, 2015). Data from the Russian Longitudinal Monitoring Survey (RLMS), which followed multiple age cohorts from the teens to the 80s, documented several age patterns in life satisfaction (U, S, downward, and upward) depending on the analysis (Bauer et al., 2017).
Altogether, longitudinal studies illustrate considerable diversity in happiness trajectories and fail to provide compelling evidence of an unequivocal decline in happiness from the early 20s into the 40s and 50s followed by a rebound up until later life. Ample evidence shows the shape of the trajectory in longitudinal studies depends on the type of analysis (e.g., fixed effects vs. ordinary least squares regressions) and variables included or excluded in the analysis (e.g., education, marital status, socioeconomic status, cohort). Like cross-sectional studies, however, longitudinal designs have limitations including attrition, time in panel, and selection effects, and they confound age-related change with time-of-measurement (period) effects (Baird et al., 2010; Frijters & Beatton, 2012; Li, 2016). The broad use of single-item measures of SWB in U-curve studies is another methodological limitation that could possibly lead to conflicting findings – although empirical arguments have been made to support their reliability, validity, and sensitivity to change (Baird et al., 2010; Diener et al., 2013). Nevertheless, for questions concerning within-person change across time, longitudinal designs are of vital importance.
4. Longitudinal Research on other Well-being Indicators Challenges the U-Shape
Studies using subjective indicators of well-being (e.g., self-esteem, depression, anger, recent affective experiences) other than general happiness and life evaluations can provide useful insights into the validity of the U-curve. Blanchflower and Oswald (2008), for example, found the U-shape in cross-sectional analyses of depression (UK Labour Force Survey) and mental health (Eurobarometer). A comprehensive review of studies using such measures is beyond the scope of this paper, but it is informative to take a glance at some recent studies, selected because they provide longitudinal or accelerated longitudinal data from the teens to midlife or teens to late life.
Of interest is that several demonstrate adolescence and the early 20s, on average, as a low point in well-being, which improves into midlife. This has been shown with respect to trajectories of self-esteem (Orth, Maes, & Schmitt, 2015; Orth, Trzesniewski, & Robins, 2010), depression (Elovainio et al., 2012; Merikangas et al., 2003; Sutin et al., 2013), anger (Hakulinen et al., 2013), hostility (Siegler et al., 2003), psychological health (Jones & Meredith, 2000), and affect balance (Carstensen et al., 2011). Furthermore, several found midlife (i.e., age 60) to be the peak in well-being across the life course (Orth et al., 2010, 2015; Sutin et al., 2013). Finally, a meta-analysis of longitudinal studies assessing emotional stability found increases especially between age 20 and 40 (Roberts, Walton, & Viechtbauer, 2006). These studies challenge the generalizability of an average U-shaped trajectory characterized by enhanced well-being at the transition to adulthood compared to midlife.
It is important to note that these studies also demonstrate heterogeneity in trajectories of well-being depending on other variables in the equation. Baseline (e.g., gender) or time-varying predictors (e.g., physical health) are moderators that can move the trajectory up or down. Orth et al. (2010), for example, found that women had lower self-esteem than men in young adulthood but the gender difference vanished by late life. And physical health problems accounted for the decline in self-esteem from midlife to late life. Group-based modeling approaches intentionally highlight multiple trajectories in well-being across the life course (Musliner, Munk-Olsen, Eaton, & Zandi, 2016; Schulenberg et al., 2004). A meta-analysis of 25 longitudinal studies of depressive symptoms using group-based modeling (Musliner et al., 2016) identified between three and six latent class trajectories ranging from minimal symptoms across portions of the lifespan (most people) to chronically experienced symptoms (the rarest). Further evidence of diversity in trajectories arises when recently experienced emotions are assessed. Using longitudinal GSOEP data on sadness, anger, and happiness in the last four weeks, Kunzmann, Richter, and Schmukle (2013) documented widely varying trajectories: happiness declined from 20 to 90, sadness was stable until age 70 and then declined, and anger rose from 20 to 30 followed by decline to late life. Altogether, evidence drawn from indicators of subjective well-being other than global happiness and life satisfaction points to a multiplicity of possible pathways across life that defies the assumption of a single trajectory.
5. Reflections on the Past Highlight Midlife as Happy
Although ongoing assessments of the same individuals across the lifespan is optimal for examining happiness trajectories, it is intriguing to consider the reports of people who can tell us whether midlife is the nadir in happiness across the life course – those who lived it. We recently asked 404 western Canadians in the ETS (average age = 50 years) “Thinking back, what was the best decade of your life?” The “40s” received the highest endorsement (37%) and about a quarter endorsed the “30s” (27%) and the “20s” (25%). Few endorsed the teens (7%) or childhood (5%). A similar study conducted with elderly participants in Denmark found the 30s as the most satisfying decade, with the 20s and 40s next highest in satisfaction (Mehlsen, Platz, & Fromholt, 2003). In a sample of Swiss young (24-29 years), middle-age (49-54 years), and older adults (74-79 years), the middle-age group was most satisfied with life at present, and all three groups saw their teens as the low point in life satisfaction (Gomez, Grob, & Orth, 2013). Freund and Ritter (2009) found that midlife was the “preferred age” of older adults (60+) in their Swiss internet study. Similarly, Lachman et al. (1994) reported that both middle-age (M = 48 years) and older (M = 75 years) adults reported the “prime of life” as between 31 and 52 years of age.
In another study, MIDUS data showed that although life satisfaction was relatively stable in rank-order and mean levels across nine years throughout adulthood, middle-aged adults recalled the past (10 years ago) as less satisfying than their quite highly satisfied present and they expected the future to be even better (Lachman, Röcke, Rosnick, & Ryff, 2008; Röcke & Lachman, 2008). Finally, in a study of 59-80-year-olds in the U.S., when asked about the most satisfying period of life, nominations were distributed relatively evenly across the 20s, 30s, 40s, 50s, and 60s, and the teens were seen as least satisfying (Field, 1997). All in all, the lived experiences of many individuals who are in or have gone beyond midlife do not recall or portray it as the nadir in happiness.
We acknowledge that such retrospective reports would reflect the information processing biases inherent in most recall tasks (see Karney & Frye, 2002). But it is not clear why, in the ETS and other studies (Field, 1997; Gomez et al., 2013), adolescence would be reported as a least satisfactory period in the lifespan, particularly if the midlife experience was comparatively worse. If midlife represents a true low point for most adults, we should not see so many recalling those years with fond memories in their autobiographical accounts.
6. The More Important Question Concerns Diversity in Happiness and its Sources
We question the scientific and applied value of continuing to search for definitive evidence of a single trajectory in happiness. Emphasizing an average trend in happiness (if one could be found) is less important than discovering diversity in life paths and then identifying determinants of deviations from the average (Lachman, 2015; Whitbourne, 2010). The issue of how well-being changes from adolescence to late life is essentially a developmental question that can be approached from prominent lifespan and life course theoretical perspectives (Baltes, Lindenberger, & Staudinger, 2006; Elder, Johnson, & Crosnoe, 2003). Key assumptions of the lifespan developmental perspective are that there is great diversity (interindividual differences) in within-person change across life, and this diversity can be captured with longitudinal research tracking individuals over time on multiple dimensions (e.g., multiple indicators of well-being). Multidimensionality leads to multidirectionality – observed characteristics even in the same domain will show different paths, ups, and downs rather than a single, unidirectional, universal trajectory (Baltes et al., 2006). The life course perspective emphasizes historical, sociodemographic, and contextual influences on individual development, leading to a better understanding of how individual development is shaped by the forces of historical time, social change, culture, cohort, and the family into which one is born (Bardo, 2017; Elder et al., 2003). Lifespan and life course approaches consider the individual as an active agent who interacts with the context, and these interactions affect developmental change. From both perspectives, it is not surprising to see substantial evidence for heterogeneity in trajectories of happiness across measures, across studies, and among persons within studies.
What are the sources of differences across people in how their happiness changes across time? Studies tell us that happiness in any one person, sample, and nation is a result of unique, multiple, interacting determinants such as gender, socioeconomic background, and migration status; individual characteristics such as physical health; life events such as marriage, divorce, unemployment, and retirement; community factors (e.g., corruption, social support, crime); and macro-level indicators like economic recessions, natural disasters, and war (Galambos et al., 2015; Helliwell, Layard, & Sachs, 2013; Yap, Anusic, & Lucas, 2014). As an example of macro-level effects, Olaroiu et al. (2017) documented cross-sectional support for a U-curve in life satisfaction among individuals in European countries in 2007 (prior to widespread economic recession) but considerably less support (more countries showed a downward trend) for the U in similar data from 2013 (post-crisis), possibly because the eldest cohorts were harder hit by financial crisis.
Cultural background is a source of diversity deserving of more attention in research on age and well-being. Steptoe et al. (2015) showed stark national differences around the world on the Cantril ladder with the U found only in high-income English-speaking countries. National differences are not equivalent to cultural differences, but culture could play a role in trajectories of SWB. Diener and Suh (1999), for example, argued that compared to people in individualist cultures, life evaluations of individuals in collectivist cultures are more determined by interpersonal than personal concerns, and SWB is lower in collectivist nations. Oishi (2010) drew attention to the complexities in considering well-being and culture, including cultural differences in concepts, measurement, and correlates of well-being. Identifying sources of short-term and longer-term variability in happiness trajectories is likely to lead to a more nuanced and precise understanding that will be more helpful for designing prevention/intervention programs and shaping social policies to increase well-being at all ages compared to pronouncing midlife as the low point in the life course.
To be sure, midlife can be a low point for some not only in terms of ratings of happiness but also as manifested in more serious trends. As reported in recent analyses of United States population data (Case & Deaton, 2015), morbidity and mortality is increasing dramatically among middle-aged men with less than a high school education. Suicide is highest at ages 45-64 years (Suicide Prevention Resource Center, 2018). It is possible that a midlife dip in happiness at the population level could, in part, reflect these more serious cases of low well-being. Research is needed to learn more about the determinants and pathways to extreme midlife difficulties such as depression as well as to less severe manifestations of unhappiness captured in the U-shape research (Lachman, 2015). Some pathways will be rooted in earlier behaviors and histories, and changing social and economic contexts may shape some trends. Hence, it is critically important to not only conduct more research on mid-life well-being but to take a long-term (i.e., longitudinal) perspective on its development.
Conclusions
Given increasing attention by governments around the world to indicators of national well-being for informing and shaping social policies and programs (Diener, Kesebir, & Lucas, 2008; Helliwell et al., 2013), promoting the U-shape in happiness as an accurate account of how people develop across the life course may be doing an injustice not only to the complexities of research but to efforts to improve global well-being. Decisions about resource allocation demand appropriate conduct and interpretation of scientific studies based on methodologically rigorous designs and analyses. Given the body of evidence over recent years, we cannot conclude there is a universal U-shape in happiness. Furthermore, we are not the only researchers drawing this conclusion (see e.g., Laaksonen, 2018; Li, 2016).
Equally important, it is of limited scientific and applied value to attempt to identify a single curve describing how people move through the life course compared to examining individual differences in how and why people change across different segments of the lifespan in different contexts. Moreover, generalizing from small age differences (in primarily cross-sectional research) to conclusions about a universal crisis in midlife is misleading (Wethington, 2000; Whitbourne, 2010).
We believe that understanding happiness across the life course requires a multi-disciplinary, collaborative approach that will move the field forward. Drawing distinctions between disciplines (i.e., psychologists vs. economists) is less helpful than agreeing to work towards better research designs, measurement of critical constructs, and statistical analyses. Authors of articles presented in Table 1 come from a variety of backgrounds, departments, institutions, and countries. Psychologists, economists, sociologists, and epidemiologists are among the many scholars who can contribute.
We have several recommendations for steps that can be taken to facilitate understanding across disciplines with an eye toward establishing fruitful multidisciplinary collaborations: (1) In published work, include clear statements about study design (e.g., cross sectional; longitudinal; synthetic panel; accelerated longitudinal; sequential). Specifically, are the same people surveyed at multiple time points and, if so, for what length of time are they in a given study? (2) Report basic descriptive statistics (means, standard deviations, bivariate correlations, and percentage missing at any one point in time), allowing readers to quickly determine how raw data compares to results from more advanced modeling later in the paper. Reporting descriptive statistics would also allow other researchers to attempt to replicate study findings on the basis of these summary data. Such information could be easily provided as supplemental information online; (3) Provide the full response scale on the y-axis in graphs depicting trajectories of happiness so the reader can comprehend the magnitude of any change over time; (4) In studies with many statistical models, provide fit statistics and/or comparisons of fit so that the best-fitting model is clear; and (5) Use multiple measures of well-being, including multi-item measures and more general as well as experiential assessments, in longitudinal studies following several cohorts so that cohort, age, and period effects can be untangled and to gain a finer understanding of trajectories in complementary dimensions of SWB. Ultimately, it would be ideal if the results of research on happiness and well-being over the life course could be applied to understanding the variations within age groups with an eye towards addressing the sources and consequences of unhappiness.
Acknowledgments
This research was funded by grants from the Social Sciences and Humanities Research Council of Canada, Alberta Advanced Education, the University of Alberta, and National Institute on Aging Grants P01-AG020166 and U19-AG051426.
Contributor Information
Nancy L. Galambos, University of Alberta
Harvey J. Krahn, University of Alberta
Matthew D. Johnson, University of Alberta
Margie E. Lachman, Brandeis University
References
- Anderson JR, Van Ryzin MJ, & Doherty WJ (2010). Developmental trajectories of marital happiness in continuously married individuals: A group-based modeling approach. Journal of Family Psychology, 24, 587–596. 10.1037/a0020928 [DOI] [PubMed] [Google Scholar]
- Anderson SA, Russell CS, & Schumm WR (1983). Perceived marital quality and family life-cycle categories: A further analysis. Journal of Marriage and Family, 45, 127–139. 10.2307/351301 [DOI] [Google Scholar]
- Anonymous. (2010, December 18). The U-bend of life: Why, beyond middle age, people get happier as they get older. The Economist. Retrieved from www.economist.com/node/17722567 [Google Scholar]
- Baetschmann G (2013). Heterogeneity in the relationship between happiness and age: Evidence from the German Socio-Economic Panel. German Economic Review, 15, 393–410. 10.1111/geer.12015 [DOI] [Google Scholar]
- Baird BM, Lucas RE, & Donnellan MB (2010). Life satisfaction across the lifespan: Findings from two nationally representative panel studies. Social Indicators Research, 99, 183–203. 10.1007/s11205-010-9584-9 [DOI] [PMC free article] [PubMed] [Google Scholar]
- Baltes PB, Lindenberger U, & Staudinger UM (2006). Life span theory in developmental psychology In Damon W & Lerner RM (Eds.), Handbook of child psychology: Vol. 1. Theoretical models of human development (6th ed., pp. 569–664). New York, NY: Wiley. [Google Scholar]
- Baltes PB, & Nesselroade JR (1979). History and rationale of longitudinal research In Nesselroade JR & Baltes PB (Eds.), Longitudinal research in the study of behavior and development (pp. 1–39). New York: Academic Press. [Google Scholar]
- Bardo AR (2017). A life course model for a domains-of-life approach to happiness: Evidence from the United States. Advances in Life Course Research, 33, 11–22. 10.1016/j.alcr.2017.06.002 [DOI] [Google Scholar]
- Bauer JM, Levin V, Boudet AMM, Nie P, & Sousa-Poza A (2017). Subjective well-being across the lifespan in Europe and Central Asia. Population Ageing, 10, 125–158. 10.1007/s12062-016-9148-0 [DOI] [Google Scholar]
- Beja EL Jr. (2018). The U-shaped relationship between happiness and age: Evidence using World Values Survey data. Quality & Quantity, 52, 1817–1829. 10.1007/s11135-017-0570-z [DOI] [Google Scholar]
- Bell A (2014). Life-course and cohort trajectories of mental health in the UK, 1991-2008 – A multilevel age-period-cohort analysis. Social Science & Medicine, 120, 21–30. 10.1016/j.socscimed.2014.09.008 [DOI] [PubMed] [Google Scholar]
- Blanchflower DG, & Oswald AJ (2008). Is well-being U-shaped over the life cycle? Social Science & Medicine, 66, 1733–1749. 10.1016/j.socscimed.2008.01.030 [DOI] [PubMed] [Google Scholar]
- Blanchflower DG, & Oswald AJ (2019). Unhappiness and pain in modern America: A review essay, and further evidence, on Carol Graham’s Happiness for All? Journal of Economic Literature, 57, 385–402. 10.1257/jel.20171492 [DOI] [Google Scholar]
- Cantril H (1965). The pattern of human concerns. New Brunswick, NJ: Rutgers University Press. [Google Scholar]
- Carstensen LL, Isaacowitz DM, & Charles ST (1999). Taking time seriously: A theory of socioemotional selectivity. American Psychologist, 54, 165–181. 10.1037/0003-066X.54.3.165 [DOI] [PubMed] [Google Scholar]
- Carstensen LL, Turan B, Scheibe S, Ram N, Ersner-Hershfield H, Samanez-Larkin GR, Nesselroade JR (2011). Emotional experience improves with age: Evidence based on over 10 years of experience sampling. Psychology and Aging, 26(1, 21–33. 10.1037/a0021285 [DOI] [PMC free article] [PubMed] [Google Scholar]
- Case A, & Deaton A (2015). Rising morbidity and mortality in midlife among white non-Hispanic Americans in the 21st century. PNAS, 112, 15078–15083. 10.1073/pnas.1518393112 [DOI] [PMC free article] [PubMed] [Google Scholar]
- Cheng TC, Powdthavee N, & Oswald AJ (2015). Longitudinal evidence for a midlife nadir in human well-being: Results from four data sets. The Economic Journal, 127, 126–142. 10.1111/ecoj.12256 [DOI] [PMC free article] [PubMed] [Google Scholar]
- Daroudi R, Rashidian A, Zeraati H, Oliyaeemanesh A, & Sari AA (2016). Life and health satisfaction in the adult population of Iran. Epidemiology and Health, 38, e2016047 10.4178/epih.e2016047 [DOI] [PMC free article] [PubMed] [Google Scholar]
- Diener E, Emmons RA, Larsen RJ, & Griffin S (1985). The Satisfaction With Life Scale. Journal of Personality Assessment, 49, 71–75. 10.1207/s15327752jpa4901_13 [DOI] [PubMed] [Google Scholar]
- Diener E, Kahneman D, Tov W, & Arora R (2010). Income’s association with judgments of life versus feelings In Diener E, Kahneman D, & Helliwell J (Eds.), International differences in well-being (pp. 3–15). Oxford: Oxford University Press. [Google Scholar]
- Diener E, Inglehart R, & Tay L (2013). Theory and validity of life satisfaction scales. Social Indicators Research, 112, 497–527. 10.1007/s11205-012-0076-y [DOI] [Google Scholar]
- Diener E, Kesebir P, & Lucas R (2008). Benefits of accounts of well-being – For societies and for psychological science. Applied Psychology: An International Review, 57, 37–53. 10.1111/j.1464-0597.2008.00353.x [DOI] [Google Scholar]
- Diener E, & Suh EM (1999). National differences in subjective well-being In Kahneman D, Diener E, & Schwarz N (Eds.), Well-being: The foundations of hedonic psychology (435–450). New York: Russell Sage Foundation. [Google Scholar]
- Diener E, Suh EM, Lucas RE, & Smith HL (1999). Subjective well-being: Three decades of progress. Psychological Bulletin, 125, 276–302. 10.1037/0033-2909.125.2.276 [DOI] [Google Scholar]
- Dolan P, Kudrna L, & Stone A (2017). The measure matters: An investigation of evaluative and experience-based measures of wellbeing in time use data. Social Indicators Research, 134, 57–73. 10.1007/s11205-016-1429-8 [DOI] [PMC free article] [PubMed] [Google Scholar]
- Easterlin RA (2006). Life cycle happiness and its sources: Intersections of psychology, economics, and demography. Journal of Economic Psychology, 27, 463–482. 10.1016/j.joep.2006.05.002 [DOI] [Google Scholar]
- Elder GH Jr., Johnson MK, & Crosnoe R (2003). The emergence and development of life course theory In Mortimer JT & Shanahan MJ (Eds.), Handbook of the life course (pp. 3–19). New York: Academic/Plenum Publishers. [Google Scholar]
- Elovainio M, Pulkki-Råback L, Jokela M, Kivimåki M, Hintsanen M, Hintsa T,Keltikangas-Järvinen L (2012). Socioeconomic status and the development of depressive symptoms from childhood to adulthood: A longitudinal analysis across 27 years of follow-up in the Young Finns study. Social Science & Medicine, 74, 923–929. 10.1016/j.socscimed.2011.12.017 [DOI] [PubMed] [Google Scholar]
- Ferrante F (2017). Great expectations: The unintended consequences of educational choices. Social Indicators Research, 131, 745–767. 10.1007/s11205-016-1268-7 [DOI] [Google Scholar]
- Field D (1997). “Looking back, what period of your life brought you the most satisfaction?” International Journal of Aging and Human Development, 45, 169–194. 10.2190/RAW0-2JXU-XMBJ-3UJY [DOI] [PubMed] [Google Scholar]
- Freund AM, & Ritter JO Midlife crisis: A debate. Gerontology, 55, 582–591. 10.1159/000227322 [DOI] [PubMed] [Google Scholar]
- Frijters P, & Beatton T (2012). The mystery of the U-shaped relationship between happiness and age. Journal of Economic Behavior & Organization, 82, 525–542. 10.1016/j.jebo.2012.03.008 [DOI] [Google Scholar]
- Galambos NL, Barker ET, & Krahn HJ (2006). Depression, self-esteem, and anger in emerging adulthood: Seven-year trajectories. Developmental Psychology, 42, 350–365. 10.1037/0012-1649.42.2.350 [DOI] [PubMed] [Google Scholar]
- Galambos NL, Fang S, Krahn HJ, Johnson MD, & Lachman ME (2015). Up, not down: The age curve in happiness from early adulthood to midlife in two longitudinal studies. Developmental Psychology, 51, 1664–1671. 10.1037/dev0000052 [DOI] [PubMed] [Google Scholar]
- Glenn ND (1990). Quantitative research on marital quality in the 1980s: A critical review. Journal of Marriage and Family, 52, 818–831. 10.2307/353304 [DOI] [Google Scholar]
- Glenn N (2009). Is the apparent U-shape of well-being over the life course a result of inappropriate use of control variables? A commentary on Blanchflower and Oswald (66: 8, 2008, 1733-1749). Social Science & Medicine, 69, 481–485. 10.1016/j.socscimed.2009.05.038 [DOI] [PubMed] [Google Scholar]
- Gomez V, Grob A, & Orth U (2013). Adaptive power of the present: Perceptions of past, present, and future life satisfaction across the life span. Journal of Research in Personality, 47, 626–633. 10.1016/j.jrp.2013.06.001 [DOI] [Google Scholar]
- Graham C, & Pozuelo JR (2017). Happiness, stress, and age: How the u curve varies across people and places. Journal of Population Economics, 30, 225–264. 10.1007/s00148-016-0611-2 [DOI] [Google Scholar]
- Grover S, & Helliwell JF (2019). How’s life at home? New evidence on marriage and the set point for happiness. Journal of Happiness Studies, 20, 373–390. 10.1007/s10902-017-9941-3 [DOI] [Google Scholar]
- Hakulinen C, Jokela M, Hintsanen M, Pulkki-Råback L, Hintsa T, Merjonen P, Keltikangas-Järvinen L (2013). Childhood family factors predict developmental trajectories of hostility and anger: A prospective study from childhood into middle adulthood. Psychological Medicine, 43, 2417–2426. 10.1017/S0033291713000056 [DOI] [PubMed] [Google Scholar]
- Headey B, Muffels R, & Wagner GG (2010). Long-running German panel survey shows that personal and economic choices, not just genes, matter for happiness. PNAS, 107, 17922–17926. 10.1073/pnas.1008612107 [DOI] [PMC free article] [PubMed] [Google Scholar]
- Hellevik O (2017). The U-shaped age-happiness relationship: Real or methodological artifact? Quality & Quantity, 51, 177–197. 10.1007/s11135-015-0300-3 [DOI] [Google Scholar]
- Helliwell JF, Layard R, & Sachs J (Eds.). (2018). World happiness report 2018. New York, NY: Sustainable Development Solutions Network; Retrieved from https://s3.amazonaws.com/happiness-report/2018/WHR_web.pdf [Google Scholar]
- Ingraham C (2017, August 24). Under 50? You still haven’t hit rock bottom, happiness-wise. Washington Post. Retrieved from https://www.washingtonpost.com/news/wonk/wp/2017/08/24/under-50-you-still-havent-hit-rock-bottom-happiness-wise/?utm_term=.7d6bf8a55486 [Google Scholar]
- Jones CJ, & Meredith W (2000). Developmental paths of psychological health from early adolescence to later adulthood. Psychology and Aging, 15, 351–360. 10.1037/0882-7974.15.2.351 [DOI] [PubMed] [Google Scholar]
- Karney BR, & Bradbury TN (1997). Neuroticism, marital interaction, and the trajectory of marital satisfaction. Journal of Personality and Social Psychology, 72, 1075–1092. 10.1037/0022-3514.72.5.1075 [DOI] [PubMed] [Google Scholar]
- Karney BR, & Frye NE (2002). “But we’ve been getting better lately”: Comparing prospective and retrospective views of relationship development. Journal of Personality and Social Psychology, 82, 222–238. 10.1037//0022-3514.82.2.222 [DOI] [PubMed] [Google Scholar]
- Kassenboehmer SC, & Haisken-DeNew JP (2012). Heresy or enlightenment? The well-being age U-shape effect is flat. Economics Letters, 117, 235–238. 10.1016/j.econlet.2012.05.013 [DOI] [Google Scholar]
- Kolosnitsyna M, Khorkina N, & Dorzhiev H (2017). Determinants of life satisfaction in older Russians. Ageing International, 42, 354–373. 10.1007/s12126-017-9297-3 [DOI] [Google Scholar]
- Krahn HJ, Howard AL, & Galambos NL (2015). Exploring or floundering? The meaning of employment and educational fluctuations in emerging adulthood. Youth & Society, 47, 245–266. 10.1177/0044118X12459061 [DOI] [Google Scholar]
- Kunzmann U, Richter D, & Schmukle SC (2013). Stability and change in affective experience across the adult life span: Analyses with a national sample from Germany. Emotion, 13, 1086–1095. 10.1037/a0033572 [DOI] [PubMed] [Google Scholar]
- Laaksonen S (2018). A research note: Happiness by age is more complex than U-shaped. Journal of Happiness Studies, 19, 471–482. 10.1007/s10902-016-9830-1 [DOI] [Google Scholar]
- Lachman ME, Lewkowicz C, Marcus A, & Payne Y (1994). Images of midlife development among young, middle-aged, and older adults. Journal of Adult Development, 1, 201–211. 10.1007/BF02277581 [DOI] [Google Scholar]
- Lachman ME (2015). Mind the gap in the middle: A call to study midlife. Research in Human Development, 12, 327–334. 10.1080/15427609.2015.1068048 [DOI] [PMC free article] [PubMed] [Google Scholar]
- Lachman ME, Röcke C, Rosnick C & Ryff CD (2008). Realism and illusion in Americans’ temporal views of their life satisfaction. Psychological Science, 19, 889–897. 10.1111/j.1467-9280.2008.02173.x [DOI] [PubMed] [Google Scholar]
- Lachman ME, Teshale S, & Agrigoroaei S (2015). Midlife as a pivotal period in the life course: Balancing growth and decline at the crossroads of youth and old age. International Journal of Behavioral Development, 39, 20–31. 10.1177/0165025414533223 [DOI] [PMC free article] [PubMed] [Google Scholar]
- Lavner JA, & Bradbury TN (2010). Patterns of change in marital satisfaction over the newlywed years. Journal of Marriage and Family, 72, 1171–1187. 10.1111/j.1741-3737.2010.00757.x [DOI] [PMC free article] [PubMed] [Google Scholar]
- Li N (2016). Multidimensionality of longitudinal data: Unlocking the age-happiness puzzle. Social Indicators Research, 128, 305–320. 10.1007/s11205-015-1032-4 [DOI] [Google Scholar]
- Lin YM (2016). BMI, perceived health status and happiness: The direct vs. indirect effect of obesity. International Journal of Ecological Economics and Statistics, 37, ISSN 0973-1385 (Print), ISSN 0973-7537 (Online). http://ceser.in/ceserp/index.php/ijees/article/view/4532 [Google Scholar]
- Mehlsen M, Platz M, & Fromholt P (2003). Life satisfaction across the life course: Evaluations of the most and least satisfying decades of life. International Journal of Aging and Human Development, 57, 217–236. 10.2190/R13Y-AM7C-1EBL-QWU3 [DOI] [PubMed] [Google Scholar]
- Merikangas KR, Zhang H, Avenevoli S, Acharyya S, Neuenschwander M, & Angst J (2003). Longitudinal trajectories of depression and anxiety in a prospective community study: The Zurich Cohort Study. Archives of General Psychiatry, 60, 993–1000. 10.1001/archpsyc.60.9.993 [DOI] [PubMed] [Google Scholar]
- Molenaar PCM (2008). On the implications of the classical ergodic theorems: Analysis of developmental processes has to focus on intra-individual variation. Developmental Psychobiology, 50, 60–69. 10.1002/dev.20262 [DOI] [PubMed] [Google Scholar]
- Morgan J, Robinson O, & Thompson T (2015). Happiness and age in European adults: The moderating role of gross domestic product per capita. Psychology and Aging, 30, 544–551. 10.1037/pag0000034 [DOI] [PubMed] [Google Scholar]
- Mroczek DK, & Kolarz CM (1998). The effect of age on positive and negative affect: A developmental perspective on happiness. Journal of Personality and Social Psychology, 75, 1333–1349. 10.1037/0022-3514.75.5.1333 [DOI] [PubMed] [Google Scholar]
- Mroczek DK, & Spiro A (2005). Change in life satisfaction during adulthood: Findings from the Veterans Affairs Normative Aging Study. Journal of Personality and Social Psychology, 88, 189–202. 10.1037/0022-3514.88.1.189 [DOI] [PubMed] [Google Scholar]
- Mujcic R, & Oswald AJ (2018). Is envy harmful to a society’s psychological health and wellbeing? A longitudinal study of 18,000 adults. Social Science & Medicine, 198, 103–111. 10.1016/j.socscimed.2017.12.030 [DOI] [PubMed] [Google Scholar]
- Musliner KL, Munk-Olsen T, Eaton WW, & Zandi PP (2016). Heterogeneity in long-term trajectories of depressive symptoms: Patterns, predictors and outcomes. Journal of Affective Disorders, 192, 199–211. 10.1016/j.jad.2015.12.030 [DOI] [PMC free article] [PubMed] [Google Scholar]
- Oishi S (2010). Culture and well-being: Conceptual and methodological issues In Diener E, Kahneman D, & Helliwell J (Eds.), International differences in well-being (pp. 34–69). Oxford: Oxford University Press. [Google Scholar]
- Olaroiu M, Alexa ID, van den Heuvel WJA (2017). Do changes in welfare and health policy affect life satisfaction of older citizens in Europe? Current Gerontology and Geriatrics Research, 2017, Article ID 7574040. 10.1155/2017/7574040 [DOI] [PMC free article] [PubMed] [Google Scholar]
- Orth U, Maes J, & Schmitt M (2015). Self-esteem development across the life span: A longitudinal study with a large sample from Germany. Developmental Psychology, 51, 248–259. 10.1037/a0038481 [DOI] [PubMed] [Google Scholar]
- Orth U, Trzesniewski KH, & Robins RW (2010). Self-esteem development from young adulthood to old age: A cohort-sequential longitudinal study. Journal of Personality and Social Psychology, 98, 645–658. 10.1037/a0018769 [DOI] [PubMed] [Google Scholar]
- Otterbach S, Sousa-Poza A, & Møller V (2018). A cohort analysis of subjective wellbeing and ageing: Heading towards a midlife crisis? Longitudinal and Life Course Studies, 9, 382–411. 10.14301/llcs.v9i4.509 [DOI] [Google Scholar]
- Parnes HS (1972). Longitudinal surveys: Prospects and problems. Monthly Labor Review, 95, 11–15. Retrieved from https://heinonline.org/HOL/Page?collection=journals&handle=hein.journals/month95&id=139&men_tab=srchresults [Google Scholar]
- Piper AT (2015). Sliding down the U-shape? A dynamic panel investigation of the age-well-being relationship, focusing on young adults. Social Science & Medicine, 143, 54–61. 10.1016/j.socscimed.2015.08.042 [DOI] [PubMed] [Google Scholar]
- Rauch J (2018). The happiness curve: Why life gets better after 50. New York: St. Martin’s Press. [Google Scholar]
- Reed AE, Chan L, & Mikels JA (2014). Meta-analysis of the age-related positivity effect: Age differences in preferences for positive over negative information. Psychology and Aging, 29, 1–15. 10.1037/a0035194 [DOI] [PubMed] [Google Scholar]
- Roberts BW, Walton KE, & Viechtbauer W (2006). Patterns of mean-level change in personality traits across the life course: A meta-analysis of longitudinal studies. Psychological Bulletin, 132, 1–25. 10.1037/0033-2909.132.1.1 [DOI] [PubMed] [Google Scholar]
- Röcke C, & Lachman ME (2008). Perceived trajectories of life satisfaction across past, present, and future: Profiles and correlates of subjective change in young, middle-aged, and older adults. Psychology and Aging, 23, 833–847. 10.1037/a0013680 [DOI] [PMC free article] [PubMed] [Google Scholar]
- Ruseski JE, Humphreys BR, Hallman K, Wicker P, & Breuer C (2014). Sport participation and subjective well-being: Instrumental variable results from German survey data. Journal of Physical Activity and Health, 11, 396–403. 10.1123/jpah.2012-0001 [DOI] [PubMed] [Google Scholar]
- Ryff CD (1989). Happiness is everything, or is it? Explorations on the meaning of psychological well-being. Journal of Personality and Social Psychology, 57, 1069–1081. 10.1037/0022-3514.57.6.1069 [DOI] [Google Scholar]
- Ryff CD (2014). Psychological well-being revisited: Advances in the science and practice of eudaimonia. Psychotherapy and Psychosomatics, 83, 10–28. 10.1159/000353263 [DOI] [PMC free article] [PubMed] [Google Scholar]
- Schaie KW (2000). The impact of longitudinal studies on understanding development from young adulthood to old age. International Journal of Behavioral Development, 24, 257–266. 10.1080/01650250050118231 [DOI] [Google Scholar]
- Schulenberg JE, Bryant AL, & O’Malley PM (2004). Taking hold of some kind of life: How developmental tasks relate to trajectories of well-being during the transition to adulthood. Development and Psychopathology, 16, 1119–1140. 10.1017/S0954579404040167 [DOI] [PubMed] [Google Scholar]
- Schwandt H (2016). Unmet aspirations as an explanation for the age U-shape in wellbeing. Journal of Economic Behavior & Organization, 122, 75–87. 10.1016/j.jebo.2015.11.011 [DOI] [Google Scholar]
- Shankar A, Rafnsson SB, & Steptoe A (2015). Longitudinal associations between social connections and subjective wellbeing in the English Longitudinal Study of Ageing. Psychology & Health, 30, 686–698. 10.1080/08870446.2014.979823 [DOI] [PubMed] [Google Scholar]
- Siegler IC, Costa PT, Brummett BH, Helms MJ, Barefoot JC, Williams RB, Rimer BK (2003). Patterns of change in hostility from college to midlife in the UNC Alumni Heart Study predict high-risk status. Psychosomatic Medicine, 65, 738–745. 10.1097/01.PSY.0000088583.25140.9C [DOI] [PubMed] [Google Scholar]
- Steptoe A, Deaton A, & Stone AA (2015). Subjective wellbeing, health, and ageing. The Lancet, 385, 640–648. 10.1016/S0140-6736(13)61489-0 [DOI] [PMC free article] [PubMed] [Google Scholar]
- Stone AA, Schwartz JE, Broderick JE, & Deaton A (2010). A snapshot of the age distribution of psychological well-being in the United States. PNAS, 107, 9985–9990. 10.1073/pnas.1003744107 [DOI] [PMC free article] [PubMed] [Google Scholar]
- Suddath C (2017, August 29). Is midlife crisis real? Psychologists and economists can’t agree. Bloomberg. Retrieved from www.bloomberg.com/news/articles/2017-08-29/is-the-midlife-crisis-real-economists-and-psychologists-can-t-agree [Google Scholar]
- Suicide Prevention Resource Center. (2018). Suicide by age. Retrieved from http://www.sprc.org/scope/age
- Sutin AR, Terracciano A, Milaneschi Y, An Y, Ferrucci L, & Zonderman AB (2013). The trajectory of depressive symptoms across the adult life span. JAMA Psychiatry, 70, 803–811. 10.1001/jamapsychiatry.2013.193 [DOI] [PMC free article] [PubMed] [Google Scholar]
- Ulloa BFL, Møller V, & Sousa-Poza A (2013). How does subjective well-being evolve with age? A literature review. Journal of Population Ageing, 6, 227–246. 10.1007/s12062-013-9085-0 [DOI] [Google Scholar]
- VanLaningham J, Johnson DR, & Amato P (2001). Marital happiness, marital duration, and the U-shaped curve: Evidence from a five-wave panel study. Social Forces, 79, 1313–1341. 10.1353/sof.2001.0055 [DOI] [Google Scholar]
- Weiss A, King JE, Inoue-Murayama M, Matsuzawa T, & Oswald AJ (2012). Evidence for a midlife crisis in great apes consistent with the U-shape in human well-being. PNAS, 109, 19949–19952. 10.1073/pnas.1212592109 [DOI] [PMC free article] [PubMed] [Google Scholar]
- Wethington E (2000). Expecting stress: Americans and the “midlife crisis.” Motivation and Emotion, 24, 85–103. 10.1023/A:1005611230993 [DOI] [Google Scholar]
- Whitbourne SK (2010). The search for fulfillment. New York, NY: Ballantine Books. [Google Scholar]
- Wunder C, Wiencierz A, Schwarze J, & Küchenhoff H (2013). Well-being over the life span: Semiparametric evidence from British and German longitudinal data. The Review of Economics and Statistics, 95, 154–167. 10.1162/REST_a_00222 [DOI] [Google Scholar]
- Xing Z, & Huang L (2014). The relationship between age and subjective well-being: Evidence from five capital cities in Mainland China. Social Indicators Research, 117, 743–756. 10.1007/s11205-013-0396-6 [DOI] [Google Scholar]
- Yap SCY, Anusic I, & Lucas RE (2014). Does happiness change? Evidence from longitudinal studies In Sheldon KM & Lucas RE (Eds.), Stability of happiness: Theories and evidence on whether happiness can change (pp. 127–145). New York, NY: Elsevier; 10.1016/B978-0-12-411478-4.00007 [DOI] [Google Scholar]