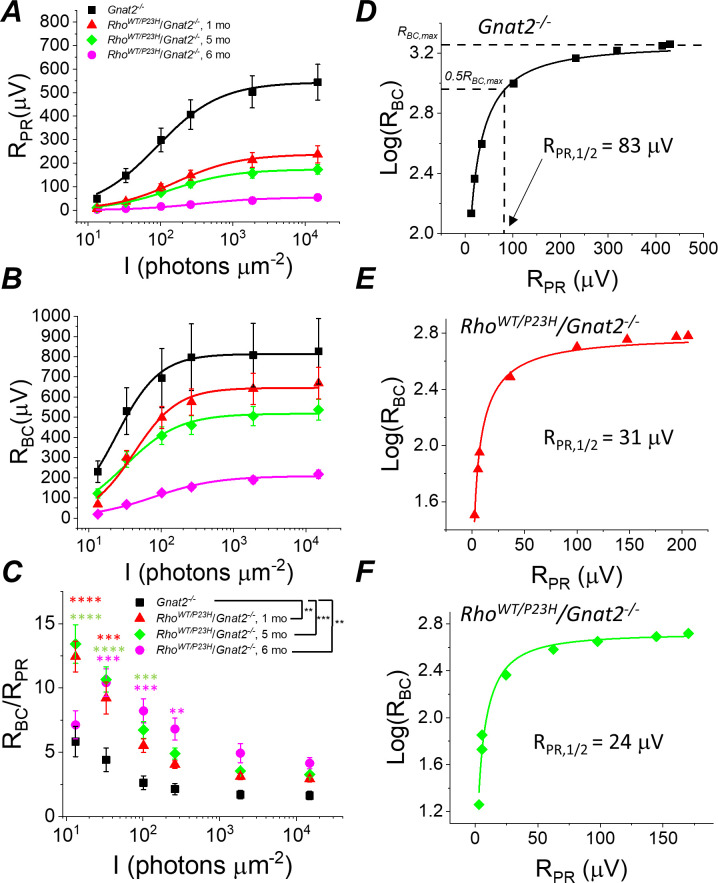
Figure 5. Sensitivity of rod bipolar cell responses to their rod input increases in P23H/Gnat2-/- mice.
Ex vivo ERG rod (A) and RBC (B) response amplitudes, and their ratio (C) derived as in Figure 4. (D–F) RBC plotted as a function of RPR in individual retinas from Gnat2-/- control (D), and one month (E) and five month (F) P23H/Gnat2-/- mice. Smooth lines in A and B plot Equation 1 fitted to mean data. Smooth lines in D-F plot Equation 2 fitted to data from individual retinas. *p<0.05, **p<0.005, ***p<0.001, ****p<0.0001. Statistics for Rmax and intensity required to generate half-maximal rod or RBC response (I1/2) as well as RPR,1/2 are in Table 1. In C, two-way ANOVA followed by Bonferroni’s post hoc test was used to compare between-subjects main effect and the intensity where a significant effect was found, respectively. (Pooled control, 1–6 mo, n = 7 (11); P23H, one mo, n = 4 (6); five mo, n = 11(18); six mo, n = 2 (4) mice(retinas)).


