Abstract
Ca12Ga14O33 was successfully synthesized using a wet chemistry technique to promote the homogenous mixing of the Ca and Ga cations. Rietveld refinements on X-ray and neutron powder diffraction data confirm that the compound is isostructural to Ca12Al14O33, however, with a significantly larger lattice parameter allowing for the cages that result from the framework arrangement to expand. In naturally occurring Ca12Al14O33, the mineral mayenite, these cages are occupied by O2− anions, however, experimental studies exchanging the O2− anions with other anions has led to a host of applications, depending on the caged anion. The functional nature of the structure, where framework distortions coupled with cage occupants, are correlated to electronic band structure and modifications to the framework could lead to interesting physical properties. The phase evolution was tracked using thermogravimetric analysis and high temperature X-ray diffraction and showed a lower formation temperature for the Ca12Ga14O33 analogue compared to Ca12Al14O33 synthesized using the same wet chemistry technique. Analyzing both X-ray and neutron powder diffraction using the Rietveld method with two different starting models results in one structural model, with one Ca position and the caged O on a 24d special position, being preferred.
Subject terms: Structure of solids and liquids, Materials for energy and catalysis, Materials science
Introduction
The atomic structure of Ca12Al14O33, also known as C12A7, consists of a positively charged cage-like framework where occluded anions occupy a fraction of the cages to balance the positively charged framework. The diffusion of anions from cage to cage allows the material high ion mobility and the potential for ion storage1. This functionality leads to applications for Ca12Al14O33 as a CO2 absorber2, a catalyst3, and as an inorganic electride4. The highly functional nature of the material raises questions about isostructural compounds and their potential properties. Framework distortion and cage occupancy are correlated to electronic band structure changes responsible for electrical insulator to conductor transition. Further modifications to the framework through alteration of cations and charge balancing anions in the structure should lead to changes in physical properties; the alteration of material properties with atomic substitutions has been experimentally and theoretically explored and are summarized in5. The ionic radius of Ga3+ in fourfold coordination with O is 47 pm compared to the 39 pm radius of Al3+6 suggesting that this substitution could result in a cage with a larger diameter. Partial site replacement of tri-valent Al cations has been performed with similar tri-valent Ga cations. However, results led to the conclusion that the single phase (Ca12Al14-xGaxO32)O formed when x = 1 and when x = 2 both Ca5Ga6O14 and Ca3Al2O6 were observed in addition to Ca12Al12Ga2O337. When Ca12Al13GaO33 was subjected to reducing conditions at 1350 °C for 6 h, buried in graphite powder, the compound decomposed to Ca3Al2O6 and Ca12Al14−xGaxO337. The cause of decomposition is not known, but Ca12Al14O33 structure in general demonstrates complicated thermodynamic instability/stability trends under dry reducing conditions above 1100 °C8, 9. The influence of Ga on the cage structure and localized electron behavior could alter the physical properties including the mobility of occluded species, either atomic, molecular, or electrons, and the electrical conductivity.
The existence of Ca12Ga14O33 has been theorized due to the similarity of the CaO–Al2O3 and CaO–Ga2O3 binary phase diagrams and existence of isostructural compounds from the two systems including Ca5Ga6O14 and CaGa4O7. Many versions of the CaO–Al2O3 binary phase diagram exist due to the importance of CaO–Al2O3 compounds to the cement industry. Using the Phase Diagrams for Ceramist online database 24 CaO–Al2O3 phase diagrams result with the earliest dating back to a 1955 dissertation10 followed by a 1956 version in the 2nd Edition of The Chemistry of Cement and Concrete11. The latter shows the Ca12Al14O33 compound and although some of the details have been refined the overall phase diagram remains generally unchanged. In 2001 Jerebstov and Mikhailov12 published the CaO-Al2O3 diagram developed under anhydrous conditions and without moisture was not able to synthesis the Ca12Al14O33 compound supporting an earlier observation by Nurse et al.13. In contrast when using the Phase Diagrams for Ceramist online database three CaO–Ga2O3 phase diagrams result. All three phase diagrams14–16 show the compounds Ca3Ga2O6, CaGa2O4, and CaGa4O7 and the phase diagrams by Young15 and Kovba et al.16 show Ca3Ga4O9 as a fourth intermediate compound. Conducting a database search of CaO–Ga2O3 compounds using the Inorganic Crystal Structure Database (ICSD)17 two other intermediate compounds, Ca2Ga2O518 and Ca5Ga6O1419–21 have been reported, the former being synthesized with high-pressure. Londar22 grew Ca5Ga6O14 crystals using the Czochralski method and starting with a 12CaO:7Ga2O3 mixture. Tolkacheva et al.23 synthesized Ca5Ga6O14 using solid state synthesis techniques and characterized the compound using X-ray diffraction, infrared and Raman spectroscopy, differential scanning calorimetry, thermogravimetric analysis, density measurements, and dilatometry. The latter was studied in both dry and moist atmospheres and after the sample was heated under moist conditions X-ray diffraction revealed CaGa2O4, Ga2O3, and CaCO3, thought to have transformed from CaO during cooling in an environment where CO2 was present.
It has previously been identified that the Ca5Al6O14 phase forms through decomposition kinetics of Ca12Al14O33, indicating that Ca12Ga14O33 may be stable at low temperatures8, 24. Similar to Ca12Al14O33 it is expected the thermodynamic stability of the Ca12Ga14O33 (ρ = 3.54 g/cm3) will be dependent on availability of anions that are able to stabilize cage structure over the layered and more dense CaGa4O7 (ρ = 4.46 g/cm3), Ca3Ga4O9 (ρ = 4.21 g/cm3), and Ca5Ga6O14 (ρ = 4.12 g/cm3) phases.
Here we report on the successful synthesis of Ca12Ga14O33 through a solution-based route, provide a crystal structure characterization from X-ray and neutron powder diffraction data, evaluate the phase formation through thermogravimetric analysis (TGA) and high temperature X-ray diffraction (HTXRD) studies, and compare and contrast the Ca12Al14O33 and Ca12Ga14O33 compounds. Solution synthesis allows for homogenous mixing of the metal atoms, shortening diffusion pathways and allowing for kinetically favorable, but thermodynamically unfavorable, phases to form.
Experimental and methods
The polymer assisted sol–gel synthesis method was employed utilizing poly vinyl alcohol (PVA)25. The 88% hydrolyzed PVA, with molecular weight between 20,000 and 30,000 g/mol, was dissolved in deionized water and allowed to stir for 1 h and Ca(NO3)2·4H2O (ACS Grade, Fisher Chemical) and GaCl3 (99.99 +%, Acros Organics) were dissolved separately into deionized water. The stoichiometry of the solutions was characterized through gravimetric titration. For synthesis, stoichiometric amounts of the Ca(NO3)2 and GaCl3 solutions were added to the PVA solution and allowed to stir for 1 h prior to heating. A 4:1 ratio of the number of metal cations to PVA monomer units was used as previously identified as the ideal amount for Ca12Al14O338. The solution was heated on a 300 °C hotplate until most of solvent evaporated and the solution became viscous. The viscous liquid was placed in a 120 °C drying oven for 12 h and dried to a light foam; foaming occurs due to the evaporation of nitrate and chloride species. The foam was ground to a fine powder and divided for the various characterization studies.
Thermogravimetric Analysis (TGA) was performed on the dried non calcined polymer powder using a TA Instruments Q50 TGA. The sample was heated at a constant rate of 10 °C/min from 25 to 650 °C. Mass loss was recorded as a function of temperature.
A fraction of the powder was then calcined to 600 °C, based on the TGA data, to decompose the organics to allow for clean processing in the XRD environmental chamber, and immediately quenched. The resulting calcined powder was pressed into a 13 mm pellet. The remaining organic/inorganic PVA powder was retained for further thermal processing. Both room temperature and HTXRD data were collected using a Malvern PANalytical Empyrean diffractometer with a Cu radiation source operating with an accelerating voltage of 45 kV and current of 40 mA. A PIXcel3D area detector with 255 active channels with ~ 3°2θ of coverage was used for rapid non-ambient data collection. For non-ambient data collection the sample was heated at 5 °C/min up to 800 °C, then the rate was slowed to 1.5 °C/min as the sample was heated to 1000 °C. Data were collected in the range from 25 to 36.5°2θ, this region contains major peaks related to the Ca12Ga14O33 phase and possible secondary phases including Ga2O3, Ca5Ga6O14, CaGa2O4, CaGa4O7, and Ca3Ga4O, and CaO. Using a 0.0131° step size and 13.77 s counting time each scan was approximately 1.5 min allowing for phase transitions to be detected while they occur. A longer data collection range, from 15–80°2θ, was used at 1000 °C to determine the full diffraction pattern and evaluate the evolved phases. The non-calcined powder was pressed into a pellet and was fired at 800 °C for 1 h. Subsequently ambient temperature data were collected from 15–120°2θ in high spatial resolution mode to verify the structure of the material and allow for refinement on the structural details including the lattice parameter, atomic positions, and atomic displacement parameters.
Time-of-flight powder neutron diffraction data were collected on the Nanoscale Ordered Materials Diffractometer (NOMAD) beamline26 of the Spallation Neutron Source (SNS) at Oak Ridge National Laboratory (ORNL). About 1.5 g of near single-phase sample was contained in a 6 mm V sample canister. The partially calcined powder was fired at 800 °C for 1 h prior to loading the sample canister. NOMAD’s detectors were calibrated using diamond, and silicon was used to generate the starting instrumental parameters. S(Q) was produced through normalizing the sample scattering via a solid vanadium rod and subtracting the background collected for an empty 6 mm V sample canister. Four individual data sets were collected and merged together for the data analysis.
HighScore Plus software package27 interfaced with the ICDD PDF4 + database28 was used for phase identification and the GSAS II software package29 was used for the analyzing both the XRD and neutron diffraction data using the Rietveld method. For the data collected the lowest possible R obtainable for the data or wRmin, based in part on the number of data points and calculated in GSAS II, was 10.39% for the XRD data and 0.43% for the NPD data.
Results and discussion
TGA characterization
Thermogravimetric analysis of the Ca12Ga14O33 PVA powder, shown in Fig. 1, displays three decomposition stages during the heating. The first stage, from 25 °C to approximately 425 °C, shows the evaporation of residual H2O and other volatiles remaining in the sample. When PVA is heated, polymer condensation reactions occur releasing structurally trapped water and causing polyenes to form and additional weight loss is due to the decomposition of the newly formed polyenes25. In this region the decomposition follows a relatively constant slope, indicating that decomposition is uniform as the temperature increases. This is ideal for preventing segregation of species within the sample during calcination. The sharp drop in mass above 425 °C is likely caused by the oxidation of carbonaceous residue left by polymer decomposition25. The sample experiences no further weight loss above 450 °C indicating that the remaining components in the sample are inorganic. The TGA results suggest that between 500 and 600 °C is the optimal temperature for calcination to ensure that all organics decompose. The sample experienced a total weight loss of 35% making this a high yield solution-based synthesis method.
Figure 1.
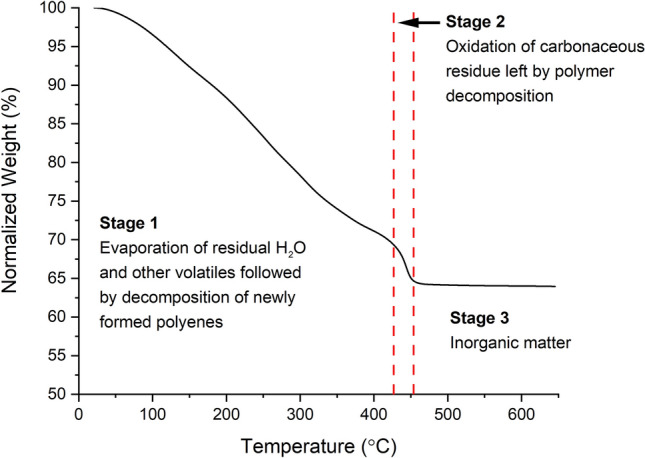
TGA showing the decomposition of the organics to inorganic matter from the unfired material.
XRD characterization
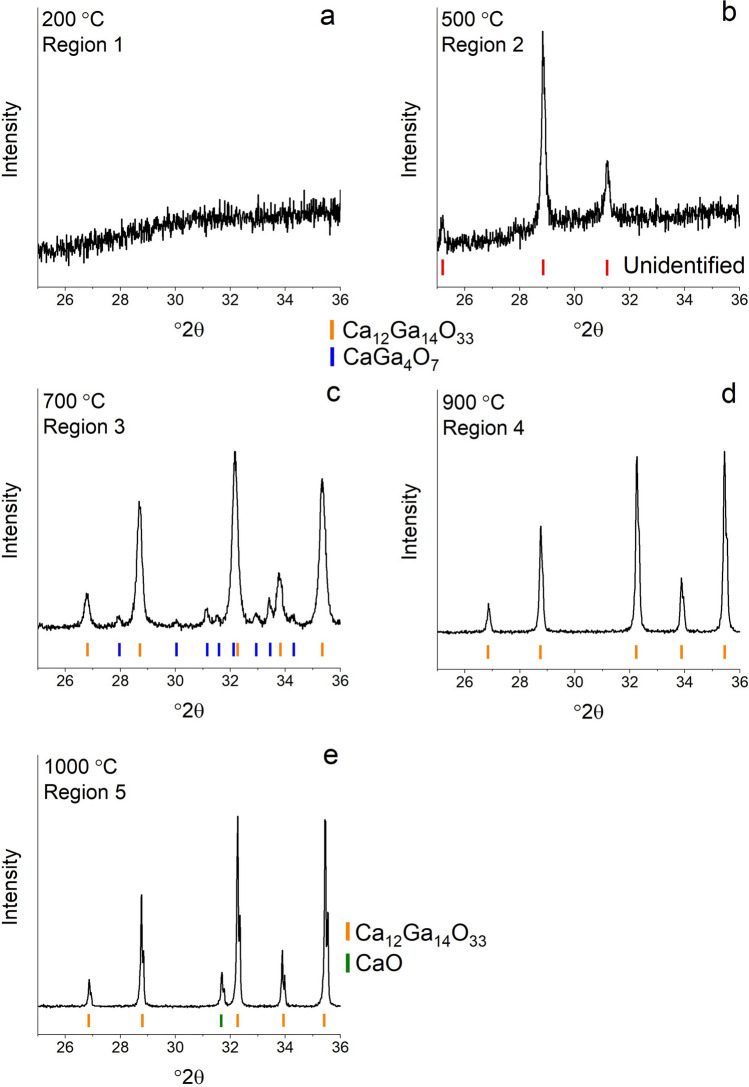
In-situ high temperature X-ray diffraction was used to observe phase transformations during heating in the data range from 25 to 36.5°2θ. The intensity heat map of the scans is shown in Fig. 2 and has five distinct phase regions. Representative patterns from each temperature region are shown in Fig. 3. Data collected on the 600 °C pre-calcined pellet shows that at temperatures below approximately 300 °C the sample is amorphous (Fig. 3a). After calcination most of the organics have been removed and a structureless mix of metal and oxygen atoms remains, with no diffraction peaks present in the data range. When heated above approximately 300 °C, two peaks appear at 28.9 and 31.2°2θ (Fig. 3b). In an attempt to identify the phase(s) that form between 300 and 650 °C data were collected in a larger °2θ range, between 10–80°2θ, and is shown in Fig. 4, revealing additional peaks associated with the phase(s). Despite attempts using the HighScore Plus software and the ICDD PDF4 + database, with and without chemical constraints, the peaks remain unidentified and could be representing either a single phase or a multiphase mixture. The sample had previously been heated to 600 °C during calcination to remove the organics, so this phase transformation is likely an atmospheric response of the amorphous Ca, Ga, and O species. At approximately 650 °C the unknown phase(s) disappear(s) and a multiphase mixture forms with peaks suggesting a compound isostructural to the Ca12Al14O33, with Ga substituted on the Al sites, along with CaGa4O7 (ICSD 10351) as a minor secondary phase (Fig. 3c). The peaks belonging to the Ca12Ga14O33 compound get sharper and more intense as the temperature increases, consistent with phase and crystallite growth. CaGa4O7 is present between 650 and 750 °C disappearing above 750 °C. The presence of this Ga rich phase could indicate a non-equilibrium assemblage that forms due to the high heating rate or potentially during the solution-based synthesis where nonstoichiometric areas of the precursor form but get quickly removed when the diffusion increases with higher temperature. Above 750 °C (Fig. 3d) single phase Ca12Ga14O33 is present until a new peak at approximately 31.5°2θ appears at 975 °C (Fig. 3e). To identify the additional phase that is represented by the new peak, data were collection on a larger °2θ range (10–80°2θ) at 1000 °C. It was confirmed that the peak belongs to the CaO and using the Rietveld technique results in 19.8(3) wt% of CaO with all peaks in the pattern accounted for by either Ca12Ga14O33 or CaO.
Figure 2.
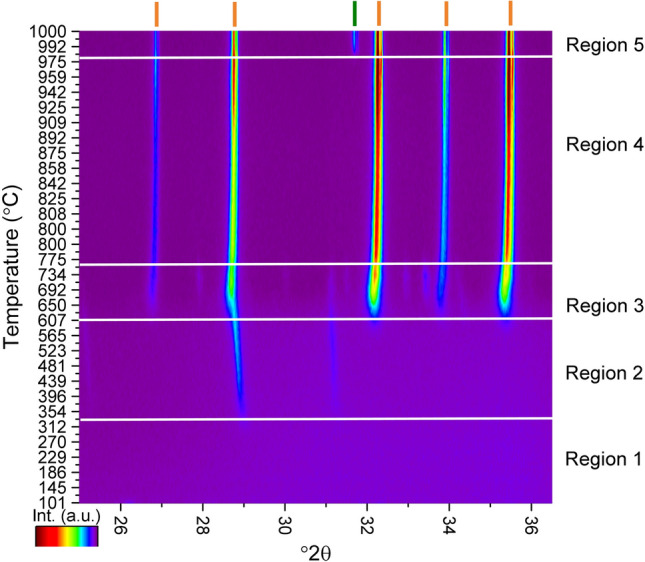
Intensity map of the HTXRD data from the pellet calcined at 600 °C. The orange dashes indicate the Ca12Ga14O33 phase and the green dashes mark the CaO phase. Heatmap generated using the HighScore Plus software package27, dash marks for indicating the CaO and Ca12Ga14O33 phases determined from the ICSD17 and ICDD28 databases.
Figure 3.
Representative X-ray powder diffraction data from selected temperature regions identified from the HTXRD results. Data collected at (a) 200 °C, (b) 500 °C, (c) 700 °C, (d) 900 °C, and (e) 1000 °C. Dash marks for indicating the CaO, CaGa4O7, and Ca12Ga14O33 phases determined from the ICSD17 and ICDD28 databases.
Figure 4.
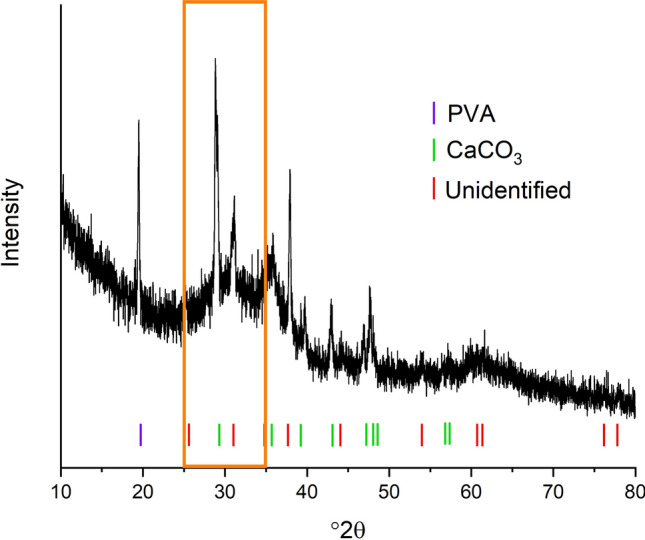
Larger data collection range collected at 500 °C. The region in the box corresponds to the region collected during the fast data collection (Fig. 3b). Data collected on PVA and peak markers for CaCO3 are included for comparison. Dash marks for indicating the PVA and CaCO3, phases determined from the ICSD17 and ICDD28 databases.
A pellet of the amorphous sol–gel reactants was fired at 800 °C to form Ca12Ga14O33 and high spatial resolution X-ray diffraction data were collected on the powdered sample at room temperature to verify the phase purity and characterize the crystal structure. To verify the crystal structure Rietveld refinements using two different models, based on the Ca12Al14O33 structure, were attempted. The two slightly different atomic structures were reported by Bartl and Scheller30, determined from single crystal X-ray diffraction data, and Boysen et al.31 (ICSD 241000) determined from neutron powder diffraction data. Both structures crystallized in the cubic crystal system, space group (space group number 220) and with a unit cell edge close to 12 Å. The structure by Boysen et al.31 differed from the structure by Bartl and Scheller30 by having two unique partially occupied Ca positions on 24d sites as opposed to one fully occupied Ca 24d site. Another difference between the two reported structures is that Bartl and Scheller30 placed the caged O on a 24d site (x, 0, ¼, specifically 0.337, 0, ¼) with a corresponding site occupancy of 0.083 for filling approximately two of the 12 cages/unit cell. Boysen et al.31 working with neutron powder diffraction data, which is more sensitive to the O atoms (the bound coherent neutron scattering lengths for Ca, Al, and O are 4.70, 3.449, and 5.803 fm, respectively32) moved the caged O from 0.337 to 0.375 or the 12a site (, 0, ¼) with a correspondingly higher site occupancy for filling approximately two of the 12 cages/unit cell. Additional studies have been carried out using synchrotron radiation to understand the details of the cage distortions and cage occupancy33, 34. The intent of the characterization studies presented here is not to provide crystallographic details but to confirm the isostructural nature of Ca12Ga14O33 to Ca12Al14O33 and the model that fits best.
When using the structure with the two unique partially occupied Ca sites and caged O on the 12a site31 and changing the Al atoms to Ga atoms, it was impossible to refine on the atomic displacement parameter (adp) for the O atom in the cage center without the isotropic atomic displacement parameter (Uiso) going negative. If the adps for all three oxygens in the structure were constrained together, a positive Uiso was obtained but it was impossible to refine on the site occupancy factor of the caged oxygen and obtain a physically reasonable result. When the site occupancy factor was fixed at and the Uiso of the three oxygens constrained together, plausible results were obtained, however, there were intensity mismatches, shown in Fig. 5, for several of the peaks including the (211), (400), (420), and (422). The resulting agreement factor for the refinement is wR = 18.54% for a goodness of fit (GOF) (wR/wRmin) of 1.79. When using the structure with only one Ca position and the caged O on a 24d site30 and changing the Al atoms to Ga atoms it was possible to refine on the adps of the oxygen atoms separately and the site occupancy factor of the caged oxygen. The intensity differences, between the calculated XRD pattern and the observed data, for the reflections discussed above were smaller, as shown in Fig. 6, and a better overall structural model is supported by the resulting smaller wR = 14.94% and the GOF = 1.44. Upon close examination there were a few additional weak peaks but these were accounted for by adding a small amount of CaGa4O735 as a secondary phase, resulting in a wR = 13.75% and GOF = 1.33 with 1.9(2) wt% CaGa4O7. Experimental and refinement details, crystal data, and refined fractional coordinates, site occupancy factors, and isotropic thermal parameters are given in Tables 1, 2, and 3, respectively. The above suggests the better structural model for Ca12Ga14O33 is the model with only one Ca position and the caged O in the 24d site30. However, given the low occupancy of any atomic or molecular species occluded in the cage, coupled with the occluded species having fewer electrons than the framework elements, Ca and Ga, the best structural model will depend on the elusive occluded atomic or molecular species.
Figure 5.
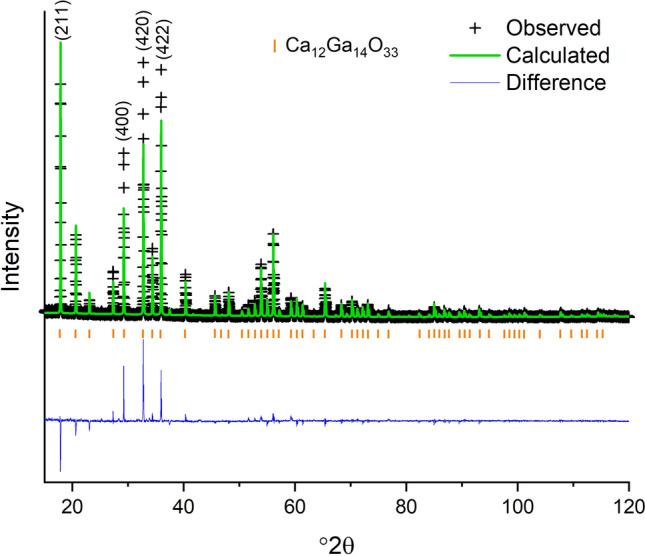
Room temperature XRD data (black crosses), calculated XRD pattern based on the atomic structure with two partially occupied Ca positions and the caged oxygen on the 12a site (green line) and difference pattern (blue line). Graphic generated using the GSAS II software package29, dash marks for indicating the Ca12Ga14O33 phase determined from the ICSD17 and ICDD28 databases.
Figure 6.
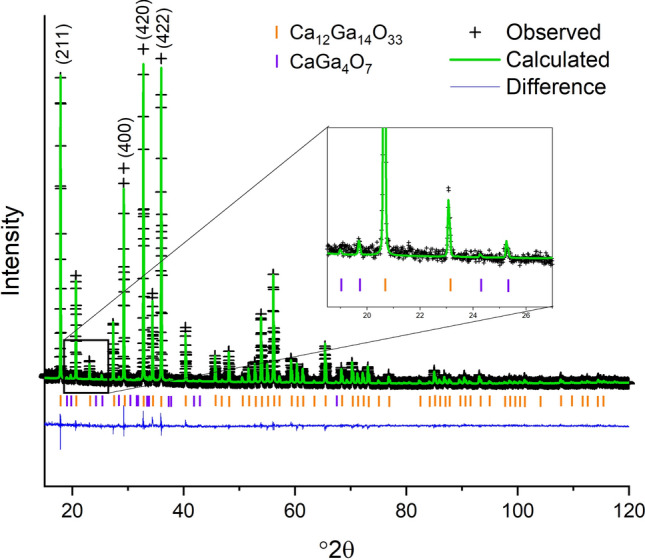
Room temperature XRD data (black crosses), calculated XRD pattern based on the atomic structure with one unique Ca position and the caged oxygen on the 24d site (green line) and difference pattern (blue line). The inset shows a smaller range that contains peaks belonging to CaGa4O7. Graphic generated using the GSAS II software package29, dash marks for indicating the Ca12Ga14O33 and CaGa4O7 phases determined from the ICSD17 and ICDD28 databases.
Table 1.
Experimental information, refinement parameters, and results.
| XRD | NPD | |||
|---|---|---|---|---|
| Model | 2 Ca | 1 Ca | 2 Ca | 1 Ca |
| Caged O site | 12a | 24d | 12a | 24d |
| Goodness of fit, GOF | 1.79 | 1.33 | 16.59 | 16.61 |
| wR (%) | 18.54 | 13.75 | 4.83 | 4.84 |
| Instrument type | Bragg–Brentano | Debye–Scherrer | ||
| Data range | 15–120°2θ | 0.4–5 d (Å) | ||
| Variables | 17 | 28 | 59 | 57 |
| Background | 3 | 3 | 24 | 24 |
| Lattice parametera | 12.2992(3) | 12.2993(3) | 12.316(3) | 12.316(3) |
| Sample parameters | ||||
| Histogram Scale | 1.824(9) | 2.093(9) | 1/bank | 1/bank |
| Sample displacement (μm) | − 472.9(7) | − 472.8(6) | ||
| Instrument parameters | 1 | 3 | 14 | 14 |
| Atomic positions | 7 | 7 | 7 | 7 |
| Adps (Uiso) | 4 | 6 | 6 | 6 |
| Site occupancy factors (caged O) | 0 | 1 | 1 | 1 |
| Second phase (CaGa4O7) wt% | – | 1.92(9) | – | – |
| Lattice parameters for CaGa4O7, a, b, c, and β | – | 4 | – | – |
aLattice parameter estimated standard deviations are reported as 3σ.
Table 2.
Crystal data for Ca12Ga14O33.
| Color | White |
|---|---|
| Crystal system | Cubic |
| Space group | (220) |
| a (Å) | 12.2993(3) |
| Volume (Å3) | 1860.5(2) |
| Z | 2 |
| Formula/refined formula | Ca12Ga14O33/Ca12Ga14O39.5 |
| Formula weight/refined (g/mol) | 1985.025/2081.019 |
| Calculated density/refined (g/cm3) | 3.54/3.71 |
Table 3.
Refined fractional coordinates, site occupancy factors (sof) and isotropic thermal parameters (Uiso).
| Atom | Mult/Wy | x | y | z | sof | Uiso |
|---|---|---|---|---|---|---|
| X-ray powder diffraction data | ||||||
| Ca | 24d | 0 | 0.1402(3) | 1 | 0.0234(13) | |
| Ga | 16c | 0.01796(12) | 0.01796(12) | 0.01796(12) | 1 | 0.0231(8) |
| Ga | 12b | 0 | 1 | 0.0239(11) | ||
| O | 48e | 0.1542(5) | − 0.0356(6) | 0.0661(6) | 1 | 0.029(3) |
| O | 16c | − 0.0611(8) | − 0.0611(8) | − 0.0611(8) | 1 | 0.038(6) |
| O | 24d | 0.4(7) | 0 | 0.625(14) | 0.113(13) | |
| Time-of-flight neutron powder diffraction data | ||||||
| Ca | 24d | 0 | 0.1433(3) | 1 | 0.017(1) | |
| Ga | 16c | 0.0190(1) | 0.0190(1) | 0.0190(1) | 1 | 0.0058(5) |
| Ga | 12b | 0 | 1 | 0.0055(6) | ||
| O | 48e | 0.1559(2) | − 0.0288(2) | 0.0633(2) | 1 | 0.0142(5) |
| O | 16c | − 0.0654(2) | − 0.0654(2) | − 0.0654(2) | 1 | 0.030(1) |
| O | 24d | 0.38(2) | 0 | 0.610(9) | 0.046(3) | |
Neutron powder diffraction characterization
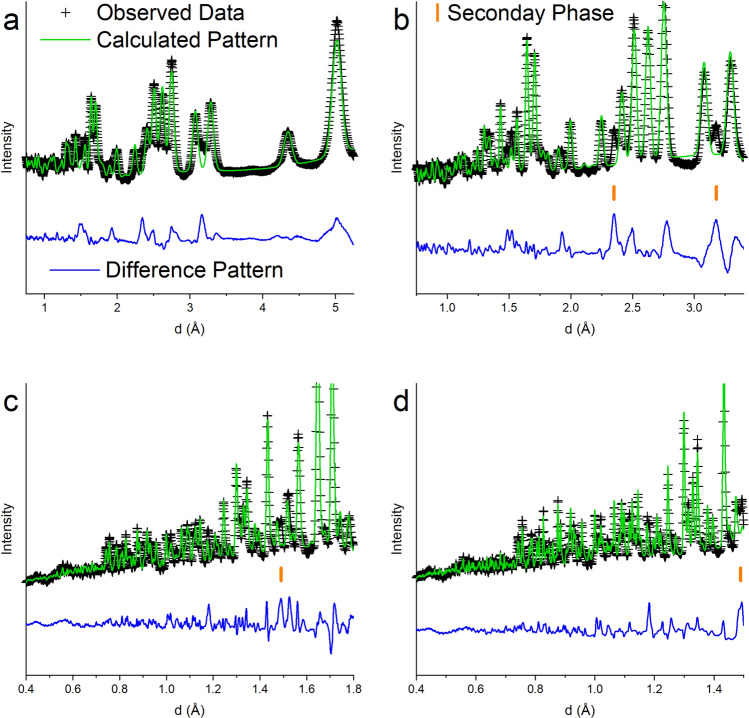
Four detector banks of time-of-flight neutron powder diffraction data were collected at room temperature. The data show an elevated background, approximately four times that of the background of the data collected on the Si Standard Reference Material (SRM) (NIST Si 640 E). One reason for the elevated background could be the occupational disorder of the caged O coupled with positional disorder detailed by31, 32. Both crystallographic models30, 31 discussed above were attempted to determine which structural model provided a better fit to the neutron diffraction data. The refinement agreement factors using the model with one Ca position and caged O in the 24d site30 were almost identical (wR = 4.84% and GOF = 16.61 refining on 57 variables) to those obtained using the crystallographic structural model with two unique Ca sites and the caged O on the 12a site31 (wR = 4.83% and GOF = 16.59 refining on 59 variables). However, using the model with the two unique Ca positions and the caged O on the 12a site when the site occupancy of the caged O was refined it resulted in a value > 1 and poor background fitting using the same function and number of coefficients. The refined lattice parameter obtained from the neutron powder diffraction data, a = 12.316(3) Å (lattice parameter esds reported as 3σ), is significantly larger than the lattice parameter, a = 12.2993(3) Å, refined based on the X-ray diffraction data. Figure 7 compares the calculated patterns, generated from the refined variables, to the observed data in each of the four detector banks. The neutron powder diffraction data show a few unexplained peaks, marked in Fig. 7, at d = 3.17, 2.35, and 1.49 Å [the peak at d = 1.49 Å could be the (300)], suggesting a secondary phase is present. The X-ray diffraction data show secondary phase peaks belonging to CaGa4O7 and this phase was incorporated into the Rietveld analysis and the phase fraction was refined to 1.9(2) wt%. The phase diagrams suggest either CaGa4O7, CaGa2O4 or Ca3Ga4O9 (depending on which phase diagram is correct) should be present in equilibrium, however, none of these compounds have reflections at or near 3.17 and 2.35 Å. Other compounds that were considered included Ca5Ga6O14, CaO, and CaCO3 (calcite) but none of these compounds matched the unexplained peaks. Calcite showed the most promise, however, the lattice parameters would need to be shifted far off of the literature values. The search was also opened up to both compounds with the calcite structure but a larger unit cell volume as well as Ca, Ga, O, and H compounds (e.g. Ca(OH)2, CaO2·8H2O, etc.) but no promising matches were identified. The difficulty in determining secondary phases in this study could be due to the ability to definitively determine amount of cage occupant, to charge balance of the cages are occupied by a O2− anion. When using the structural model with one Ca position and the caged O on the 12a position30 the site occupancy fraction (sof) of the caged oxygen refined to 0.610(9), only slightly lower than that determined by the X-ray powder diffraction study (sof = 0.62(1)), and still high compared to sof = 0.167 that should result if one out of every six cages are occupied. Figure 8 illustrates how manually changing the site occupancy of the caged oxygen atom has a significant impact on several of the peaks in the neutron powder diffraction pattern. Future work using total scattering or pair distribution function (pdf) analysis on time-of-flight neutron powder diffraction data will reveal more information for a better understanding of the nanoscale structural features of the compound and specifically about the atom(s) present in the Ca12Ga14O33 cages. The results presented here are only to provide a second characterization technique that supports the synthesis of Ca12Ga14O33.
Figure 7.
Room temperature time-of-flight neutron powder diffraction data (black crosses) from four detector banks, calculated NPD pattern based on the atomic structure with one unique Ca position and the caged oxygen on the 24d site (green line) and difference pattern (blue line). Graphic generated using the GSAS II software package29. Unidentified peaks are marked by the orange dash marks.
Figure 8.
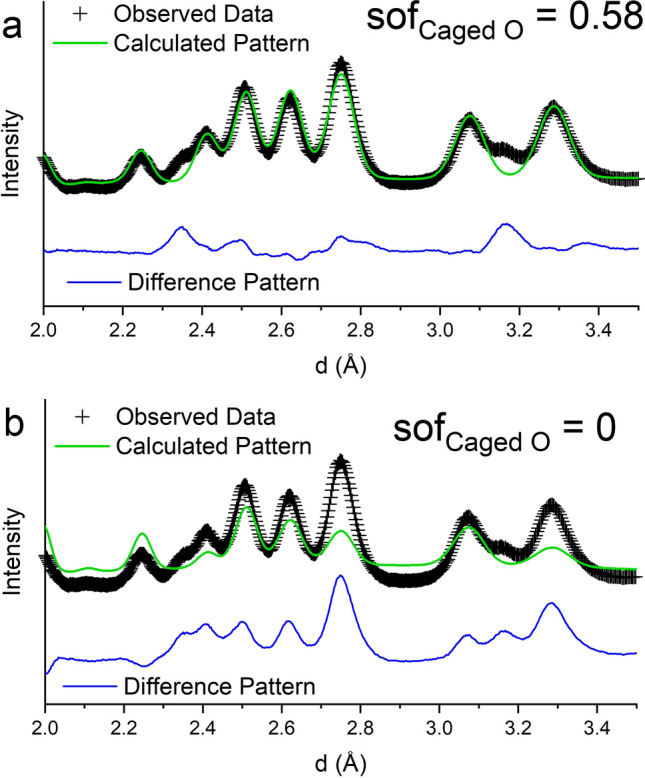
Comparison of the observed data (black crosses) to calculated time-of-flight neutron powder diffraction patterns where the occupancy of the caged O is varied (a) sof = 0.58 and (b) cage is empty (sof = 0). Graphic generated using the GSAS II software package29.
Comparison of Ca12Ga14O33 to Ca12Al14O33 and conclusions
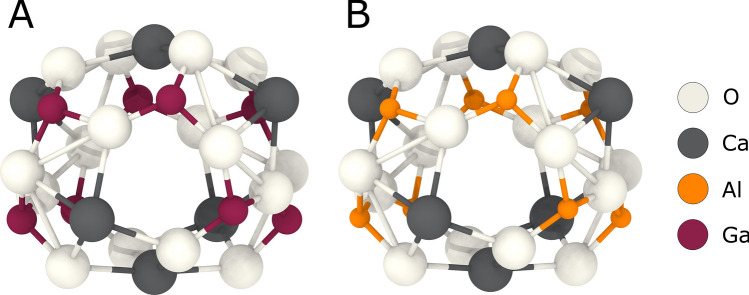
Ca12Ga14O33 was successfully synthesized using the polymer-assisted steric entrapment method25. X-ray and neutron diffraction data indicate that the new compound is isostructural to Ca12Al14O33 with a full exchanged of Al to Ga. HTXRD showed a formation temperature of 650 °C, which is significantly lower than that observed for Ca12Al14O33 synthesized in a similar manner8. The best refinement, based on both the laboratory XRD and time-of-flight neutron powder diffraction data, resulted with the model that only has one Ca position and the caged O on the 24d site. The refined lattice parameter for the new Ca12Ga14O33 compound is a = 12.2993(3) Å (XRD), approximately 2.6% larger than the 11.9794 Å of Ca12Al14O3331. This expansion in lattice parameter leads to a 1.6% expansion of the cages as shown in Fig. 9. The larger framework and cages potentially open the possibility of occluding larger molecular species within the cage. Future work is needed to elucidate the current cage occupants, better understand the local structure of the compound, determine potential processing conditions that converts the compound into an electride structure, and evaluate the changes in electrical properties based on cage occupants.
Figure 9.
Comparison of Ca12Al14O33 (A) and Ca12Ga14O33 (B) cages. The distance between the Ca at the top and bottom of the cage, indicated by the dashed line, is 5.642 Å in the Ca12Al14O33 cage and 5.734 Å in the Ca12Ga14O33 cage. This corresponds to a 1.6% expansion in the cage diameter. Graphic generated using the OVITO software package36.
Acknowledgements
SEAM was partially supported by funding from the State of Tennessee and Tennessee Higher Education Commission (THEC) through their support of the Center for Materials Processing. XRD characterization was performed at the Joint Institute for Advanced Materials (JIAM) Diffraction Facility, located at the University of Tennessee, Knoxville. A portion of this research used resources at the Spallation Neutron Source, a DOE Office of Science User Facility operated by the Oak Ridge National Laboratory.
Author contributions
S.E.A.M. conceptualized synthesizing Ca12Ga14O33 using the wet chemistry technique employed in the research and synthesized the compound, collected the TGA, HTXRD, and ambient temperature XRD data, and prepared the figures. J.R.S. provided technical direction. S.M.E. collected the NPD data. C.J.R. analyzed the XRD and NPD data. S.E.A.M. and C.J.R. wrote the main manuscript text and J.R.S. and S.M.E. contributed to the manuscript text. All authors reviewed the manuscript.
Competing interests
The authors declare no competing interests.
Footnotes
Publisher's note
Springer Nature remains neutral with regard to jurisdictional claims in published maps and institutional affiliations.
References
- 1.Lacerda M, Irvine JTS, Glasser FP, West AR. High oxide ion conductivity in Ca12Al14O33. Nature. 1988;332:525–526. doi: 10.1038/332525a0. [DOI] [Google Scholar]
- 2.Li ZS, Cai NS, Huang YY. Effect of preparation temperature on cyclic CO2 capture and multiple carbonation—calcination cycles for a new Ca-based CO2 sorbent. Ind. Eng. Chem. Res. 2006;45:1911–1917. doi: 10.1021/ie051211l. [DOI] [Google Scholar]
- 3.Li CS, Hirabayashi D, Suzuki K. Development of new nickel based catalyst for biomass tar steam reforming producing H2-rich syngas. Fuel Process. Technol. 2009;90:790–796. doi: 10.1016/j.fuproc.2009.02.007. [DOI] [Google Scholar]
- 4.Trofymluk O, Toda Y, Hosono H, Navrotsky A. Energetics of formation and oxidation of microporous calcium aluminates: a new class of electrides and ionic conductors. Chem. Mater. 2005;17:5574–5579. doi: 10.1021/cm051662w. [DOI] [Google Scholar]
- 5.Salasin, J.R. & Rawn, C.J. Structure property relationships and cationic doping in [Ca24 Al28 O64]4+ framework: A Review. Crystals7, 1–25. 10.3390/cryst7050143 (2017).
- 6.Shannon RD. Revised effective ionic radii and systematic studies of interatomic distances in halides and chalcogenides. Acta Crystallogr. 1976;A32:751–776. doi: 10.1107/S0567739476001551. [DOI] [Google Scholar]
- 7.Palacios L, Bruque S, Aranda MAG. Structure of gallium-doped mayenite and its reduction behaviour. Phys. Status Solidi B. 2008;245:666–672. doi: 10.1002/pssb.200743425. [DOI] [Google Scholar]
- 8.Salasin JR, Rawn CJ. In-situ kinetic investigation of calcium aluminate formation. Ceramics. 2018;1:175–197. doi: 10.3390/ceramics1010016. [DOI] [Google Scholar]
- 9.Salasin JR, Schwerzler SEA, Mukherjee R, Keffer DJ, Sickafus KE, Rawn CJ. Direct formation and structural characterization of electride C12A7. Materials. 2019;12:1–22. doi: 10.3390/ma12010084. [DOI] [PMC free article] [PubMed] [Google Scholar]
- 10.Wisnyi, L. G. The High Alumina Phases in the System Lime-Alumina. Ph.D. Dissertation (Rutgers University, New Brunswick, 1955).
- 11.Lea FM, Desch CH. The Chemistry of Cement and Concrete. 2. New York: St. Martins Press; 1956. p. 637. [Google Scholar]
- 12.Jerebstov DA, Mikhailov GG. Phase diagram of the CaO-Al2O3 system. Ceram. Int. 2001;27:25–28. doi: 10.1016/S0272-8842(00)00037-7. [DOI] [Google Scholar]
- 13.Nurse RW, Welch JH, Majumdar AJ. The CaO-Al2O3 system in a moisture-free atmosphere. Trans. Br. Ceram. Soc. 1965;64:409–418. [Google Scholar]
- 14.Jeevaratnam J, Glasser FP. The system CaO-Ga2O3. J. Am. Ceram. Soc. 1961;44:563–566. doi: 10.1111/j.1151-2916.1961.tb11658.x. [DOI] [Google Scholar]
- 15.Young IM. The central region of the calcium oxide–gallium oxide system. J. Mater. Sci. 1979;14:3008–3010. doi: 10.1007/BF00611492. [DOI] [Google Scholar]
- 16.Kovba, L. M., Lykova, L. N. & Kalinina, T. A. Zh. Neorg. Khim.25,725–728 (1980) [Russ. J. Inorg. Chem. (Engl. Transl.), 25,397–399 (1980)].
- 17.Inorganic Crystal Structure Database (ICSD), FIZ Karlsruhe. https://icsd.products.fiz-karlsruhe.de/
- 18.Kahlenberg V, Shaw CSJ. Ca2Ga2O5: a new high pressure oxogallate. Zh. fur Kristallographie. 2001;216:206–209. doi: 10.1524/zkri.216.4.206.23257. [DOI] [Google Scholar]
- 19.Bilyi AI, Bruskov VA, Grin JN, Zavalij PJ, Kravchishin VV, Nosenko AE. Crystal structure of Ca5Ga6O14. Kristallografiya. 1986;31:1217–1219. [Google Scholar]
- 20.Merinov BV, Londar SL, Zakharko YM. Crystal structure of Ca5Ga6O14 (5CaO·Ga2O3) Kristallografiya. 1988;33:242–244. [Google Scholar]
- 21.Lucco-Borlera M, Brisi C. Composition and structural type of the most basic compound in the CaO–Ga2O3 system. J. Less-Common Met. 1986;125:L1–L3. doi: 10.1016/0022-5088(86)90102-5. [DOI] [Google Scholar]
- 22.Londar SL. Electroconductivity of Ca5Ga6O14 crystals. Phys. Status Solidi (A) 1994;146:765–770. doi: 10.1002/pssa.2211460221. [DOI] [Google Scholar]
- 23.Tolkacheva AS, Shkerin SN, Kuzmin AV, Plaksin SV, Korzun IV, Kochedykov VA, Yaroslavtseva TV, Vovkotrub EG. Synthesis, structure, and thermal properties of Ca5Ga6O14. Russ. J. Phys. Chem. A. 2018;92:1243–1247. doi: 10.1134/S0036024418070294. [DOI] [Google Scholar]
- 24.Salasin JR, Schwerzler SEA, Koehler MR, Keffer DJ, Rawn CJ. The effect of process parameters on the amorphous citrate sol-gel synthesis of Cu-doped Ca12Al14O33. Materialia. 2018;4:466–477. doi: 10.1016/j.mtla.2018.11.003. [DOI] [Google Scholar]
- 25.Nguyen MH, Lee SJ, Kriven WM. Synthesis of oxide powders by way of a polymeric steric entrapment precursor route. J. Mater. Res. 1999;14:3417–3426. doi: 10.1557/JMR.1999.0462. [DOI] [Google Scholar]
- 26.Neuefeind J, Feygenson M, Carruth J, Hoffmann R, Chipley KK. The nanoscale ordered materials diffractometer NOMAD at the spallation neutron source SNS. Nucl. Instrum. Methods Phys. Res. B. 2012;287:68–75. doi: 10.1016/j.nimb.2012.05.037. [DOI] [Google Scholar]
- 27.Degen T, Sadki M, Bron E, König U, Nénert G. The HighScore suite. Powder Diffr. 2014;29(Suppl 2):S13–S18. doi: 10.1017/S0885715614000840. [DOI] [Google Scholar]
- 28.Gates-Rector S, Blanton T. The powder diffraction file: a quality materials characterization database. Powder Diffr. 2019;34:352–360. doi: 10.1017/S0885715619000812. [DOI] [Google Scholar]
- 29.Toby BH, Von Dreele RB. GSAS-II: the genesis of a modern open-source all purpose crystallography software package. J. Appl. Crystallogr. 2013;46:544–549. doi: 10.1107/S0021889813003531. [DOI] [Google Scholar]
- 30.Bartl H, Scheller T. Zur struktur des 12CaO*7Al2O3. Neues Jahrb. fur Mineral. 1970;35:547–552. [Google Scholar]
- 31.Boysen H, Lerch M, Stys A, Senyshyn A. Structure and oxygen mobility in mayenite (Ca12Al14O33): a high-temperature neutron powder diffraction study. Acta Crystallogr. B. 2007;63:675–682. doi: 10.1107/S0108768107030005. [DOI] [PubMed] [Google Scholar]
- 32.Sears VF. Neutron scattering lengths and cross sections. Neutron News. 1992;3:26–37. doi: 10.1080/10448639208218770. [DOI] [Google Scholar]
- 33.Palacios L, Cabeza A, Bruque S, Garcia-Granda S, Aranda MAG. Structure and electrons in mayenite electrides. Inorg. Chem. 2008;47:2661–2667. doi: 10.1021/ic7021193. [DOI] [PubMed] [Google Scholar]
- 34.Sakakura T, Tanaka K, Takenaka Y, Matsuishi S, Hosono H, Kishimoto S. Determination of the local structure of a cage with an oxygen ion in Ca12Al14O33. Acta Crystallogr. B. 2011;67:193–204. doi: 10.1107/S0108768111005179. [DOI] [PubMed] [Google Scholar]
- 35.Zheng WX, Wu HY, Ju GF, Mo Z, Dong HF, Hu YH, Jin YH. Crystal field modulation-control, bandgap engineering and shallow/deep traps tailoring-guided design of a color-tunable long-persistent phosphor (Ca, Sr)Ga4O7:Mn2+, Bi3+ Dalton Trans. 2019;48:253–265. doi: 10.1039/c8dt03566k. [DOI] [PubMed] [Google Scholar]
- 36.Stukowski A. Visualization and analysis of atomistic simulation data with OVITO—the open visualization tool. Model. Simul. Mater. Sci. Eng. 2010;18:015012. doi: 10.1088/09650393/18/1/1015012. [DOI] [Google Scholar]


