

Abstract
Background:
Skin breakdown due to limb-socket interface stress is a significant problem for lower-limb prosthesis users. While it is known that skin can adapt to stress to become more resistant to breakdown, little is understood about skin adaptation and few methods exist to noninvasively investigate it. In this study we present novel, noninvasive imaging methods using Optical Coherence Tomography (OCT) to assess key features of the cutaneous microvasculature that may be involved in skin adaptation.
Materials and Methods:
Eight able-bodied participants wore a modified below-knee prosthetic socket for two weeks to stress the skin of their lower limb. Two OCT-based imaging tests were used to assess the function and structure, respectively, of the cutaneous microvasculature at multiple time points throughout the socket wear protocol.
Results:
A measurable reactive hyperemia response was reliably induced in the skin of study participants in the vascular function assessment test. The vascular structure assessment demonstrated excellent field-of-view repeatability, providing rich data sets of vessel structure. No statistically significant differences were found in any of the measurements when compared between time points of the adaptation protocol. The participants’ limbs were likely not stressed enough by the able-bodied socket to induce measurable skin adaptation.
Conclusion:
This study introduced new techniques to investigate skin adaptation to mechanical stress. If the key limitations are addressed, these methods have the potential to provide insight into the function and structure of the cutaneous microvasculature that previously could not be attained noninvasively.
Keywords: Optical coherence tomography (OCT), Lower limb amputation, Prosthetics, Residual limb, Skin adaptation
1. Introduction
Skin breakdown is a problem that affects as many as 63% of individuals with a lower limb amputation at least once in their lifetime [1]. Commonly, skin breakdown on the residual limb is caused by repetitive mechanical stresses at the interface between the limb and the prosthetic socket, especially during weight-bearing activities. Breakdown results in pain and reduced socket use, thereby limiting mobility and decreasing the ability to perform daily activities.
Mechanically-induced skin breakdown can develop through multiple pathways. The pathway is determined by the combination of compressive, shear, and tensile stresses applied as well as the static or dynamic nature of the stresses [2]. Though the underlying physiology of prosthesis-related skin breakdown is not well-studied, some key contributing factors have been identified from an extensive body of research investigating pressure ulcers. The two primary mechanisms of pressure ulcer formation are tissue ischemia and cellular deformation [3]. In the tissue ischemia pathway, blood flow to the tissue is occluded which leads to altered cellular metabolism and a buildup of harmful metabolic byproducts. In the deformation pathway, cell membranes are mechanically damaged by high magnitude mechanical strains resulting in rapid necrotic cell death. If the skin is not given sufficient time to recover between bouts of applied stress, the cellular damage induced by these pathways will spread throughout the tissue, resulting in skin breakdown [4,5].
It is known that skin can adapt to the mechanical stresses imposed upon it in order to better resist breakdown. This occurs when skin is mechanically stressed above its current maintenance stress threshold but below its breakdown threshold [6]. This principle is employed during a period of post-amputation rehabilitation known as “prosthetic training,” when weight-bearing activity using a prosthesis is gradually increased over several weeks. If executed successfully, the residual limb tissues adapt into a more load tolerant state without suffering skin breakdown or other detrimental health effects.
Despite its important role in preventing skin breakdown, skin adaptation is not well understood. Little is known about the changes that take place within the skin that enable it to become more load tolerant and there are currently no methods for objectively determining if skin has become more load tolerant. Instead, prosthetic clinical practice relies on subjective measures such as visual assessment and palpation to determine skin load tolerance and to progress patients through an adaptation process. There is a need to provide clinicians with objective tools to monitor the load tolerance state of their patients’ skin. There is also a need for more effective methods of adapting skin so that it can better resist breakdown. At the root of these needs is a lack of understanding of skin adaptation to mechanical stress. In order to develop a better understanding, new methods are needed that can safely and accurately probe the cutaneous physiology of individuals with lower limb loss.
The goal of this work was to develop methods to investigate the biology of skin adaptation as it relates to lower limb prosthesis use. This study focused on investigating adaptations within the cutaneous microvasculature, vessels that play an important role in maintaining tissue viability. We hypothesized that adaptations to the microvasculature occur that enhance the skin’s ability to supply blood to the tissue following an occlusive stress. These adaptations may include changes in vascular structure, function, or both. Structural adaptations, such as increasing vessel count or vessel diameters may lead to more efficient blood supply or provide more pathways through which blood could circumvent an occluded region of tissue. Functional adaptations may occur that enable the vasculature to more rapidly respond to an occlusive stress, thus preventing the accumulation of harmful byproducts that allow the ischemic breakdown pathway to progress.
Optical Coherence Tomography (OCT) [7] is an optics-based imaging modality that has shown recent promise for noninvasively visualizing and measuring various features of the skin. OCT can capture images of skin to a depth of 2 mm with a resolution as fine as 1 to 10 µm [7–9]. With its recent functional extension, OCT Angiography (OCTA) [10], the cutaneous microvasculature can be imaged using the flow of red blood cells as a contrast agent [10,11]. Though other methods exist to measure the cutaneous microvasculature, such as Laser Doppler Perfusion Imaging and Laser Speckle Contrast Imaging, these methods only provide a single measurement for perfusion in a region of tissue [12]. By capturing three-dimensional images of the microvasculature, OCTA can provide rich data were several characteristics can be assessed. Additionally, the depth and region of vessels being analyzed can be precisely selected, thereby offering greater measurement repeatability. Pre-intervention and post-intervention results can thus be compared in the same tissue region.
We developed two OCT-based tests of the cutaneous microvasculature: (1) a functional assessment, and (2) a structural assessment. Additionally, we created a model for the study of prosthetic-relevant skin adaptation using individuals who do not use a prosthesis. An “able-bodied model” is useful because it enables the study of skin as it is adapting to mechanical stresses for the first time. It also eliminates confounding variables that are present when studying individuals who have recently had an amputation, such as activity limitations, suture site sensitivity, or tissue edema. The purpose of this study was to demonstrate the utility of the developed skin adaptation investigation methods on human participants and to better understand the advantages and limitations of the methods.
2. Materials and Methods
2.1. OCT Imaging System
A swept-source OCT imaging system (OCS1310V1, Thorlabs Inc., Newton, NJ, USA) was used to capture three-dimensional static OCT images of the skin tissue. OCTA microvascular images were constructed using high-sensitivity speckle variance, as described previously [13], and were converted into two-dimensional en face projections for further analysis. This process is illustrated in Figure 1. The OCT probe was modified (Supplementary Figure 1) to enable measurement of probe pressure on the skin. During imaging, the applied pressure was kept below 4.5 kPa, which is the skin contact pressure at which cutaneous blood flow can become altered [14,15]. The key OCTA image processing steps are illustrated in Supplementary Figures 2–3. Further details are described in the Supporting Information.
Figure 1.
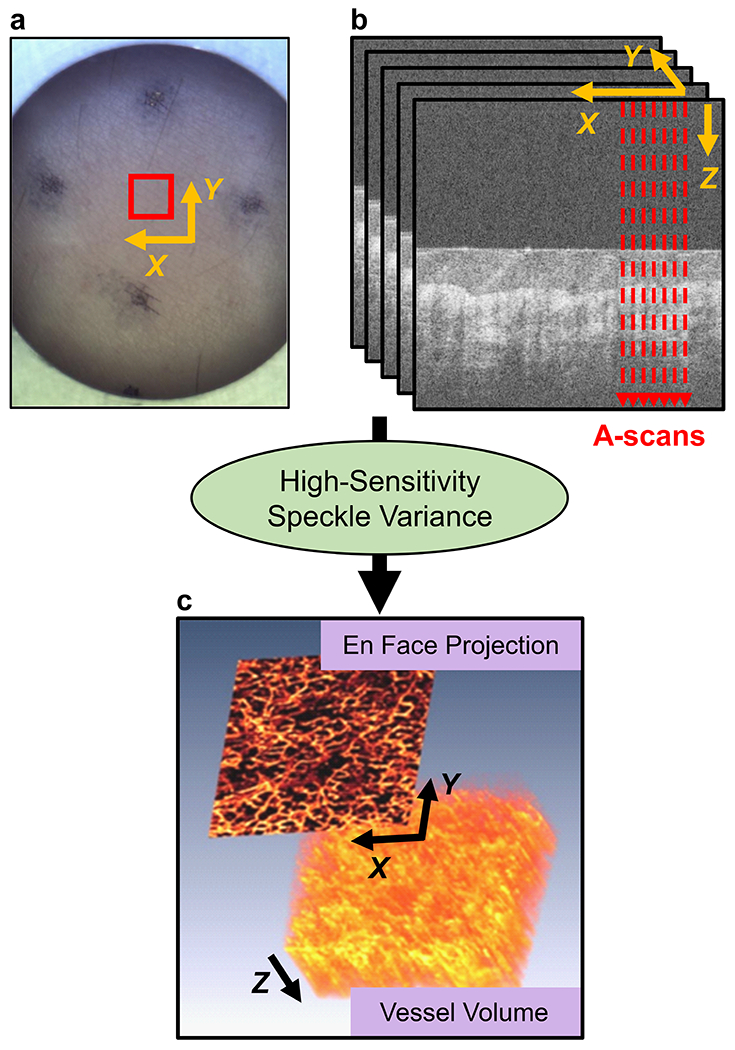
OCT image formation. (a) Skin field-of-view imaged shown by red box. (b) Five B-scan cross-section repeats were captured at each location. (c) An OCTA vessel volume was created, followed by a maximum intensity projection into a two-dimensional en face image.
2.2. Reactive Hyperemia OCT Test: Vessel Function Assessment
Microvascular function is commonly assessed by measuring a response known as reactive hyperemia (RH) [16]. RH is characterized by an increase in blood flow following an occlusive stress. In this study, a test was developed to induce and measure a RH response to a repetitive stress profile common in lower limb prosthetics (summarized in Figure 2a, details in the Supporting Information). Briefly, following an acclimation period, a baseline OCT image was captured at the region of interest (ROI). A cyclic pressure with shear was then applied for 10 minutes which mimicked stresses measured during ambulation in prosthetic sockets. OCT images were then captured every 10-15 seconds for 10 minutes. Perfusion in each two-dimensional en face vessel image was quantified as vessel area density (VAD) [13]. A curve of the RH response was then created by plotting a three-point running average of VAD. The key features used to assess the RH response were the peak VAD, time-to-peak VAD, and recovery time (illustrated in Supplementary Figure 4).
Figure 2.
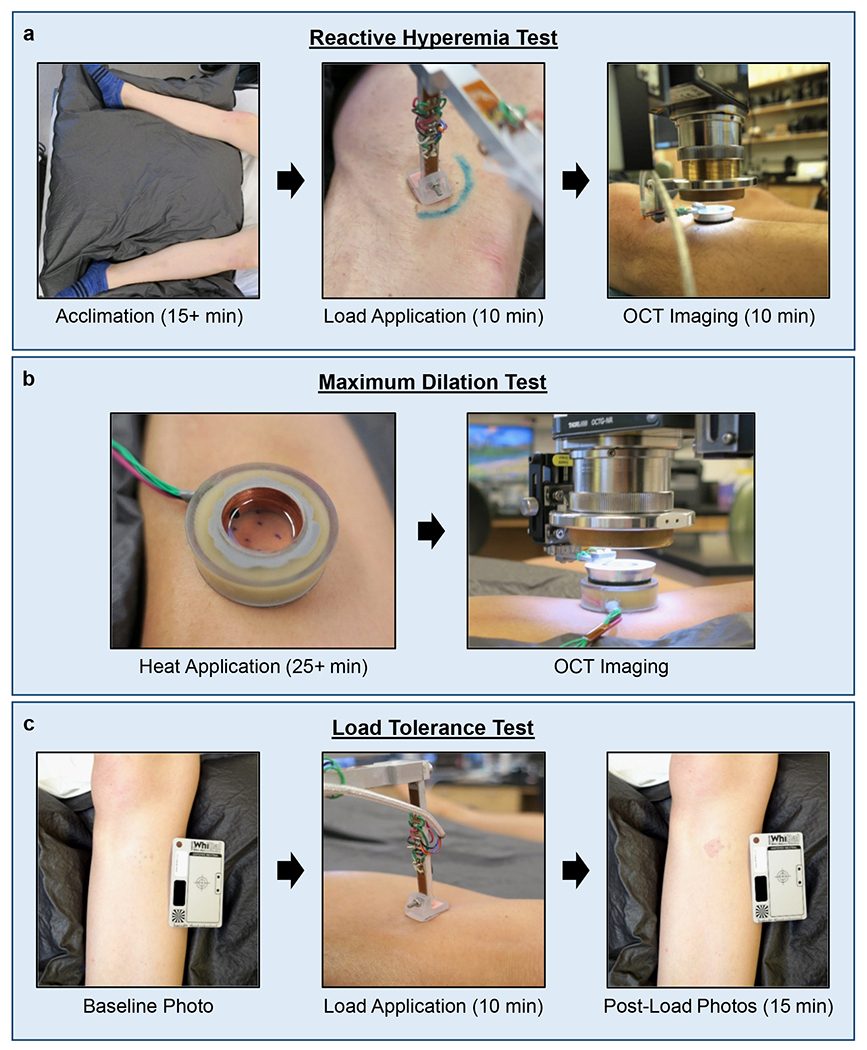
Test protocols. (a) Reactive Hyperemia Test. Began with supine acclimation period ≥15 minutes. A cyclic load was applied for 10 minutes followed by OCT image collection for 10 minutes. (b) Maximum Dilation Test. A heater probe filled with mineral oil warmed the skin to 42-44 °C for ≥25 minutes to induce maximum vessel dilation. OCT images were then taken through the oil. (c) Load Tolerance Test. Baseline photographs were taken, a load was applied for 10 minutes, and post-load photos were taken for 15 minutes.
2.3. Maximum Dilation OCT Test: Vessel Structure Assessment
In order to measure vessel structure and enable reliable comparisons at a skin site over time, a repeatable vascular state had to be induced. Consistent with prior studies [17], this was achieved by locally heating the skin to 42-44 °C for at least 25 minutes prior to imaging. This is summarized in Figure 2b with details in the Supporting Information. Vessel structure was quantified in each en face image by measuring the VAD, vessel count, and mean vessel diameter. Epidermal thickness was also quantified.
2.4. Participants
Study participants were individuals without a lower limb amputation. Several measures were taken to limit the potential for confounding factors on the cutaneous microvasculature (see Supporting Information). Participants completed an intake survey that included questions related to sunburn and suntan tendencies, which were used to estimate their Fitzpatrick Skin Phototype (FSPT), as previously described [18,19]. Study procedures were approved by a University of Washington IRB. Informed consent was obtained prior to initiating test procedures. For each participant, a test ROI was selected that was the site of investigation in all imaging sessions (see Supporting Information). This location was on the medioproximal aspect of the tibia. A location-matched site on the contralateral limb was used as the control ROI.
2.5. Able-Bodied Model for Skin Adaptation
2.5.1. Able-Bodied Socket
Able-Bodied Sockets were fabricated for the test limb of each participant (Figure 3). The socket was designed to apply mechanical stresses to the skin surface that resembled the limb-socket interface stresses in a transtibial prosthetic socket. The socket body, modeled after a patellar tendon bearing (PTB) socket, included two tethered panels that could be opened and closed to allow the foot to pass through. The panels were locked, unlocked, and tightened using a dial laminated into the socket (RevoFit, Click Medical, Steamboat Springs, CO, USA). Sensors were also incorporated. Two accelerometers (Actilife Actigraph GT3X+, Pensacola, FL, USA) were used to monitor the participants’ activity level while wearing the socket. A force sensing resistor (FSR) (Flexiforce A201, Tekscan, Inc., South Boston, MA, USA) was used to monitor the approximate interface pressure between the limb and the socket wall at the ROI. A dial sensor was used to monitor when participants adjusted the panel cable dial. The socket components and fabrication process are described in the Supporting Information.
Figure 3.
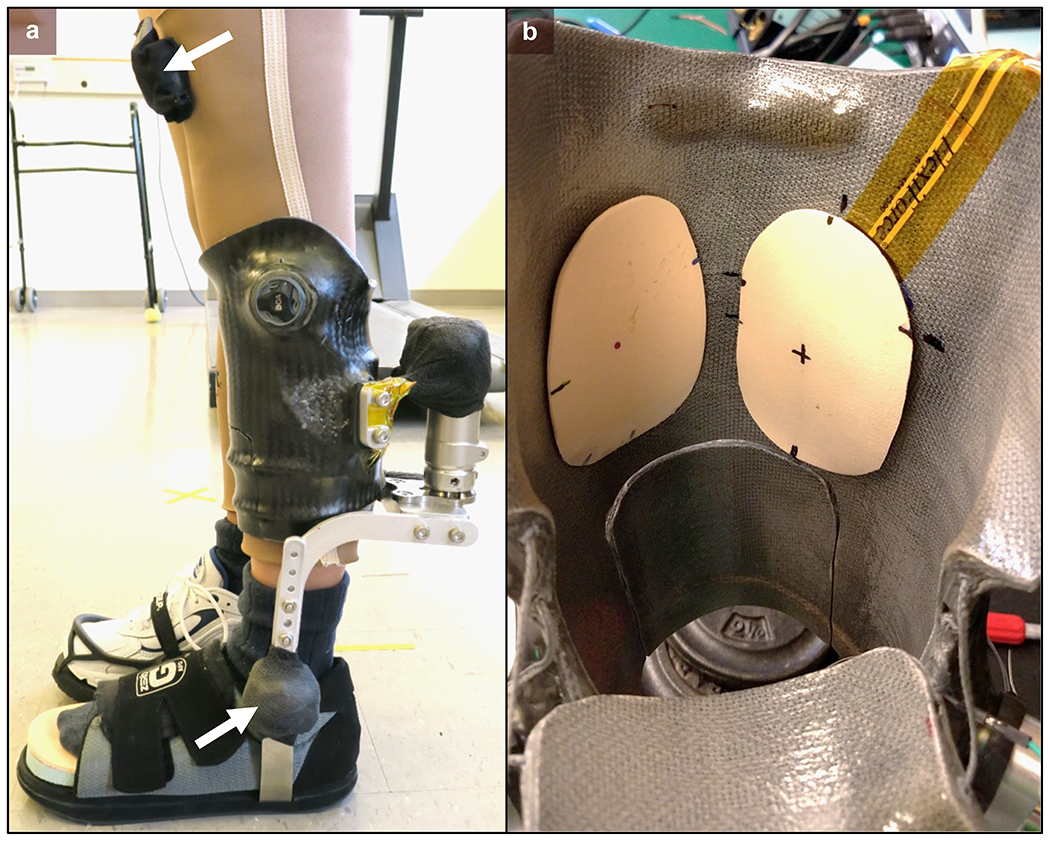
Able-Bodied Socket design. (a) Participant wearing a socket. Accelerometers used for activity classification (white arrows). (b) Inside of a socket with posterior panel opened, showing foam pads on either side of tibial crest. ROI indicated by black “+” marker on the medial pad.
2.5.2. Adaptation Protocol
The Able-Bodied Socket was worn daily for two weeks to stress the lower limb skin of participants. The daily wear protocol mirrored guidelines used in prosthetic training programs following a lower limb amputation. Participants were asked to wear the socket for approximately 10 minutes on the first day and gradually increase wear time, provided their limb tolerated the increases. A target daily wear schedule was provided (Figure 4), however, progression through the program was dictated by participant comfort and limb self-assessment.
Figure 4.
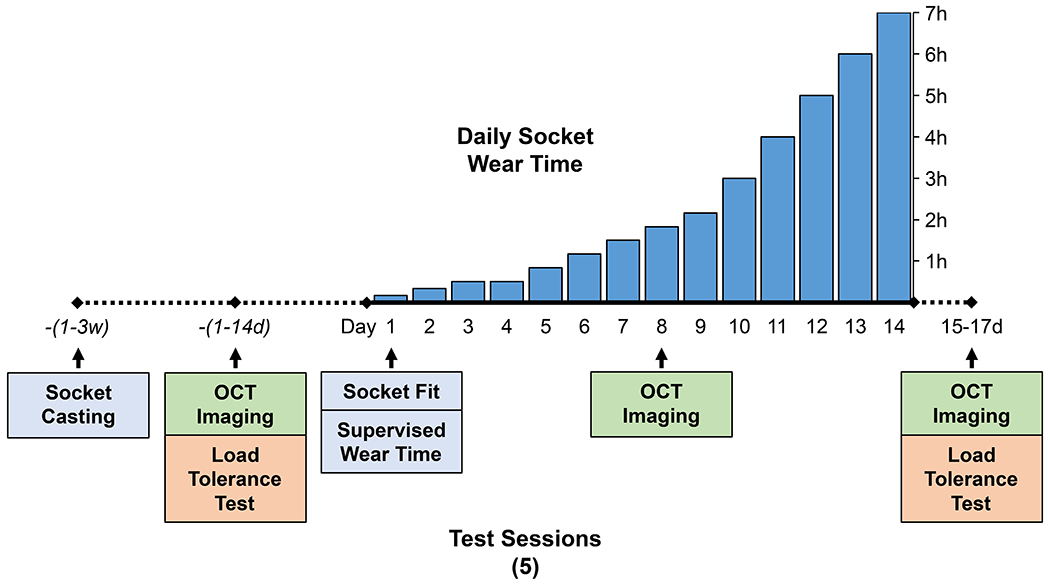
Protocol summary. Target daily socket wear schedule shown with the five study sessions indicated below the timeline.
2.5.3. Load Tolerance Test
If changes in OCT data were detected, it was important to verify the changes occurred in skin that had adapted into a more load tolerant state. Otherwise, it would not be reasonable to assume the changes were indicative of skin adaptation biology. As such, a test was performed before and after the adaptation protocol to evaluate skin load tolerance. The method was based on the current prosthetic clinical standard for assessing if skin is tolerant to an imposed load, which uses the duration of skin redness as a measure of tolerance. Skin that exhibits blanchable erythema that resolves in less than 10–20 minutes after applying a load is considered to be tolerant to the load [21,22]. To replicate this evaluation, a Load Tolerance Test was developed (Figure 2c, Supporting Information). Briefly, photographs of the limb were taken before and after a controlled load application. The photographs were randomized and presented to a physician specializing in rehabilitation of lower limb prosthetic users. For each post-load photograph, the clinician graded the skin at the ROI as “red” or “not red.” Using these grades, the time at which redness had resolved was determined.
2.6. Imaging Sessions
Imaging of the limb ROIs was conducted three times throughout the study: (1) after the ROIs were selected but before the first time the socket was worn, (2) after approximately seven days wearing the socket, and (3) one to three days following the completion of the daily socket wear protocol (Figure 4). Several precautions were taken to ensure imaging conditions were repeatable (see Supporting Information).
2.7. Data Analysis
For each participant, changes in skin were assessed by comparing OCT measurements obtained during the baseline (week 0) imaging session with those taken at the week 1 and week 2. This was done at each ROI. The differences were then compared between the test and control ROI to determine if any changes had potentially been induced by Able-Bodied Socket interface stresses (the test ROI) versus those that may have occurred due to other sources of variability or due to wearing the liner only (the control ROI). Statistical analyses were performed using SPSS statistical software (SPSS 26.0, IBM Corp., Armonk, NY, USA). Further details are described in the Supporting Information.
For Load Tolerance Test data, participants who demonstrated redness which lasted for longer than 10 minutes were considered to have not tolerated the load. Therefore, participants who had redness which lasted for longer than 10 minutes during the week 0 test and redness which lasted for 10 minutes or less during the week 2 test were considered to have increased load tolerance.
Socket activity data were analyzed for each participant as described in the Supporting Information. These data were used to verify daily socket wear time and the types of activities participants engaged in (i.e. sitting, standing, walking). FSR pressure measurements were reported as the mean of the measured peak pressures during walking.
3. Results
3.1. Participants
Eight healthy, able-bodied individuals participated in the study. Participant characteristics are described in Table 1. Participants all reported having no past or current skin injuries at the ROI on either limb, as confirmed visually by the research prosthetist.
Table 1.
Study participant characteristics.
| Characteristic | n |
|---|---|
| Age (yrs) | |
| < 25 | 6 |
| 25-50 | 1 |
| >50 | 1 |
| Gender | |
| Male | 3 |
| Female | 5 |
| Fitzpatrick Skin Type | |
| II | 1 |
| III | 1 |
| III-IV† | 2 |
| IV | 3 |
| IV-V† | 1 |
Participants’ skin phototype responses spanned two different skin types
3.2. Able-Bodied Sockets and Activity Monitoring
All participants completed the two-week wear protocol without any reported skin issues. The activity classification algorithm indicated that most participants wore the socket close to the desired total time (Supplementary Figure 5a), with a few participants wearing the socket for several hours less than the target time. Notable differences were also found between the amount of time participants spent performing higher level activities such as walking. For example, Participant 8 was the most active, accumulating 11.6 h of walking time, compared to the next participant who spent only 5.9 h walking (Participant 7). FSR measurements indicated notable differences among participants regarding the magnitude of pressure imposed at the test limb ROI by the socket (Supplementary Figure 5b). Mean peak pressure measurements during walking ranged from 53.4 kPa for Participant 1 to 1.0 kPa for Participant 2.
3.3. Load Tolerance Test
The results of the Load Tolerance Test are summarized in Table 2. Participants 5 and 8 indicated increased load tolerance at the test ROI. For Participants 6 and 7, the week 0 photographs could not be assessed due to the continued presence of redness from the Maximum Dilation Test heater earlier in the session. The remaining four participants did not have redness lasting longer than 10 minutes during the week 0 test, therefore their limbs were already considered “tolerant” to the load stimulus.
Table 2.
Load Tolerance Test results.
| Participant # | Week 0 | Week 2 | Increased tolerance? |
|---|---|---|---|
| 1 | < 10 min | < 10 min | No |
| 2 | < 10 min | < 10 min | No |
| 3 | < 10 min | < 10 min | No |
| 4 | < 10 min | < 10 min | No |
| 5 | > 10 min | < 10 min | Yes |
| 6 | n/aa | > 10 min | No |
| 7 | n/aa | > 10 min | No |
| 8 | > 10 min | < 10 min | Yes |
Skin redness could not be assessed due to residual skin redness from Maximum Dilation Test heater earlier in test session.
3.4. Reactive Hyperemia Test
A representative RH Test data set is shown in Figure 5. Following the 10-minute load application of the RH Test, 40 of the 48 tests produced a typical RH response: a rapid increase in perfusion followed by a gradual return toward baseline perfusion. For the 8 tests in which a RH response was not measured, the VAD remained at a low magnitude throughout the response. Six of these tests came from just two ROIs: the control ROIs of Participants 1 and 4. Of the 40 tests where a RH response was measured, the peak of the response appeared to be captured in 12 tests. In the other 28 tests, the first measurement taken after the load removal was the peak VAD of the measured response; therefore, it was unclear whether the peak occurred at or before this point. Thus, for these tests it was unknown whether the physiological time-to-peak was less than the value measured or if the peak VAD was larger than the value measured. Despite this missing information, relationships between the weeks could still be found in many cases when just one of the three test sessions had a captured peak.
Figure 5.
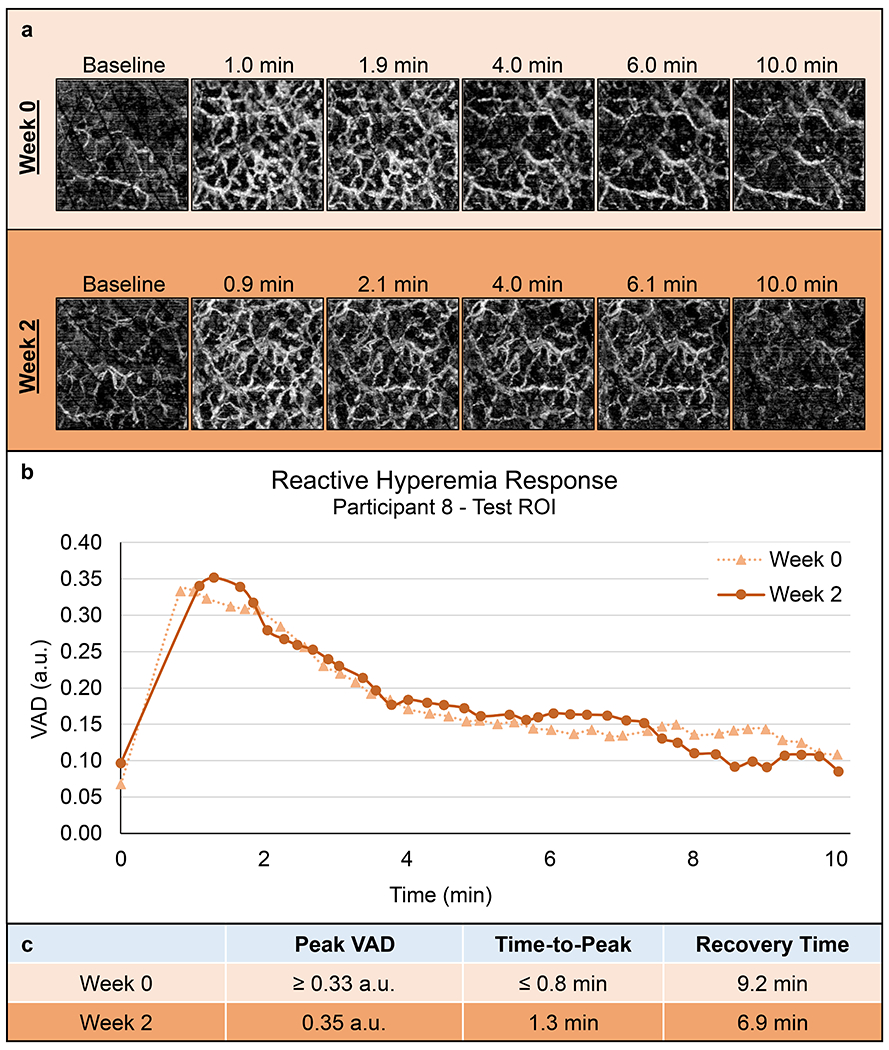
Representative Reactive Hyperemia Test results. Data from Participant 8’s test ROI at week 0 and 2. (a) Select en face images of the RH response (2.0 x 2.0 mm each). (b) VAD vs. time plots. (c) Quantified vascular response characteristics. The peak appears to have been captured in the week 2 response, but not week 0.
RH measurements for all participants are shown in Supplementary Figures 6–8. Various patterns were exhibited in the data, though no clear trends emerged. No statistically significant relationships existed (p>0.05) for any of the RH Test measurements at the test or control ROI when comparing the three weeks.
3.5. Maximum Dilation Test
A representative Maximum Dilation Test data set is shown in Figure 6. Participant 1’s data were not included since these images were collected prior to implementing noise-reducing techniques. Registration of en face vessel images for Participants 2-8 resulted in overlapping ROI regions equivalent to a mean imaging area of 7.0 ± 0.3 mm2, with 6.3 mm2 being the minimum. The mean differences between measurements taken at week 1 versus week 0 and measurements taken at week 2 versus week 0 are shown in Supplementary Figure 9. Some differences were identified between time points; however, these differences appeared small compared to the variability of the measurements, as evidenced by the large standard deviation in these differences. As such, no statistically significant relationships existed (p>0.05) for any of the vessel structure measurements for either layer (papillary or reticular) or either comparison (week 0-to-1 and week 0-to-2).
Figure 6.
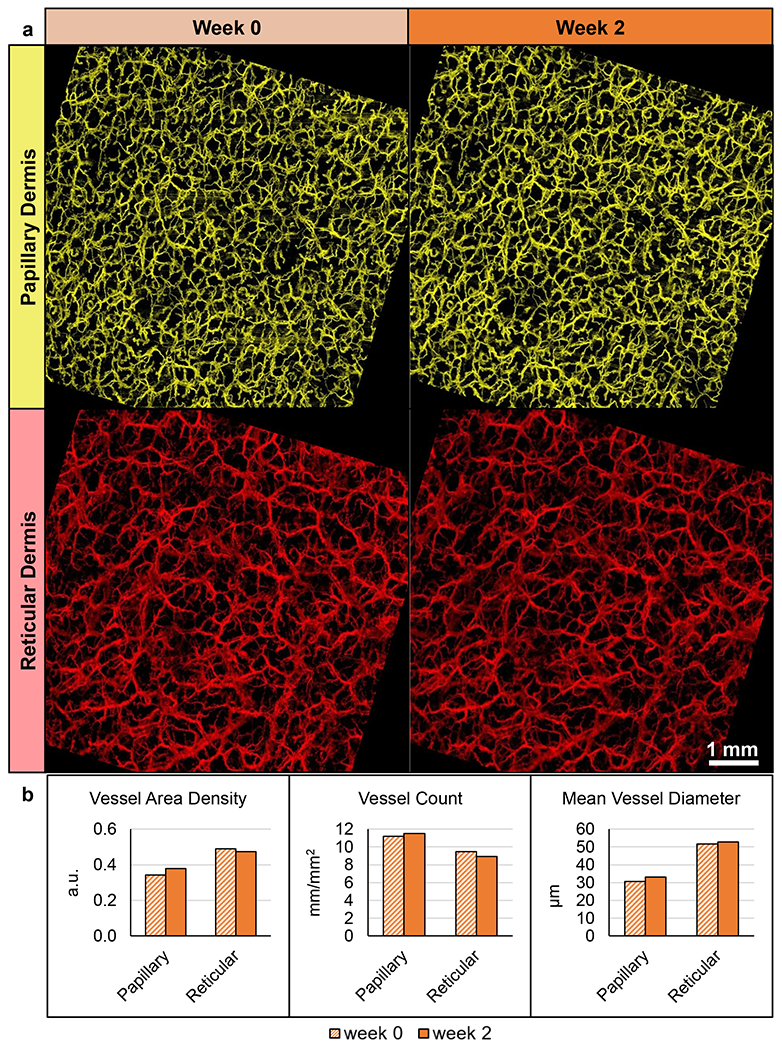
Representative Maximum Dilation Test results. Data from Participant 8’s test ROI. (a) En face images separated by week and depth after vessel registration and removal of non-shared pixels (7.4 x 7.4 mm each). (b) Vessel measurements quantified from the images.
3.6. Epidermal Thickness
Epidermal thickness measurements are summarized in Figure 7 and shown in Supplementary Figure 10. A small increase in epidermal thickness was demonstrated from week 0 to week 1 and again by week 2. A statistically significant two-way interaction was found (p=0.034), however the simple main effects indicated that no statistically significant relationships existed (p>0.05).
Figure 7.
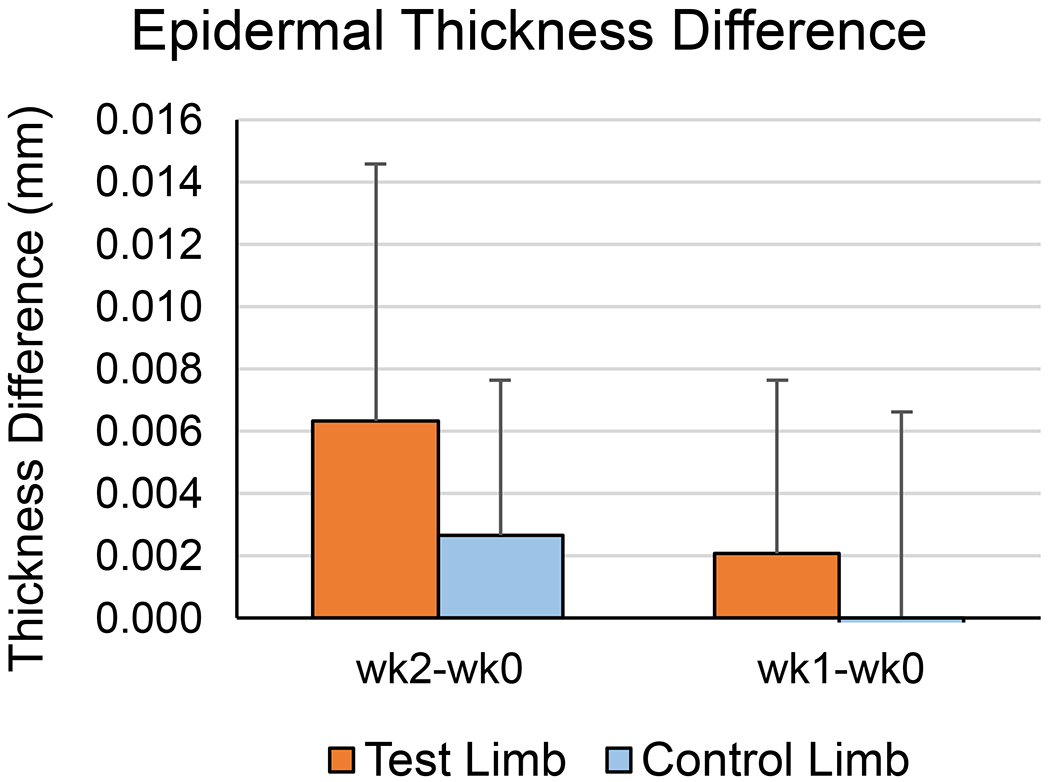
Epidermal Thickness Difference from week 0 to weeks 1 and 2. Shown are the means for all participants. Error bars are one SD.
4. Discussion
In the current study, we demonstrated the use of new noninvasive techniques for investigating skin adaptation in prosthetics. The results emphasized several advantages that OCTA has over other noninvasive techniques currently available for assessing the cutaneous microvasculature. First, no other method can noninvasively provide images of vessels 1 mm deep into skin thereby enabling the assessment of vessel morphologies in vivo. Another key benefit of OCTA is that the same measurement depth can be selected consistently across a study. This is critical since small changes in vessel depth can result in dramatic differences in vessel diameter, vessel count, and overall perfusion. Here, the same vessel depth for each test was maintained throughout the study. By basing these depths on the dermal-epidermal junction rather than the skin’s surface, this ensured that the region analyzed was not altered by differences in epidermal thickness. Similarly, as demonstrated in the Maximum Dilation Test, OCTA image features can be used to ensure the same vessel segments are compared throughout a study. Considering the heterogeneity of the cutaneous microvasculature, even small shifts in measurement locations can impact the results. Here, we registered en face images taken weeks apart and removed areas from analysis if they did not overlap. This precise control of measurement depth and field-of-view is not possible with other cutaneous microvascular measurement methods. Finally, having vessel images also made it possible to identify when measurement errors occurred, thus offering an additional step of data verification which is usually not possible with existing techniques.
To the authors’ knowledge, this is the first study to measure cutaneous reactive hyperemia in response to a controlled stress representative of stresses seen in lower limb prosthetics. The ability of OCTA to measure RH has been previously demonstrated [23], whereby researchers measured RH in response to wearing a prosthetic socket. However, since the RH response is known to be dependent on the magnitude of stress [24] and the researchers could not control the load applied to the skin, features of the RH response could not be compared among individuals or between sessions. By developing a test that used a repeatable cyclic shear and pressure, the current study has introduced a method to enable these comparisons. Despite variations measured during the RH Test, it was encouraging that a smooth, measurable RH response was captured in most tests. And even though a typical RH response was not captured in eight of the tests, based on the presence of skin redness noted immediately following the load removal, it is believed that an RH response was induced but that it resolved by the time imaging began. These results suggest repeatability of the RH Test measurement techniques, though further investigation is needed to verify this.
The lack of a reliable RH peak capture represents a key limitation of the developed tests. These missed peaks resulted in gaps in the data, making it impossible to assess all desired RH Test variables. This issue was caused by the time delay between the load stimulus removal and the first post-load image. This transition was limited by the time it took to remove the loading device, center the imaging location, and adjust the OCT pressure and focus. This delay often lasted longer than it took for participant ROIs to reach the peak of their RH response. In the future these steps could be automated to reduce this delay. It may also be possible to incorporate an OCT probe into the load application device so imaging can begin immediately following load application.
The utility of OCTA for measuring the cutaneous microvasculature in response to a local heating protocol was recently demonstrated for the first time by Smith et al. [25]. The researchers imaged the ventral forearm of participants with OCTA while applying heat with a commercially available skin heating probe. While their study did well to introduce the concept of using OCTA with local heating for exercise physiology research, we believe the methods demonstrated in the current study offer several improvements that may help to advance the technique even further. For one, the researchers did not use a heating medium and therefore did not directly heat the region of skin being imaged. The lack of a heating medium may have also contributed to their decision to heat only to 34°C, rather than the 42–44°C required for maximum dilation. In the current study, by using mineral oil as a heating medium and counteracting the resultant motion-artifacts using the techniques described in the Supporting Information, a reproducible state of maximum dilation was induced. Smith et al. also analyzed vessels in the entire imaging region despite field-of-view translations which are visually apparent in the images being compared. The accuracy of their methods could be improved if a vessel registration method, like that used in the current study, was used to ensure the same vessel regions were compared in each session.
No statistically significant differences were found in the participants’ skin that could be interpreted as biological changes due to the skin adaptation protocol. We believe a key reason for this is that the skin was not stressed enough to induce measurable skin adaptation. This was supported by the Load Tolerance Test data, which suggested that only two participants’ test ROIs adapted into a more load tolerant state throughout the study. Yet even those two participants’ OCT measurements did not demonstrate notable trends that could be indicative of adaptation. While it was a priority of the adaptation protocol to maintain participant safety, the fact that no instances of minor skin damage or irritation were found indicated that perhaps the approach was too conservative. This was further supported by the FSR data which suggested that interface pressures imposed at the test ROI were far below those experienced by the residual limb in a transtibial socket. While FSRs are known to be inaccurate for measuring limb-socket interface pressures [26], the measured walking peak pressures ranged from 1.0 kPa to 53.4 kPa. This is well below the 100-250 kPa commonly seen at high stress regions of the transtibial prosthetic socket [27–29]. It is likely the participants’ limbs could have withstood higher interface stresses, a more aggressive daily wear regimen, or an additional 1-2 weeks of socket wear. Alternatively, future iterations of the able-bodied adaptation model could include a modified method of stress application that is more controlled and more focused at the ROI. This could be accomplished by creating sockets with panels in the socket wall whose radial location can be mechanically controlled to impose a desired loading profile.
There were several confounding factors which may have influenced the results of the Load Tolerance Test. While preliminary tests suggested that the chosen stress stimulus would produce redness that lasted for longer than 10 minutes in some individuals, redness lasted less than 10 minutes during the week 0 test for four of the eight participants. Thus, these participants demonstrated tolerance to the load even before the socket was first worn. In the future, the load stimulus may need to be adjusted to suit the individual if redness greater than 10 minutes during the week 0 test is to be achieved.
Although it was not a focus of the current study, a correlation was observed between participant FSPT and skin redness recovery time during the Load Tolerance Test (Figure 8). A Spearman’s rank-order correlation was run to assess the relationship between FSPT and redness recovery time. After preliminary visual assessment of a scatterplot demonstrated the relationship to be monotonic, there was a statistically significant, strong negative correlation between FSPT and redness recovery time, rs(6)=−0.778, p=0.023. To our knowledge the relationship between FSPT and measured skin reactivity to a mechanical load has not been investigated previously. FSPT has been suggested for use as a factor in assessing risk for hospital-acquired pressure ulcers, though its predictive value has not been thoroughly validated [30]. One possible explanation for the correlation seen in the current study may be that differences in skin complexion could alter the ability of a redness evaluator to notice the differences in color consistently. This difficulty to assess skin discoloration and early skin damage in individuals with darker skin tones has been described previously [31]. As such, it may be that a more direct measurement of cutaneous microvascular reactivity to an imposed mechanical stress would be a better predictor of skin breakdown risk, for example using a method like the RH Test used introduced here. Although the correlation found between skin type and redness duration is interesting, our study was not specifically designed to test this relationship. Further testing is needed to confirm the findings.
Figure 8.
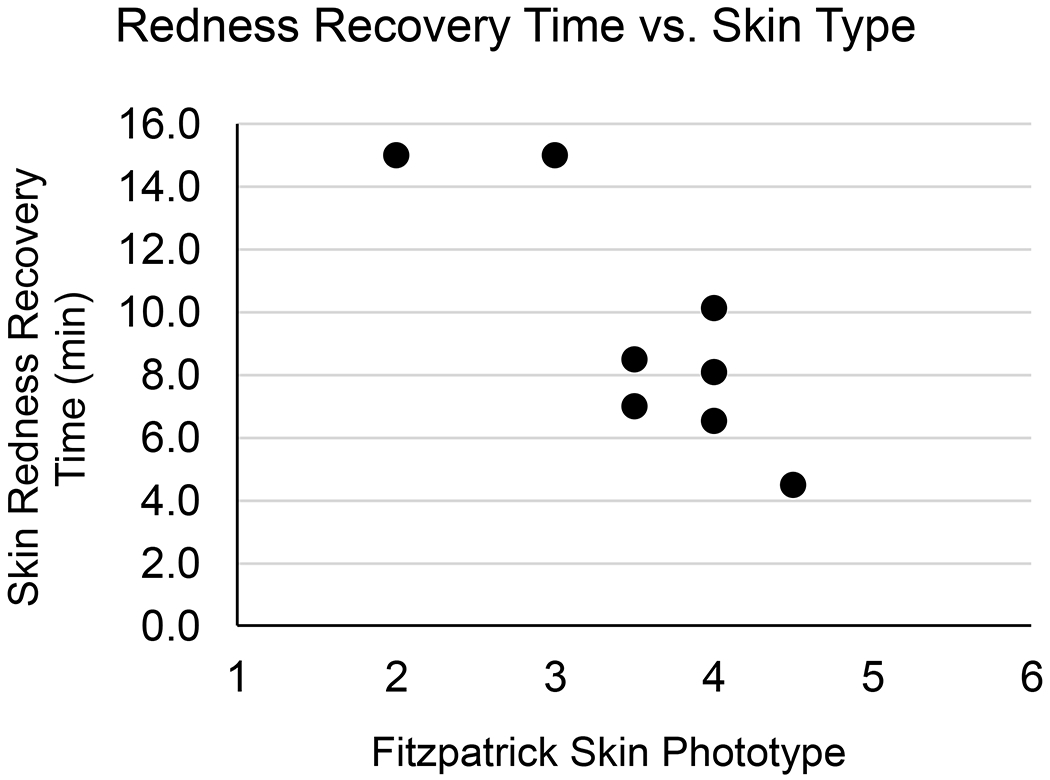
Redness Recovery Time vs. Skin Type. Each data point represents one participant and includes the mean of their Load Tolerance Test skin redness recovery measurements vs. their self-reported FSPT. A statistically significant, strong negative correlation was found between the two variables.
5. Conclusion
This study highlighted the potential of using OCT-based imaging methods for investigating skin adaptation to mechanical stress. With a few improvements, the methods introduced in this study could be used to noninvasively investigate skin health as it relates to lower limb prosthetic users at a level of detail previously not possible. If we can develop a better understanding of the biology of mechanically-induced skin adaptation and introduce noninvasive methods to track its progress, clinicians will have more objective tools for monitoring skin health and reducing the risk of skin breakdown in individuals with lower limb loss. Additionally, it may be possible to use these methods to develop new therapeutics or rehabilitation strategies to promote skin adaptation rather than breakdown. Furthermore, although this work focused on developing methods for the investigation of skin as it relates to adaptation to transtibial socket-limb interface stresses, these methods may have broader applications for researching skin health in other populations at risk for breakdown, such as individuals with spinal cord injury or with diabetic foot ulcers.
Supplementary Material
Supplementary Figure 1. OCT probe setup. (a) Stage 1 moved the entire probe vertically. (b) Stage 2 adjusted the skin contact ring away from the OCT probe. (c) Using both stages together enabled adjustment of skin contact pressure and focal depth independently.
Supplementary Figure 2. OCT image processing flow.
Supplementary Figure 3. OCT image post-processing of en face vessel images. (a) En face image. (b) VAD image (green) created by binarization of en face image. (c) Skeleton image (red) overlaid on en face image (grayscale). (d) Skeleton image.
Supplementary Figure 4. Sample RH curve and key features. Features include peak VAD, analogous to peak blood flow; time-to-peak, the speed of the response; and recovery time, an indicator of how quickly the tissue returns to a near-normal state, defined as a 75% VAD recovery to baseline.
Supplementary Figure 5. (a) Accumulated socket wear times by activity for each participant. (b) FSR-measured pressure at each participant ROI. Shown are the mean peak pressures measured during walking throughout the two-week wear period.
Supplementary Figure 6. RH peak VAD measurements. (a) Test ROI and (b) Control ROI. An “X” indicates that an RH response did not occur. A “≥” indicates that the peak was the first point captured, therefore the physiological peak VAD was greater than or equal to the measured value.
Supplementary Figure 7. RH time-to-peak measurements. (a) Test ROI and (b) Control ROI. An “X” indicates that an RH response did not occur. A “≤” indicates that the peak was the first point captured, therefore the physiological peak was less than or equal to the measured value.
Supplementary Figure 8. RH recovery time measurements. (a) Test ROI and (b) Control ROI. An “X” indicates that an RH response did not occur. A “≥” indicates that a 75% recovery was not achieved by the end of the 10-minute imaging.
Supplementary Figure 9. Maximum Dilation Test measurement mean differences between week 0 and week 1 and between week 0 and week 2. Data are from participants 2-8. Error bars are one SD.
Supplementary Figure 10. Epidermal thickness for all study participants, week 0 and week 2.
Acknowledgements
This research was funded by the National Institutes of Health grant number R01 HD060585. Any opinions, findings and conclusions or recommendations expressed in this material are those of the authors and do not necessarily reflect the views of the National Institutes of Health.
Acronyms:
- a.u.
Arbitrary Units
- ANOVA
Analysis of Variance
- FSPT
Fitzpatrick Skin Phototype
- FSR
Force Sensing Resistor
- OCT
Optical Coherence Tomography
- OCTA
Optical Coherence Tomography Angiography
- RH
Reactive Hyperemia
- ROI
Region of Interest
- VAD
Vessel Area Density
Contributor Information
Eric C. Swanson, Dept of Bioengineering, University of Washington, Seattle, WA.
Janna L. Friedly, Dept of Rehabilitation Medicine, University of Washington, Seattle, WA.
Ruikang K. Wang, Dept of Bioengineering, University of Washington, Seattle, WA.
Joan E. Sanders, Dept of Bioengineering, University of Washington, Box 355061, Seattle, WA 98195.
6. References
- [1].Meulenbelt HE, Geertzen JH, Jonkman MF, Dijkstra PU. Determinants of skin problems of the stump in lower-limb amputees. Arch Phys Med Rehabil 2009;90:74–81. doi: 10.1016/j.apmr.2008.07.015. [DOI] [PubMed] [Google Scholar]
- [2].Sanders JE, Daly CH, Burgess EM. Interface shear stresses during ambulation with a below-knee prosthetic limb. J Rehabil Res Dev 1992;29:1–8. [DOI] [PMC free article] [PubMed] [Google Scholar]
- [3].Oomens CWJ, Bader DL, Loerakker S, Baaijens F. Pressure Induced Deep Tissue Injury Explained. Ann Biomed Eng 2014;43:297–305. doi: 10.1007/s10439-014-1202-6. [DOI] [PubMed] [Google Scholar]
- [4].Peirce SM, Skalak TC, Rodeheaver GT. Ischemia-reperfusion injury in chronic pressure ulcer formation: A skin model in the rat. Wound Repair Regen 2000;8:68–76. doi: 10.1046/j.1524-475X.2000.00068.x. [DOI] [PubMed] [Google Scholar]
- [5].Thorfinn J, Sjoberg F, Lidman D. Perfusion of buttock skin in healthy volunteers after long and short repetitive loading evaluated by laser Doppler perfusion imager. Scand J Plast Reconstr Surg Hand Surg 2007;41:297–302. doi:Doi 10.1080/02844310701633249. [DOI] [PubMed] [Google Scholar]
- [6].Mueller MJ, Maluf KS. Tissue adaptation to physical stress: a proposed “Physical Stress Theory” to guide physical therapist practice, education, and research. Phys Ther 2002;82:383–403. [PubMed] [Google Scholar]
- [7].Tomlins PH, Wang RK. Theory, developments and applications of optical coherence tomography. Appl Phys 2005;38:2519–35. [Google Scholar]
- [8].Deegan AJ, Wang W, Men S, Li Y, Song S, Xu J, et al. Optical coherence tomography angiography monitors human cutaneous wound healing over time. Quant Imaging Med Surg 2018;8:135–50. doi: 10.21037/qims.2018.02.07. [DOI] [PMC free article] [PubMed] [Google Scholar]
- [9].Deegan AJ, Talebi-Liasi F, Song S, Li Y, Xu J, Men S, et al. Optical coherence tomography angiography of normal skin and inflammatory dermatologic conditions. Lasers Surg Med 2018;50:183–93. doi: 10.1002/lsm.22788. [DOI] [PMC free article] [PubMed] [Google Scholar]
- [10].Chen CL, Wang RK. Optical coherence tomography based angiography. Biomed Opt Express 2017;8:1056–82. doi: 10.1364/BOE.8.001056. [DOI] [PMC free article] [PubMed] [Google Scholar]
- [11].An L, Qin J, Wang RK. Ultrahigh sensitive optical microangiography for in vivo imaging of microcirculations within human skin tissue beds. Opt Express 2010;18:8220–8. doi: 10.1364/OE.18.008220. [DOI] [PMC free article] [PubMed] [Google Scholar]
- [12].Deegan AJ, Wang RK. Microvascular imaging of the skin. Phys Med Biol 2019;64. doi: 10.1088/1361-6560/ab03f1. [DOI] [PMC free article] [PubMed] [Google Scholar]
- [13].Choi WJ, Reif R, Yousefi S, Wang RK. Improved microcirculation imaging of human skin in vivo using optical microangiography with a correlation mapping mask. J Biomed Opt 2014;19:036010. doi: 10.1117/1.JBO.19.3.036010. [DOI] [PMC free article] [PubMed] [Google Scholar]
- [14].Goossens RH, Zegers R, Hoek van Dijke GA, Snijders CJ. Influence of shear on skin oxygen tension. Clin Physiol 1994;14:111–8. doi: 10.1111/j.1475-097X.1994.tb00495.x. [DOI] [PubMed] [Google Scholar]
- [15].Holloway G, Daly C, Kennedy D, Chimoskey J. Effects of external pressure loading on human skin blood flow measured by 133Xe clearance. J Appl Physiol 1976;40:597–600. doi: 10.1166/jnn.2012.6247. [DOI] [PubMed] [Google Scholar]
- [16].Roustit M, Cracowski JL. Non-invasive assessment of skin microvascular function in humans: an insight into methods. Microcirculation 2012;19:47–64. doi: 10.1111/j.1549-8719.2011.00129.x. [DOI] [PubMed] [Google Scholar]
- [17].Johnson JM, Kellogg DL. Local thermal control of the human cutaneous circulation. J Appl Physiol 2010;109:1229–38. doi: 10.1152/japplphysiol.00407.2010. [DOI] [PMC free article] [PubMed] [Google Scholar]
- [18].He SY, McCulloch CE, Boscardin WJ, Chren MM, Linos E, Arron ST. Self-reported pigmentary phenotypes and race are significant but incomplete predictors of Fitzpatrick skin phototype in an ethnically diverse population. J Am Acad Dermatol 2014;71:731–7. doi: 10.1016/j.jaad.2014.05.023. [DOI] [PMC free article] [PubMed] [Google Scholar]
- [19].Fitzpatrick TB. The Validity and Practicality of Sun reactive skin types I and IV. Arch Dermatol 1988;124:869–71. [DOI] [PubMed] [Google Scholar]
- [21].Department of Veterans Affairs, Department of Defense. VA/DoD Clinical Practice Guideline for Rehabilitation of Lower Limb Amputation. 2008.
- [22].Lusardi MM, Nielsen CC. Orthotics and Prosthetics in Rehabilitation. 2nd ed. St. Louis, MO: Saunders Elsevier; 2007. [Google Scholar]
- [23].Baran U, Swanson E, Sanders JE, Wang RK. OCT-based microangiography for reactive hyperaemia assessment within residual limb skin of people with lower limb loss. Ski Res Technol 2018;24:152–5. doi: 10.1111/srt.12383. [DOI] [PMC free article] [PubMed] [Google Scholar]
- [24].Mayrovitz HN, Macdonald J, Smith JR. Blood perfusion hyperaemia in response to graded loading of human heels assessed by laser-Doppler imaging. Clin Physiol 1999;19:351–9. doi: 10.1046/j.1365-2281.1999.00184.x. [DOI] [PubMed] [Google Scholar]
- [25].Smith KJ, Argarini R, Carter HH, Quirk BC, Haynes A, Naylor LH, et al. Novel Noninvasive Assessment of Microvascular Structure and Function in Humans. Med Sci Sports Exerc 2019;51:1558–65. doi: 10.1249/MSS.0000000000001898. [DOI] [PubMed] [Google Scholar]
- [26].Swanson E, Weathersby E, Cagle J, Sanders JE. Evaluation of Force Sensing Resistors for the Measurement of Interface Pressures in Lower Limb Prosthetics. J Biomech Eng 2019;141:101009-1–101009–13. doi: 10.1115/1.4043561. [DOI] [PMC free article] [PubMed] [Google Scholar]
- [27].Sanders JE, Daly CH, Burgess EM. Clinical measurement of normal and shear stresses on a trans-tibial stump: characteristics of wave-form shapes during walking. Prosthet Orthot Int 1993;17:38–48. [DOI] [PubMed] [Google Scholar]
- [28].Sanders JE, Jacobsen AK, Fergason JR. Effects of fluid insert volume changes on socket pressures and shear stresses: case studies from two trans-tibial amputee subjects. Prosthet Orthot Int 2006;30:257–69. doi: 10.1080/03093640600810266. [DOI] [PubMed] [Google Scholar]
- [29].Sanders JE, Zachariah SG, Jacobsen AK, Fergason JR. Changes in interface pressures and shear stresses over time on trans-tibial amputee subjects ambulating with prosthetic limbs: comparison of diurnal and six-month differences. J Biomech 2005;38:1566–73. doi: 10.1016/j.jbiomech.2004.08.008. [DOI] [PubMed] [Google Scholar]
- [30].Lindgren M, Unosson M, Krantz A- M, Ek A- C. A risk assessment scale for the prediction of pressure sore development : reliability and validity. J Adv Nurs 2002;38:190–9. [DOI] [PubMed] [Google Scholar]
- [31].Gunowa NO, Hutchinson M, Brooke J, Jackson D. Pressure injuries in people with darker skin tones: A literature review. J Clin Nurs 2018;27:3266–75. doi: 10.1111/jocn.14062. [DOI] [PubMed] [Google Scholar]
Associated Data
This section collects any data citations, data availability statements, or supplementary materials included in this article.
Supplementary Materials
Supplementary Figure 1. OCT probe setup. (a) Stage 1 moved the entire probe vertically. (b) Stage 2 adjusted the skin contact ring away from the OCT probe. (c) Using both stages together enabled adjustment of skin contact pressure and focal depth independently.
Supplementary Figure 2. OCT image processing flow.
Supplementary Figure 3. OCT image post-processing of en face vessel images. (a) En face image. (b) VAD image (green) created by binarization of en face image. (c) Skeleton image (red) overlaid on en face image (grayscale). (d) Skeleton image.
Supplementary Figure 4. Sample RH curve and key features. Features include peak VAD, analogous to peak blood flow; time-to-peak, the speed of the response; and recovery time, an indicator of how quickly the tissue returns to a near-normal state, defined as a 75% VAD recovery to baseline.
Supplementary Figure 5. (a) Accumulated socket wear times by activity for each participant. (b) FSR-measured pressure at each participant ROI. Shown are the mean peak pressures measured during walking throughout the two-week wear period.
Supplementary Figure 6. RH peak VAD measurements. (a) Test ROI and (b) Control ROI. An “X” indicates that an RH response did not occur. A “≥” indicates that the peak was the first point captured, therefore the physiological peak VAD was greater than or equal to the measured value.
Supplementary Figure 7. RH time-to-peak measurements. (a) Test ROI and (b) Control ROI. An “X” indicates that an RH response did not occur. A “≤” indicates that the peak was the first point captured, therefore the physiological peak was less than or equal to the measured value.
Supplementary Figure 8. RH recovery time measurements. (a) Test ROI and (b) Control ROI. An “X” indicates that an RH response did not occur. A “≥” indicates that a 75% recovery was not achieved by the end of the 10-minute imaging.
Supplementary Figure 9. Maximum Dilation Test measurement mean differences between week 0 and week 1 and between week 0 and week 2. Data are from participants 2-8. Error bars are one SD.
Supplementary Figure 10. Epidermal thickness for all study participants, week 0 and week 2.