Abstract
The coevolution of mammalian hosts and their beneficial commensal microbes has led to development of a symbiotic host-microbiota relationship1. Epigenetic machinery permits mammalian cells to integrate environmental signals2, however, how these pathways are finely tuned by diverse cues from commensal bacteria is not well understood. Here, we reveal a highly selective pathway through which microbiota-derived inositol phosphate regulates histone deacetylase 3 (HDAC3) activity in the intestine. Despite abundant HDAC inhibitors in the intestine such as butyrate, we unexpectedly found that HDAC3 activity was sharply increased in intestinal epithelial cells (IECs) of microbiota-replete mice compared to germ-free mice. This discordance was reconciled by finding that commensal bacteria, including E. coli, stimulated HDAC activity through metabolism of phytate and inositol trisphosphate production. Intestinal exposure to inositol trisphosphate and phytate ingestion both promoted recovery following intestinal damage. Remarkably, inositol trisphosphate also induced growth of patient-derived intestinal organoids, stimulated HDAC3-dependent proliferation, and countered butyrate inhibition of colonic growth. Collectively, these data reveal inositol trisphosphate as a microbiota-derived metabolite that activates a mammalian histone deacetylase to promote epithelial repair. Thus, HDAC3 represents a converging epigenetic sensor of distinct metabolites that calibrates host responses to diverse microbial signals.
IECs reside at the direct interface between the microbiota and host and form a critical barrier that undergoes regular replenishment during health and following damage3. Multiple epigenetic mechanisms are involved in maintaining IEC differentiation4–6 and IEC expression of HDACs is necessary for intestinal homeostasis7,8. The microbiota-derived short chain fatty acid butyrate inhibits HDAC activity in vitro and, as expected, IECs harvested from butyrate-treated intestinal tissue demonstrated decreased HDAC activity (Extended Data Fig. 1a). Further, colonization of germ-free (GF) mice with butyrate-producing bacteria, Faecalibacterium prausnitzii, inhibited IEC-intrinsic HDAC activity (Extended Data Fig. 1b, c). These data suggest that HDAC activity in conventionally-housed (CNV) mice harboring a complete microbiota would be decreased due to butyrate-induced inhibition. Surprisingly, IECs from CNV mice instead exhibited significantly increased HDAC activity relative to IECs from GF mice (Fig. 1a). Therefore, the relationship between the microbiota and HDAC activity in IECs reflects more complex regulation than can be accounted for by butyrate-directed inhibition alone.
Figure 1. Microbiota calibrate epithelial HDAC3 activity by regulating inositol phosphate.
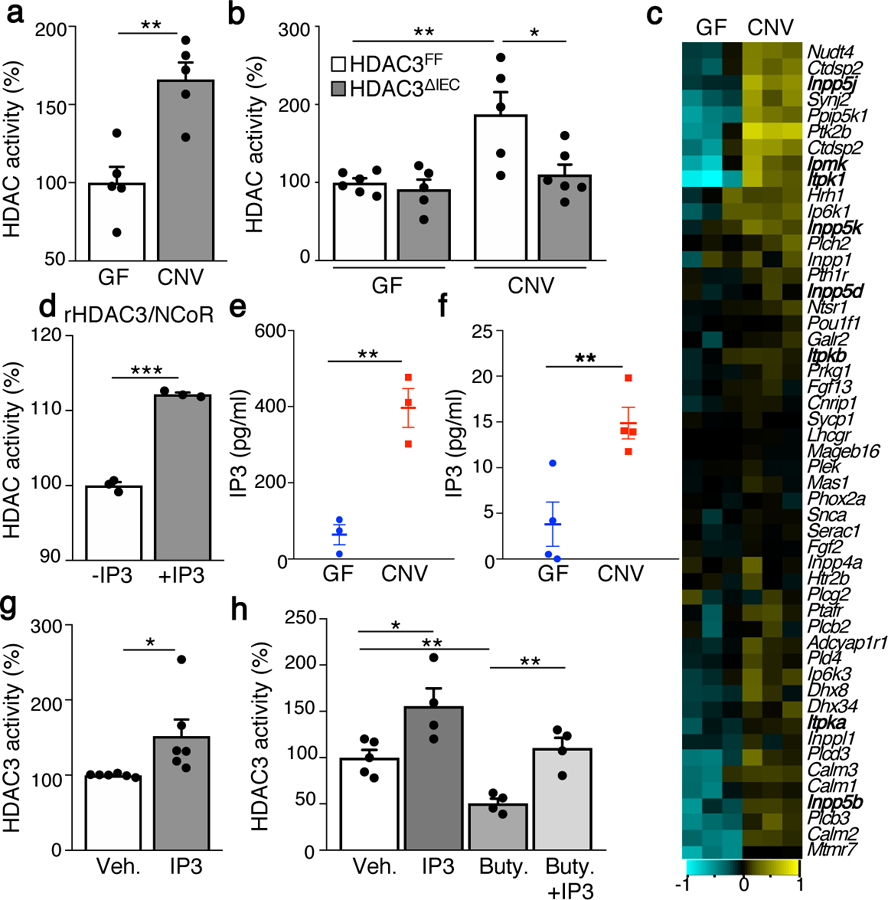
(a) Intestinal epithelial HDAC activity of germ-free (GF) (n=5) and conventionally-housed (CNV) (n=5) mice. Values are relative to GF. **p=0.0021. (b) HDAC activity in IECs from GF-HDAC3FF (n=6), GF-HDAC3∆IEC (n=5), CNV-HDAC3FF(n=5) and CNV-HDAC3∆IEC (n=6) mice. **p=0.0089, *p=0.0271. (c) Hierarchical clustering of expression (log2-transformed transcripts per million) of all genes within inositol phosphate metabolism KEGG pathway in large intestinal IECs from GF (n=3) and CNV (n=3) mice. (d) HDAC activity of recombinant HDAC3-NCoR-deacetylase activation domain protein −/+1μM IP3 (n=3/treatment). ***p=2E-05. (e, f) Relative IP3 levels by competitive ELISA in (e) fecal homogenate (n=3/group; **p=0.004) and (f) IEC lysate (n=4/group; **p=0.0098). (g) HDAC activity of immunoprecipitated HDAC3 from primary IECs incubated with vehicle (n=6) or 1μM IP3 (n=6). *p=0.038. (h) HDAC activity of immunoprecipitated HDAC3 incubated with vehicle (n=5), 1μM IP3 (n=4), 100μM butyrate (n=4), or 100μM butyrate + 1μM IP3 (n=4). *p=0.0239 (Veh. vs IP3), **p=0.0023 (Veh. vs Buty.) **p=0.0027 (Buty. vs Buty.+IP3). Bars in all graphs are mean of biologic replicates ± s.e.m.; unpaired two-tailed t test. Data in a, b, d-h were independently repeated three times with similar results. *p ≤ 0.05, **p ≤ 0.01, ***p ≤ 0.001.
The class I HDAC, HDAC3, can mediate microbiota-sensitive intestinal physiology7,9. Using HDAC3 purified from IECs (Extended Data Fig. 1d), we confirmed that expression of HDAC3 was accompanied by potent enzymatic activity in IECs from control (HDAC3FF), but not IEC-intrinsic HDAC3 knockout mice (HDAC3∆IEC) (Extended Data Fig. 1e). Given that HDAC assays quantify activity of multiple HDACs, we tested whether HDAC3 specifically mediates microbiota-sensitive induction. Commensal bacteria induced HDAC activity in IECs of CNV-HDAC3FF mice relative to GF mice (Fig. 1b). However, this microbiota-dependent induction was lost in CNV-HDAC3∆IEC mice, whereas HDAC3 was dispensable for activity in IECs lacking signals from microbiota (Fig. 1b). HDAC1 and HDAC2 are expressed in IECs, however HDAC1/2 do not compensate for loss of HDAC3 in IECs (Fig. 1b). Further, the broad HDAC inhibitor, trichostatin A, inhibited HDAC activity in IECs from GF and HDAC3∆IEC mice (Extended Data Fig. 1f), demonstrating other HDACs remain active when microbiota and HDAC3 are depleted. Taken together, these data indicate that microbiota promote epithelial HDAC3 enzymatic activity during normal intestinal homeostasis.
While butyrate decreased HDAC activity in colonic epithelial organoids (Extended Data Fig. 2a), bacterial stimuli LPS, flagellin, and Pam3csk4, did not significantly affect activity (Extended Data Fig. 2a) or expression (Extended Data Figure 2b–e). Further, HDAC activity in IECs from mice lacking toll-like receptor 4 expression in IECs (TLR4ΔIEC) and myeloid differentiation primary response 88 knockout (Myd88−/−) mice (Extended Data Fig. 2f, g) was similar to IECs from controls. Therefore, canonical bacterial sensing pathways are not essential in mediating HDAC3 activation by the microbiota in IECs. Thus, to decipher potential mechanisms enabling microbiota to activate HDAC3, global transcriptional profiles of IECs isolated from the colon of GF and CNV mice were compared. Unexpectedly, pathway analyses demonstrated that microbiota-exposed IECs exhibited induction of genes associated with inositol phosphate metabolism (Fig. 1c, Extended Data Fig. 3a–c), with several genes predicted to be transcribed in the presence of elevated inositol trisphosphate (IP3)10,11. Direct interaction between HDAC3 and the proteins NCoR/SMRT is critical for HDAC3’s deacetylase activity12–14. Interestingly, structural analyses have supported that inositol phosphates increase HDAC3’s activity by strengthening its interaction with these activating proteins15. Consistent with this, IP3 increased the enzymatic activity of recombinant HDAC3-NCoR protein (Fig. 1d). In addition, basal activity of HDAC1 and HDAC2 was lower than HDAC3-NCoR (Extended Data Fig. 3d), and IP3 specifically increased activity of recombinant HDAC3-NCoR (Extended Data Fig. 3e).
To test whether commensal bacteria modulate IP3 in the intestine, IP3 levels in samples from CNV and GF mice were compared. CNV mice exhibited significantly higher IP3 in both the intestinal lumen (Fig. 1e) and colonic IECs (Fig. 1f), supporting that microbiota promote increased IP3. To assess the effect of IP3 on epithelial HDAC3 activity, HDAC3 was purified by immunoprecipitation from IECs and incubated with IP3. IP3 increased endogenous HDAC3 activity (Fig. 1g), supporting that IP3 directly activates HDAC3 in IECs. Dose response analyses demonstrated that HDAC3 from primary IECs was activated at concentrations as low as 10–100nM IP3 (Extended Data Fig. 3f), suggesting enhanced sensitivity of endogenous HDAC3 relative to the more modest induction observed with in vitro generated HDAC3 (Fig. 1d). Further, extracellular IP3 induced HDAC activity in intestinal organoids (Extended Data Fig. 4a–c). On the other hand, IEC-purified HDAC3 activity was inhibited by butyrate, while butyrate-mediated inhibition was countered by IP3 (Fig. 1h). Thus, locally-generated IP3 and butyrate trigger antagonizing regulation of IEC-intrinsic HDAC3. While in vitro analyses support the structural prediction that IP3 functions, in part, by directly activating the HDAC3-corepressor complex (Fig 1d, g), mechanisms underlying these complex dynamics in IECs remain to be completely elucidated. Further, potential contributions of additional signals, such as calcium10, in regulation of HDAC3 in vivo cannot be excluded.
H3K9Ac represents an established target for HDAC3 at directly repressed genes16,17 and microbiota colonization decreased H3K9Ac at a substantial proportion of sites in IECs (Fig. 2a, Extended Data Fig. 5a), highlighting microbiota limit histone acetylation. Although this finding is consistent ChIP-seq studies18, it differs from earlier mass spectrometry analyses comparing whole intestine19. This discrepancy may reflect cell type or approach as HDAC inhibitors were used during histone extraction for mass spectrometry19. Phytate (inositol hexakisphosphate) is a form of phosphate storage in the diet that is enriched in nuts, beans, and grains20. Commensal bacteria, such as E. coli, produce enzymes that degrade phytate, simultaneously releasing phosphorus and lower inositol phosphates21,22. Interestingly, IECs from mice colonized only with E. coli demonstrated an even larger proportion of sites characterized by less histone acetylation (Fig. 2a, Extended Data Fig. 5a) and decreased H3K9Ac at targets regulated by HDAC3 in IECs7,18,23 (Extended Data Fig. 5b). In contrast to butyrate-producing bacteria (Extended Data Fig. 1b), mono-association of GF mice with commensal E. coli was sufficient to induce HDAC enymatic activty in IECs (Fig. 2b). In addition, lower IP3 was quantified when comparing phytase-deficient E. coli to wildtype E. coli grown in vitro (Extended Data Fig. 5c) and incubation of E. coli with phytate in culture resulted in elevated IP3 (Fig. 2c). Taken together, these data demonstrate bacterial-intrinsic phytate metabolism and provoke the hypothesis that breakdown of phytate by microbiota promotes intestinal HDAC activity.
Figure 2. Phytate metabolism by commensal bacteria induces HDAC activity in IECs.
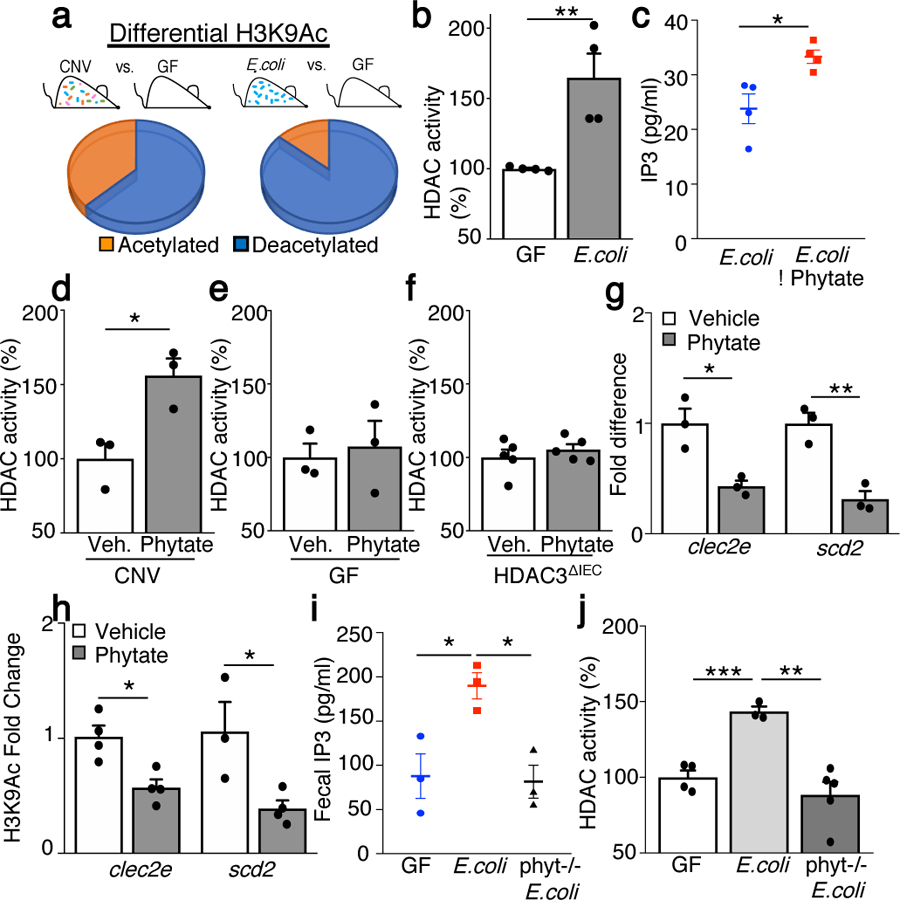
(a) Percentage of sites by ChIP-sequencing with differential histone 3 lysine 9 acetylation (H3K9Ac) [acetylated: increased H3K9Ac; deacetylated: decreased H3K9Ac] in IECs from CNV (n=2) or E. coli mono-associated (n=2) vs. GF mice (n=2). (b) IEC-HDAC activity of GF (n=4) and E. coli mice (n=4). **p=0.009. (c) IP3 measured by ELISA in E. coli in vitro culture (−/+ 1mM phytate) (n=4/group). *p=0.019. (d, e, f) HDAC activity in IECs from large intestine explant from (d) CNV (n=3/treatment), *p= 0.022, (e) GF (n=3/treatment), or (f) HDAC3ΔIEC (n=5/treatment) mice (−/+ 1mM phytate). (g, h) (g) mRNA expression (n=3/group); *p= 0.016 (clec2e), **p=0.005 (scd2) and (h) H3K9Ac ChIP-qPCR at clec2e (vehicle (n=4), phytate (n=4); *p=0.011 and scd2 (vehicle (n=3), phytate (n=4); *p=0.033) in IECs following 2% phytate. (i) Fecal homogenate IP3 for mice mono-associated with wildtype (n=3) or phytase−/− (n=3) E. coli relative to GF (n=3) mice (1mg stool/μl). *p=0.025 (GF vs WT) *p=0.011 (WT vs phytase−/−). (j) HDAC activity in IECs from phytate-treated mice with wildtype (n=3) or phytase−/− (n=5) E. coli relative to GF (n=4). ***p= 0.0008, **p=0.0031. All graphs are mean of biologic replicates ± s.e.m.; unpaired two-tailed t test. Data were independently repeated three (b-e) or two (f-j) times with similar results. *p ≤ 0.05, **p ≤ 0.01, ***p ≤ 0.001.
Interestingly, administration of phytate to microbiota-replete intestinal tissue increased HDAC activity in IECs (Fig. 2d). In contrast, sterile intestinal tissue from GF mice (Fig. 2e) and IECs lacking HDAC3 (Fig. 2f) did not exhibit altered HDAC activity with phytate, demonstrating a requirement for microbiota and HDAC3 in phytate-dependent regulation. Consistent with inositol phosphate-dependent HDAC activity, phytate administration decreased expression (Fig. 2g) and H3K9Ac (Fig. 2h) of microbiota-sensitive HDAC3 targets in primary IECs. Collectively, these data support that commensal bacteria promote HDAC3 function in IECs through phytate metabolism. Similar to IP3, phytase-digested phytate induced HDAC activity in IECs of colonic organoids (Extended Data Fig. 5d, e). Although less potent than IP3, IP4 also increased HDAC activity in IECs (Extended Data Fig. 5f), suggesting that other inositol phosphates simultaneously generated by phytate metabolism may provide synergistic effects. Further, inhibition of hemichannel-mediated diffusion24 in colonoids decreased epithelial IP3 (Extended Data Fig. 5g), indicating extracellular IP3 may enter colonic epithelium in part via hemichannels.
To test whether bacterial phytase-dependent metabolism regulates mammalian epithelial HDAC activity in vivo, mice mono-associated with wildtype and phytase-deficient E. coli were compared (Extended Data Fig. 5h–j). Mice colonized with phytase-proficient E. coli exhibited increased IP3 relative to GF mice and mice with phytase-deficient E. coli (Fig. 2i), demonstrating phytase-expressing bacteria increase intestinal IP3 in vivo. Further, IECs from mice colonized with phytase-proficient E. coli exhibited increased HDAC activity (Fig. 2j), whereas this did not occur with phytase-deficient E. coli (Fig. 2j). These data provide in vivo evidence linking commensal bacterial phytase expression, inositol phosphate metabolism, and epithelial HDAC activity in the intestine.
GF mice and HDAC3ΔIEC mice are highly susceptible to dextran sodium sulfate (DSS)-induced intestinal disease due to loss of signals from microbiota7,25,26. To test whether IP3 in the intestine alters DSS-induced disease, IP3 was administered locally via rectal enema to GF mice prior to and during DSS (Fig. 3a). As expected, GF mice receiving vehicle enemas exhibited early death (Fig. 3b). Interestingly, direct IP3 administration to the colon of GF mice extended survival 1–2 days longer (Fig. 3b), supporting that IP3 improves recovery from disease. Although significant, this IP3-induced survival extension of GF mice was relatively small, which likely reflects the unique sensitivity of GF mice to DSS. Therefore, to test a less susceptible model, the same experiments were performed in antibiotic-treated, microbiota-depleted mice. Interestingly, IP3 was sufficient to improve survival of antibiotic-treated mice relative to controls (Extended Data Fig. 6a). These data confirm that local intestinal exposure to IP3 improves recovery from DSS in the absence/loss of microbiota signals.
Figure 3. Microbiota-dependent breakdown of phytate improves recovery from intestinal damage.
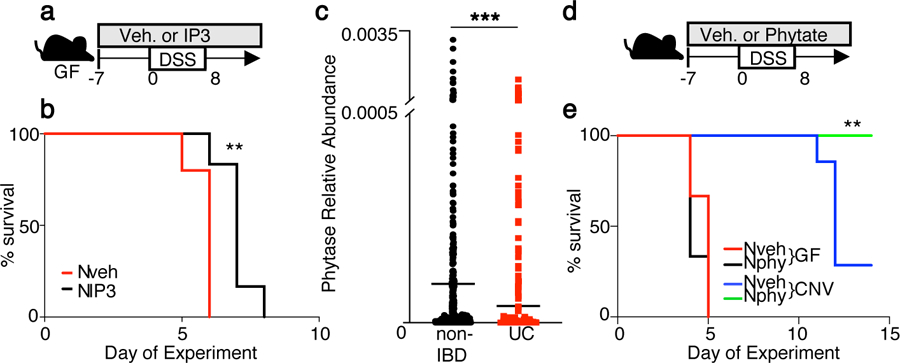
(a) Experimental approach. (b) Percent survival of GF mice on 2.5% DSS while receiving water (n= 5) or 10μM IP3 (n=6) via enema as in (a). **p=0.0078 Mantel-Cox test; independently repeated two times. (c) Abundance of bacterial phytase (E.C.3.1.3.26) DNA sequence in non-IBD (n=429) and ulcerative colitis (UC) (n=459) stool samples from Human Microbiome Project27. ***p=0.0006; unpaired two-tailed t test. (d) Experimental approach. (e) Percent survival of GF (n= 3/treatment) and CNV (n=7/treatment) mice treated with vehicle or 2% phytate during DSS as in (d). **p=0.0078 (CNV vehicle vs phytate) Mantel-Cox test; independently repeated three times. **p ≤ 0.01, ***p ≤ 0.001.
DSS-colitis in mice most closely parallels pathology that is observed in patients with ulcerative colitis (UC), a common form of inflammatory bowel disease (IBD). Therefore, shotgun sequencing from the Integrative Human Microbiome Project cohort27 was examined to compare phytase in samples obtained from healthy (429 non-IBD) and UC patients (459 UC). Interestingly, phytase abundance was significantly decreased in intestinal contents of UC patients compared to non-IBD patients (Fig. 3c), including when longitudinal samples were removed and only the most recent samples were compared (Extended Data Fig. 6b). This is consistent with prior work in which a negative correlation was reported for inositol phosphate metabolism and ulceration28 and global analyses that associate microbial phytase and IBD27,29. Thus, decreased phytate metabolism by microbiota may contribute to epithelial damage or impaired repair in IBD. To test the in vivo relationship between phytate and microbiota, GF and CNV mice were compared following DSS in the presence of increased phytate (Fig. 3d). Phytate did not impact survival of DSS-exposed GF mice (Fig. 3e). In contrast, phytate-treated CNV mice exhibited improved survival compared to vehicle-treated CNV mice following DSS-induced disease (Fig. 3e), indicating an in vivo requirement of microbiota in phytate-dependent recovery following intestinal damage.
After DSS removal, phytate-treated mice exhibited substantial improvement in disease severity (Fig. 4a), weight loss (Fig. 4b) and colonic shortening (Fig. 4c) compared to control mice. This phenotype did not reflect significant alterations in the composition of the microbiota (Extended Data Fig. 7a, b) or levels of SCFAs (Extended Data Fig. 7c). Decreased infiltration of CD45+ cells (Extended Data Fig. 8a) and pro-inflammatory CD4+ T cells (Extended Data Fig. 8b, c) along with decreased levels of lipocalin, a marker of intestinal inflammation, were observed in phytate-treated mice (Extended Data Fig. 8d). While intestine of control mice contained extensive ulceration, loss of crypts, edema, and inflammation (Fig. 4d, e, Extended Data Fig. 8e), the same tissue from phytate-treated mice exhibited improved pathology characterized by intact epithelium and crypt proliferation (Fig. 4d, e, Extended Data Fig. 8e), consistent with epithelial regeneration. Renewal of intestinal tissue is supported by intestinal epithelial stem cells (IESCs). Interestingly, EpCAM+ IECs harvested from phytate-treated mice exhibited an elevated frequency of CD44+ IESCs (Fig. 4f). Further, IESCs harvested from mice that received phytate demonstrated higher Ki67 relative to vehicle-treated mice (Fig. 4g), highlighting increased proliferation of these progenitor cells. Collectively, these data indicate that phytate enables improved recovery following intestinal damage by promoting epithelial proliferation and repair.
Figure 4. Inositol phosphate promotes HDAC3-dependent colonic growth.
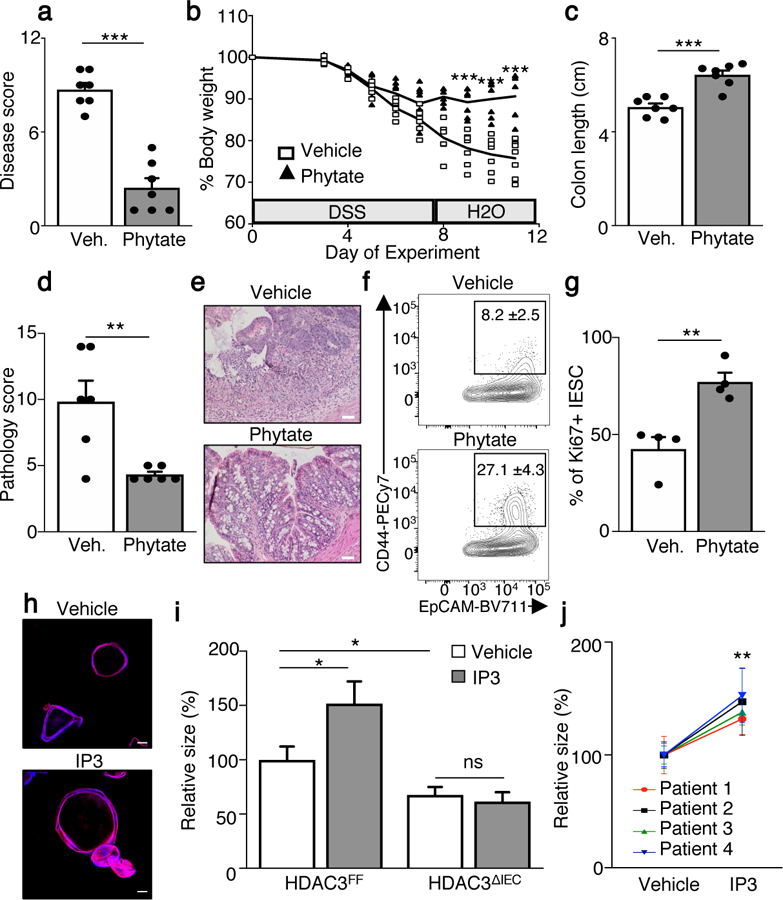
(a) Disease score of vehicle (n=7) or phytate (n=7) treated mice day 4 after DSS removal. ***p=2.1E-06. (b) Body weight percentage of DSS mice treated. n=7/group. ***p=1.08E-04 (day 9), ***p=9.05E-05 (day 10), ***p=1.05E-04 (day 11). (c) Colon length on day 4 after DSS removal. n=7/group. ***p=9.6E-05. (d) Pathology score. n=6/group. **p=0.007. (e) H&E stained large intestine, scale bars, 50 µm. (f) CD44+ intestinal epithelial stem cell (IESC), gated on CD45−, EpCAM+, CD24low. n=4/treatment. **p=0.009. (g) Percentage of Ki67+ IESCs. IESCs are CD45−, EpCAM+, CD24med/lo, CD166−, and CD44hi. n=4/treatment. **p=0.0042. For gating, see Supplementary Fig. 2. Graphs (a-g) are mean of biologic replicates ± s.e.m.; unpaired two-tailed t test. Animal studies were independently repeated four (a-c) or three (d-g) times with similar results. (h) Confocal of organoids grown from colonic crypts (colonoids) of GF mice treated with vehicle or 10nM IP3 (red: phalloidin, blue: DAPI), scale bars, 100 µm. (i) Growth of colonoids from control (HDAC3FF) or HDAC3ΔIEC mice (−/+ 10nM IP3). n=50 colonoids/treatment for each genotype. Data are relative to vehicle-treated HDAC3FF. *p=0.0335 (HDAC3FF Vehicle vs IP3), *p=0.0249 (HDAC3FF vs HDAC3∆IEC); unpaired two-tailed t test. Murine colonoid studies (h, i) were independently repeated three times. (j) Growth of human colonoids derived from 4 different patients and treated with vehicle or 10μM IP3. Data are relative to vehicle colonoids from the same patient. n=30 colonoids/treatment for each patient. **p= 0.0012; 2-way ANOVA. All graphs are mean ± s.e.m. *p ≤ 0.05, **p ≤ 0.01, ***p ≤ 0.001. ns, not significant.
To test whether IP3 induces IEC proliferation in the absence of external cues, intestinal colonoids were generated from GF mice. Remarkably, IP3 increased growth of colonoids (Fig. 4h, Extended Data Fig. 9a), demonstrating that IP3 directly promotes IEC proliferation. Consistent with this, colonoids treated with phytase-digested phytate exhibited increased growth relative to phytate, indicating metabolites of phytate increase IEC proliferation. (Extended Data Fig. 9b). As suggested by recent work30, butyrate inhibited colonoid growth (Extended Data Fig. 9c), while IP3 partially rescued butyrate-induced inhibition of colonoid growth (Extended Data Fig. 9d, e), further demonstrating antagonizing effects of these metabolites on IECs. To test whether HDAC3 mediates IP3-induced epithelial growth, colonoids were generated from GF-HDAC3FF and HDAC3ΔIEC mice. IP3 induced growth of HDAC3FF organoids (Fig. 4i), however colonoids from HDAC3ΔIEC mice demonstrated impaired basal growth and failed to exhibit sensitivity to IP3 (Fig. 4i), indicating that HDAC3 is necessary for IP3-dependent proliferation. Although significant and consistent, the size increase with IP3 appears relatively modest. However, this effect may reflect physiological limitations as excessive HDAC3 activity and proliferation could present adverse outcomes. To test the functional relevance of these findings in human intestine, organoids were generated from resected colon tissue of IBD patients. Similar to murine intestine, IP3 increased growth of human colonoids relative to vehicle-treated colonoids derived from the same patient (Fig. 4j). These data support that IP3 and phytate metabolism represent new avenues to explore for IBD and other conditions characterized by epithelial damage.
Collectively, we have described a previously unknown relationship in which microbiota-derived IP3 activates HDAC3 in the epithelium to promote repair during barrier disruption (Extended Data Fig. 10). Identification of this pathway reveals a fundamental level of host-microbe regulation in which unique microbiota-derived metabolites fine tune intestinal homeostasis by inhibiting or activating enzymatic function of the same epigenetic modifier (Extended Data Fig. 10). It is likely that dialogue between HDAC3 and these metabolites, and potentially other unidentified microbial products, remains in continuous flux with shifting local concentrations. Therefore, HDAC3 represents a converging enzyme that can coordinate healthy intestinal dynamics by sensing distinct microbial signals generated in response to changes in diet or the microbiota.
METHODS
Mice and human subjects
Floxed HDAC3 and TLR4 mice were bred to C57BL/6J mice expressing Cre-recombinase under the control of villin promoter to generate HDAC3ΔIEC and TLR4ΔIEC mice31–33. Myd88−/− mice were previously described34. Gnotobiotic mice were maintained in sterile isolators (Class Biologically Clean) in the CCHMC Gnotobiotic Mouse Facility, fed autoclaved food and water, and routinely monitored to ensure the absence of microbial contamination. For mono-association studies, GF mice were colonized with bacteria suspended in sterile PBS. For F. prausnitzii colonization, GF mice were pre-treated with 100μl 0.2 M sodium bicarbonate before a single gavage with 2 x10⁹ CFU bacteria. To establish E. coli and phytase−/− E. coli mono-associated mice, GF mice received 2 x10⁹ bacteria in PBS. Mono-associated mice were housed on a sealed positive pressure IVC rack (Allentown) and monitored weekly by culture and 16S qPCR as detailed below. Conventionally housed mice were treated with antibiotic cocktail of 1 mg/ml ampicillin, 5 mg/ml streptomycin, and 1 mg/ml colistin (Sigma-Aldrich) in drinking water for 1 week35. Antibiotic water was refreshed every 7 days, and mice remained on antibiotic water throughout the study. Animals were housed up to 4 per cage in a ventilated cage with 12 h light/dark cycle and free access to chow and water. Animals were provided with appropriate care by a licensed veterinarian. All murine experiments were done according to guidelines of the Institutional Animal Care and Use Committee. De-identified human colonic tissue was obtained from IBD patients undergoing bowel resection for clinical indications. Patients were recruited prospectively for participation in the IBD Biorepository protocol (IRB 2011–2285) at Cincinnati Children’s Hospital Medical Center (CCHMC). All participants had a confirmed diagnosis by a gastroenterologist and parents and patients age 18 and older provided consent and all patients age 11 and older provided assent.
IEC harvest and HDAC activity
IECs were isolated from murine samples as described previously by shaking intestinal tissue in 1 mM EDTA/1 mM DTT and 5% FBS at 37°C for 10 minutes7. For explants, large intestine was cut longitudinally, divided into 1 cm pieces, distributed evenly in wells containing DMEM, 4.5g/l glucose, L-glutamine, 10% FBS, and treated with 1 mM phytate, 10 mM butyrate, or 10 mM TSA for 3 h. Samples within studies were harvested side by side to control for and prevent differences due to time of day. To assess HDAC activity, IECs were lysed in RIPA buffer and HDAC activity was assayed using a fluorometric assay (Active Motif). Briefly, 10 μg of cell lysate was incubated with 100 μM of HDAC substrate at 37°C for 1 hour. 50 μl of developer solution containing 2 μM of trichostatin A (TSA) was added at room temperature to stop the reaction. Fluorescence was measured using a fluorescent plate reader (Biotek Synergy 2) with an excitation wavelength of 340 nm and emission wavelength of 460 nm. 10 nM of recombinant protein [rHDAC1 (Active Motif), rHDAC2 (Active Motif), rNCoR/HDAC3 (Enzo Life Sciences)] was compared for basal HDAC activity, or incubated with 1μM IP3 (Sigma) for 30 min at 37°C. For HDAC3 immunoprecipitation, 250–500 µg of lysate was incubated with anti-HDAC3 antibody (Santa Cruz/Abcam) overnight at 4ºC then incubated with Protein G agarose at 4ºC for 3 hours. The same immunoprecipitated HDAC3 samples were compared across treatments to ensure equivalent starting material pre-incubation. Purified HDAC3 was washed with RIPA buffer and PBS. Butyrate (100 μM) and IP3 (10 nM-10 μM) incubations were performed for 60 minutes at 37ºC prior to measurement of HDAC activity. For lysate analyses, 5–10 μg of protein was incubated with IP3, IP4 (inositol-1,4,5,6,-tetrakisphosphate; Cayman Chemical Company, 10nM −100μM), TSA (10 μM), or bacterial-derived products detailed below (1μg/ml) for 30 min prior to HDAC assay.
RNA analyses
For global expression analyses, three biological replicates of large intestinal EpCAM+ IECs (DAPI−, Lin− (CD45, CD4, CD8, CD11b, CD19)7 were compared for GF and CNV conditions. Data was log2-transformed and differential analysis was performed on all transcripts between CNV and GF mice with significance defined as FDR<0.05 and fold change>1.5. For pathway and ontological analyses, gene lists were submitted to the toppgene database (toppgene.cchmc.org), which amasses ontological data from over 30 individual repositories. Ontology figures were generated using Cytoscape v3.7.1. Candidate gene lists were generated through gataca (gataca.cchmc.org) and toppgene, focusing on inositol phosphate metabolism and inositol triphosphate metabolism. Principal component analysis was used to test the power of candidate gene sets to consistently discriminate between conventionally- and germ-free-housed mice. The first principal component, which accounts for the majority of variability, was assessed for differential distribution between housing conditions using standard t-tests (statistical analyses performed in R v3.5.2). Candidate gene sets were further tested for enrichment using gene set enrichment analysis (GSEA) using software from the Broad Institute. All heatmaps were generated using the standard hierarchical clustering in the gplots package in R v3.5.2. Global expression data is accessible through accession number GSE50190. For real-time PCR, RNA was isolated from cells using the RNeasy Kit (Qiagen) then subjected to reverse transcription with Verso reverse transcriptase (Invitrogen). Expression was compared using SYBR (Applied Biosystems) and analyzed with a threshold in the linear range of amplification.
Chromatin immunoprecipitation
Cells were fixed in 1% PFA for 10 min at room temperature and quenched with 125 mM glycine for an additional 10 min. Fixed cells were washed twice with cold PBS and lysed in two steps (L1: 50mM HEPES, 140mM NaCl, 1mM EDTA, 10% glycerol, 0.5% NP-40, 0.25% Triton X-100 with protease inhibitors; L2: 200mM NaCl, 1mM EDTA, 0.5 mM EGTA, 10mM Tris pH 8.0 with protease inhibitors), each for 10 min on ice with agitation. Nuclear extracts were washed in TE 0.1% SDS with protease inhibitors and sonicated using a Covaris S220 Focused-ultrasonicator. Sheared chromatin were pre-cleared and immunoprecipitated with Protein G Dynabeads (Thermo Fisher Scientific) and rabbit anti-H3K9Ac (MilliporeSigma, 06–942) using a SX-8G IP-STAR automated system (Diagenode) with the following wash buffers: (1) RIPA 150mM NaCl, (2) RIPA 400mM NaCl, (3) Sarkosyl wash buffer (2mM EDTA, 50mM Tris-HCl (pH 7.5), 0.2% Sarkosyl), and (4) TE 0.2% Triton X-100. Immunoprecipitated chromatin was eluted in TE 250mM NaCl 0.3% SDS and treated with Proteinase K (Thermo Fisher Scientific) at 42°C for 30 min, 65°C for 4 hr, and 15°C for 10 min. DNA was isolated using phenol:chloroform isoamyl alcohol with Tris-HCl (pH 8.0) and chloroform phase-separation followed by overnight ethanol precipitation at −20°C. ChIP DNA were purified, treated with molecular-grade RNase A (Thermo Fisher Scientific) for 15 min at 37°C and subjected to real-time PCR or sequenced. For ChIP-seq, libraries were prepared with the ThruPLEX DNA-seq kit (Rubicon) and sequenced on an Illumina HiSeq 2000 sequencing system (Sequencing depth: 20 million reads, sequencing condition: single-end, 50bp). Sequenced reads were mapped to Mus musculus genome mm10 with Bowtie (version 1.2.0)36 with maximum one allowed error in a sequence and no more than one number of hits was allowed. Peaks were identified with MACS36,37 with q-value <0.2 and visualized by the UCSC genome browser in Biowardrobe38. The numbers of significant differential H3K9Ac peaks between CNV or E. coli and GF ChIP-seq data were determined using MANorm39 as log10(p-value) < 0 and M-value > 1. ChIP-seq data can be accessed at GSE148743. ChIP-qPCR was performed using SYBR (Applied Biosystems) and analyzed as fold difference normalized to an unaffected control region. Reactions were run on a real-time PCR system (QuantStudio3; Applied Biosystems) with custom made primer pairs (MilliporeSigma).
IP3 assay
Fecal and IEC pellets were homogenized in cold PBS and extract was collected after centrifugation at 4°C. For mouse colonoids, organoids were cultured in a 24 well plate and treated with phytase-digested phytate (1 mg/ml) supplemented with vehicle (DMSO) or 40 μM of carbenoxolone (Tocris)24,40 for 20 hours. After treatment, colonoids were homogenized and 50 μg of lysate was used for IP3 ELISA. IP3 ELISA was performed on equal protein quantities of IEC lysate and fecal extract according to manufacturer instructions (MyBiosource). Briefly, samples were incubated with 50 µl of biotinylated detection antibody for 45 minutes at 37ºC, washed 3 times, and incubated with HRP conjugate at 37 ºC for 30 minutes. The plate was rinsed with wash buffer followed by substrate incubation for 15 minutes at 37 ºC. The reaction was stopped and the optical density of each well was measured using a micro-plate reader (Biotek Synergy 2) set to 450 nm.
Bacterial culture and quantification
F. prausnitzii (ATCC 27766) was grown for 48 hours at 37°C in brain-heart infusion medium with yeast extract (0.5 %), hemin (5 mg/l), cellulose (1 mg/ml), maltose (1 mg/ml), and cysteine (0.5 mg/ml) in an anaerobic chamber filled with 85 % N2, 10 % CO2, and 5 % H2. Wildtype human commensal E. coli K-12 (ATCC) and phytase−/− E. coli CU-1867 (ATCC) colonies were grown on LB agar plate and inoculated in 10 ml LB broth for overnight culture with or without 1mM phytate. The media was collected for bacterial measurement and IP3 ELISA. Mono-associated mice were monitored for contamination by quantitative PCR. Fecal samples were collected in 2ml pre-weighed sterile microcentrifuge tubes. Fecal bacterial DNA was isolated using QIAamp® Fast DNA Stool Mini Kit (Qiagen) following the kit protocol. Bacterial DNA was assessed by quantitative PCR (QuantStudio3; Applied Biosystems) using 16S and bacterial-specific primer pairs (Invitrogen, MilliporeSigma) and PCR of E. coli phytase gene (appA1). To determine CFUs in mono-associated mice, stool was homogenized in 500 μl PBS and 10 μL of fecal homogenate was used for serial dilutions. E. coli and phytase−/− E. coli were grown on Lennox LB plates in aerobic condition. F. prausnitzii was cultured on 2% agar in anaerobic conditions.
Shotgun metagenome sequencing
DNA was extracted from approximately 0.1 gram of stool using the PowerFecal DNA isolation kit by MO BIO (MO Bio Laboratories) per manufacturer recommendations. DNA samples were diluted to approximately 200 ng/mL and Salinibacter ruber genomic DNA was added at a final concentration of 1.4 ng/mL as an internal standard to all samples. Sequencing libraries were generated from microbial DNA using the Nextera XT protocol (Illumina). Sequencing was performed on an Illumina NextSeq500 machine using 150-bp DNA paired end reads to a depth of approximately 4 G base pairs per sample. Data can be accessed at SRA accession PRJNA644399. Raw sequence data was de-multiplexed and converted to fasta format and subjected to downstream analysis. Paired-end sequencing reads from each sample were aligned with Kraken v241 against a database consisting of the human genome and approximately 40,054 bacterial, fungal, viral and parasitic genomes. The database was derived from the RefSeq genome database (ftp://ftp.ncbi.nlm.nih.gov/genomes/refseq/), human genome (GR38Ch; ftp://ftp.ncbi.nlm.nih.gov/genomes/refseq/vertebrate_mammalian/Homo_sapiens/latest_assembly_versions/), and draft genomes from NCBI Assemblies and PATRIC. Comparison of the overall microbiome composition between groups was performed by multi-response permutation procedure (MRPP) using the Vegan package in R42. Data from the human microbiome project 227 was analyzed with respect to phytase gene abundance in which patient stool was subjected to metagenomic shotgun sequencing and analyzed using the Humann2 pipeline43. Normalized counts were aligned (https://ibdmdb.org/tunnel/public/HMP2/WGS/1818/products; Merged Tables; ecs.tsv.gz) and associated metadata was downloaded from The Inflammatory Bowel Disease Multi’omics Database. Normalized reads aligning to phytase (EC 3.1.3.26) were compared between UC and non-IBD patients (all samples or the last collected sample per subject) by unpaired t-test.
Nuclear magnetic resonance-based short chain fatty acid quantification
Mouse fecal samples were lyophilized and processed by homogenizing using Minilys (Berten Instruments). Samples were filtered using pre-washed 3 kDa spin filters (NANOSEP 3K, Pall Life Sciences) and resuspended in buffer containing 100 mM phosphate and 1.0 mM TMSP. One-dimensional 1H NMR spectra were acquired on a Bruker Avance II 600 MHz spectrometer. Upon Fourier transformation, each spectrum was manually phased, baseline corrected, and referenced to TMSP with Topspin 3.5 software. Chemical shifts were assigned to metabolites based on reference database spectra and concentrations calculated by Chenomx software and normalized to sample weight.
Intestinal organoids (colonoids)
Colon tissue isolated from mouse or human surgical samples was scraped to remove lumen content and superficial cells. Colon tissue was washed 3 times in PBS, cut into small pieces (0.5–1 cm), and incubated in 5 ml chelation buffer (PBS with 2mM EDTA) for 30 minutes at 4ºC. Colon pieces were transferred to 5 ml shaking buffer (43.3 mM sucrose, 54.9 mM sorbitol in PBS) and crypt isolation was confirmed. The suspension was passed through 100 µm cell strainer, rinsed, and centrifuged at 200 x g for 5 minutes at 4ºC. The supernatant was aspirated and the crypt pellet was resuspended in matrigel (Corning). The matrigel crypt mixture was added into each well of a 24 well plate and incubated at 37 ºC for 15 minutes for polymerization. Polymerized matrigel was overlaid with 500 µl colonoid culture media (60% Advanced DMEM/F12, Invitrogen supplemented with N2 supplement, B27 supplement, 10 mM HEPES, 2 mM L-glutamate, 40 % L-WRN media, EGF (50 ng/ml) and 1x penicillin/streptomycin). Colonoids were incubated with IP3 (10 nM-100 uM), butyrate (5 mM), or digested phytate (0.2–1 mg/ml). For size quantification, 10 colonoids were selected from 3–5 random fields at day 0 and measured every 24 hours using Image J over a maximum of 3 days. Growth was analyzed relative to day 0. Colonoids were fixed in 4 % PFA, stained with Phalloidin-iFluor 594 and DAPI, and confocal imaged on a Nikon Ti-E Inverted Microscope A1.
Colonoids were treated with vehicle (H2O) or 1 μg/ml of E. coli LPS (Sigma-Aldrich), flagellin from Salmonella typhimurium strain 14028 (Sigma-Aldrich), Pam3CSK4 (InvivoGen), indicated concentrations of IP3, digested phytate, and butyrate (Sigma-Aldrich) for 5 hours. After treatment, matrigels were disrupted and colonoids were collected in cold PBS. Matrigel and colonoids mixture were passed through 26G needle three times to fully disrupt the matrigel. Colonoids were pelleted by centrifuging at 2.4 x 1000 g for 5 minutes. Pellet colonoids were lysed in RIPA buffer with protease inhibitor (Thermo Scientific). Lysate was centrifuged at 21.1 x1000 g for 5 minutes and used for electrophoresis. PVDF membranes were incubated with anti-HDAC1, anti-HDAC2, anti-HDAC3 antibodies (Abcam), anti-histone H3 (Santa Cruz), and anti-GAPDH at 4°C overnight. Blots were washed with PBST (PBS + 0.1% Tween 20) and incubated with secondary anti-mouse or anti-rabbit antibodies. Fluorescence was detected by LI-COR Odyssey FC.
Murine colitis model
2.5 % DSS was administered in drinking water for 8 days, then removed. Mice were pre-treated with vehicle (water) or 2 % phytate in their drinking water for 7 days prior to DSS administration and continued to receive treatment during and after DSS. For IP3 enema, 100 μl of 10 μM IP3 was administered prior to DSS for 1 week via rectal enema using 1.2mm x 31 cm tubing (Covidien) catheter while mice were anesthetized with 3% isoflurane. Mice then received 2.5 % DSS in drinking water for 8 days. Mice continued to receive daily enemas of 100 μl of 10 μM IP3 throughout the study. After DSS exposure, mice returned to standard drinking water and were monitored daily to assess disease and survival. Disease was scored as follows: (a) feces (normal = 0; pasty, semi-formed = 2; liquid, sticky, or unable to defecate after 5 min = 4), (b) blood (no blood = 0; visible blood in rectum = 1; visible blood on fur = 2), and (c) general appearance (normal = 0; piloerection = 1; lethargy and piloerection = 2; motionless = 4). Fecal lipocalin-2 was assayed from pellets homogenized in PBS at a concentration of 100 mg/mL then centrifuged at high-speed for 10 mins. Levels were determined using mouse Lipocalin-2/NGAL (R&D Systems) following manufacturer’s instructions. For histologic analyses, sections of colon were fixed in 4% paraformaldehyde, paraffin embedded, sectioned, and stained with hematoxylin and eosin. Pathology scoring reflects inflammatory infiltration (1–5), submucosal edema (1–5), and severity of ulceration (1–5), for an overall maximum score of 15.
Flow cytometry
IECs and intraepithelial lymphocytes were first separated by shaking sections of large intestine in 1 mM EDTA/1 mM DTT at 37°C. Remaining tissue was incubated in RPMI with 1 mg/mL collagenase/dispase for 30 min at 37°C with shaking to obtain single cell lamina propria suspensions. For flow cytometry of IESCs, crypts were isolated as described above and digested into a single cell suspension. For intracellular cytokine analyses, cells were stimulated with 50 ng/ml PMA (Sigma-Aldrich), and 500 ng/ml ionomycin (Sigma-Aldrich) in the presence of 10 mg/ml brefeldin A for 3.5 hrs at 37°C. Cells were stained using the following fluorescence-conjugated monoclonal antibodies diluted in FACS buffer (2% FBS, 0.01% Sodium Azide, PBS): Brilliant Violent 711 anti-CD326 (EpCAM) (Clone: G8.8, BD Biosciences), BUV395 anti-CD45.2 (Clone: 104, BD Biosciences), PE-Cy7 anti-CD44 (Clone: IM7, eBioscience), APC-eFluor 780 anti-CD24 (Clone: M1/69, eBioscience), PE anti-CD166 (Clone: eBioALC48, eBioscience), APC-anti-Ki67 (Clone: SolA15, eBioscience), APC-eFluor 780 anti-CD4 (Clone: RM4-5, eBioscience), PE anti-TNFα (Clone: MP6-XT22, eBioscience), and PE-Cy7 anti-IFNγ (Clone: XMG1.2, eBioscience). Dead cells were excluded with the Fixable Violet Dead Cell Stain Kit (Invitrogen). Intracellular Fixation and Permeabilization Buffer Set (Invitrogen) was used for Ki67 staining. Samples were acquired on the BD LSRFortessa and analyzed with FlowJo Software (Treestar).
Statistics
Results are shown as mean ± SEM. Mice of the indicated genotypes were assigned at random to groups. Tests between two groups used a two-tailed Student’s t-test. Survival curves were evaluated by Mantel-Cox test. Results were considered significant at *p ≤ 0.05; **p ≤ 0.01, ***p ≤ 0.001. Statistical analyses were performed using Prism version 7.0.
Extended Data
Extended Data Figure 1. Butyrate inhibits epithelial HDAC activity in the intestine.
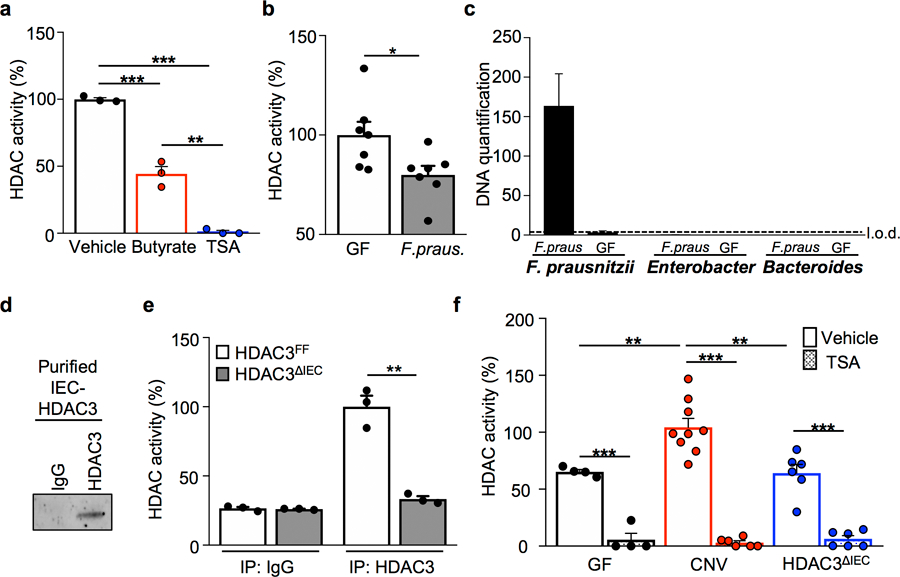
(a) IEC HDAC activity of large intestine explant treated with vehicle (n=3), 10 mM butyrate (n=3), or 10 mM trichostatin A (TSA; n=3) for 3 hours. ***p=4.16E-07 (Vehicle vs TSA), ***p=0.0006 (Vehicle vs Butyrate), **p=0.0015 (Butyrate vs TSA). (b) IEC HDAC activity of GF mice (n=7) and mice mono-associated with F. prausnitzii (butyrate-producing bacteria) (n=7). *p=0.028. (c) Bacterial-specific qPCR of feces for F. prausnitzii, Enterobacteriaceae, and Bacteroides (n=3/group). (d) Western blot of immunoprecipitated HDAC3 from IECs. For gel source data, see Supplementary Fig. 1. (e) HDAC activity of immunoprecipitated (IP) HDAC3 from HDAC3FF (n=3) and HDAC3ΔIEC (n=3) intestinal epithelium. **p=0.001. (f) HDAC activity of IECs from GF (n=4), CNV (Vehicle n=9, TSA n=6), and HDAC3∆IEC mice (n=6) −/+ 10 μM TSA. ***p=5.77E-05 (GF Vehicle vs TSA), ***p=1.12E-07 (CNV Vehicle vs TSA), ***p=3.49E-05 ( HDAC3∆IEC Vehicle vs TSA), **p= 0.008 (Vehicle GF vs CNV), **p= 0.004 (Vehicle CNV vs HDAC3∆IEC). All graphs are mean of biologic replicates ± s.e.m.; unpaired two-tailed t test. Data were independently repeated three (a-c) or two (d-f) times with similar results. *p ≤ 0.05, **p ≤ 0.01, ***p ≤ 0.001
Extended Data Figure 2. HDAC activity and expression in IECs lack sensitivity to multiple bacterial stimuli.
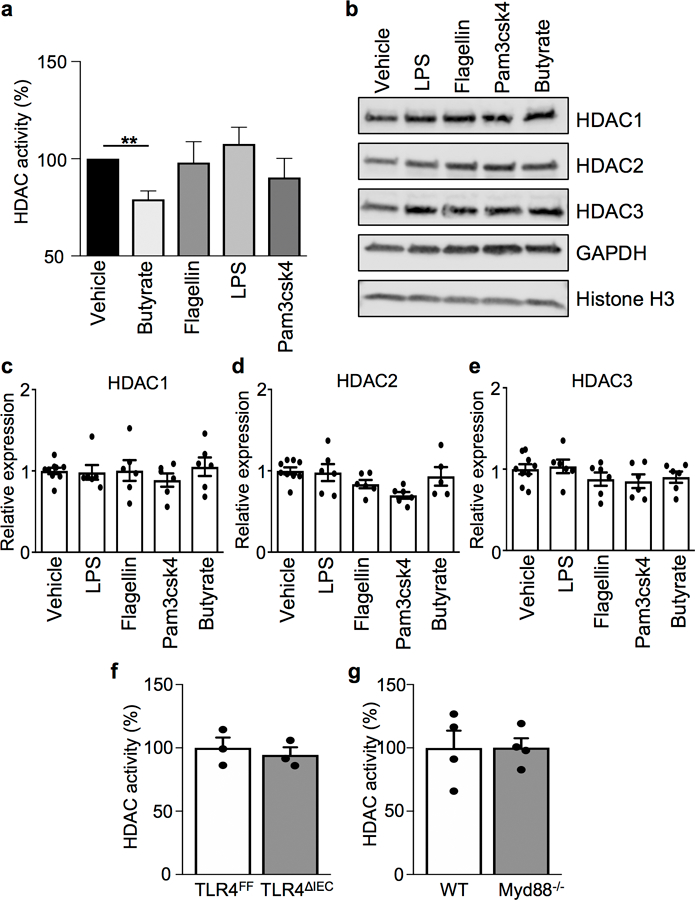
(a) HDAC activity of mouse colonoid lysate treated with 1 μg/ml vehicle, butyrate, flagellin, LPS, or Pam3csk4. n=6/treatment. **p=0.0008. (b) Western blot and (c-e) qPCR analyses of HDAC1, HDAC2, and HDAC3 in colonoids following treatment with vehicle (n=9), butyrate (n=6), flagellin (n=6), LPS (n=6), or Pam3csk4 (n=6); all at 1 μg/ml for 5 hours. For gel source data, see Supplementary Fig. 1. (f, g) HDAC activity in IECs harvested from (f) floxed TLR4FF and IEC-specific toll-like receptor 4 knockout (TLR4ΔIEC) mice (n=3/genotype) or (g) wildtype and Myd88 knockout (Myd88−/−) mice (n=4/genotype). All graphs are mean of biologic replicates ± s.e.m.; unpaired two-tailed t test. Data were independently repeated four (a) or two (b-g) times with similar results. **p ≤ 0.01.
Extended Data Figure 3. Inositol phosphate-sensitive pathways are upregulated in microbiota-replete mice and IP3 induces enhanced HDAC3 activity.
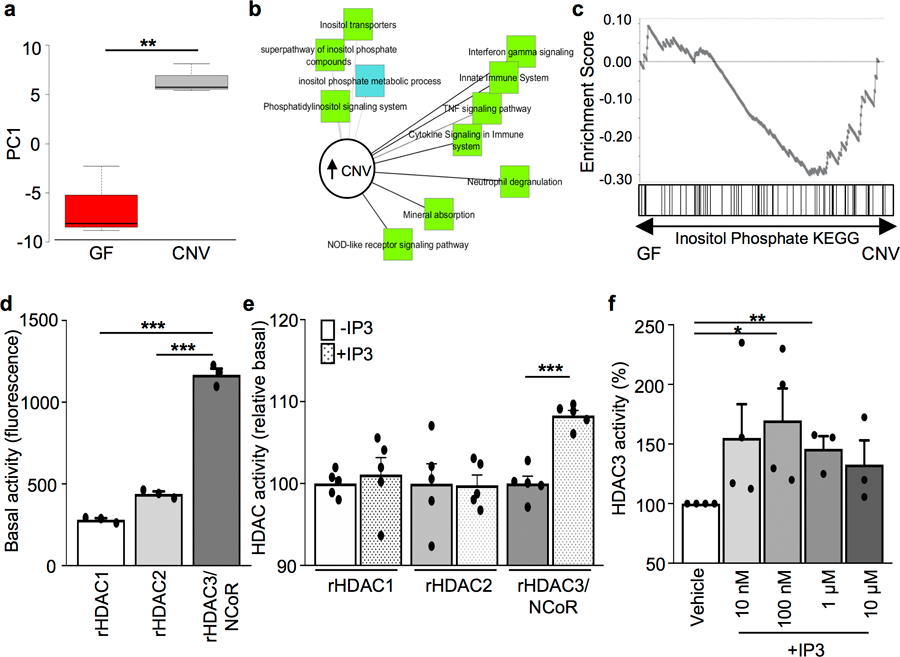
(a) Principle component analysis of gene expression of inositol phosphate-sensitive pathways in IECs from GF (n=3) and CNV (n=3) mice. **p=0.0046. (b) Pathway analysis showing upregulated signaling pathways in IECs from (a). (c) Gene set enrichment analysis (GSEA) comparing IECs from (a) to published data enrichment sets obtained from KEGG. *p=0.05 (d) Basal activity (fluorescence units) of 10 nM recombinant HDAC1, HDAC2, and HDAC3/NCoR-deacetylase activation domain (n=3/group). ***p=2.19E-05 (vs. HDAC1), ***p=5.48E-05 (vs. HDAC2). (e) HDAC activity normalized to recombinant basal levels following incubation with vehicle or 1μM IP3. n= 5/treatment. ***p= 6.61E-05. (f) HDAC activity of immunoprecipitated HDAC3 from primary IECs incubated with increasing IP3 doses. n=4 (Vehicle, 10nM, 100nM), n=3 (1μM, 10μM), *p= 0.040, **p= 0.003. Data in all graphs are mean ± s.e.m.; unpaired two-tailed t test. Data in d-f were independently repeated three times with similar results. *p ≤ 0.05, **p ≤ 0.01, ***p ≤ 0.001.
Extended Data Figure 4. Inositol phosphate induces HDAC enzymatic activity without altering expression in IECs.
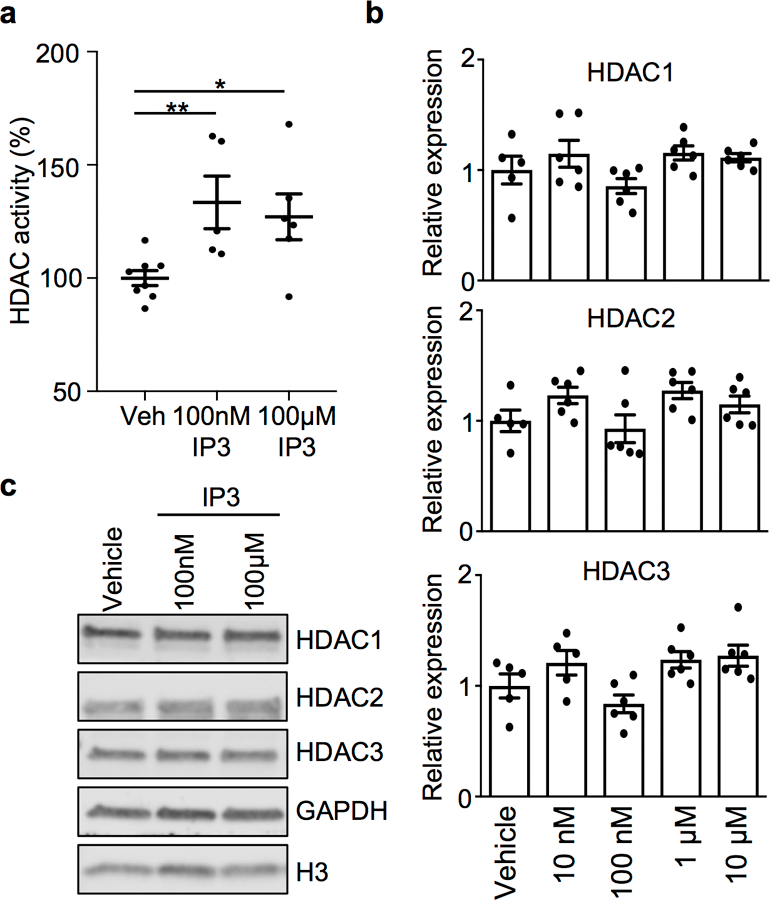
(a) HDAC activity in mouse colonoids following incubation with increasing doses of IP3 for 5 hours (Vehicle: n=8; 100nM IP3: n=5, *p=0.0062; 100μM IP3: n=6, *p=0.0147). (b) mRNA expression of HDAC1, HDAC2 and HDAC3 in mouse colonoids following incubation with IP3 for 5 hours at indicated dose (Vehicle: n=5; IP3: n=6/dose). (c) Western blot of HDAC1, HDAC2 and HDAC3 in colonoids from (a). For gel source data, see Supplementary Fig. 1. All graphs are mean of biologic replicates ± s.e.m.; unpaired two-tailed t test. Data were independently repeated three times with similar results. *p ≤ 0.05, **p ≤ 0.01.
Extended Data Figure 5. Phytate digestion promotes HDAC activity in IECs.
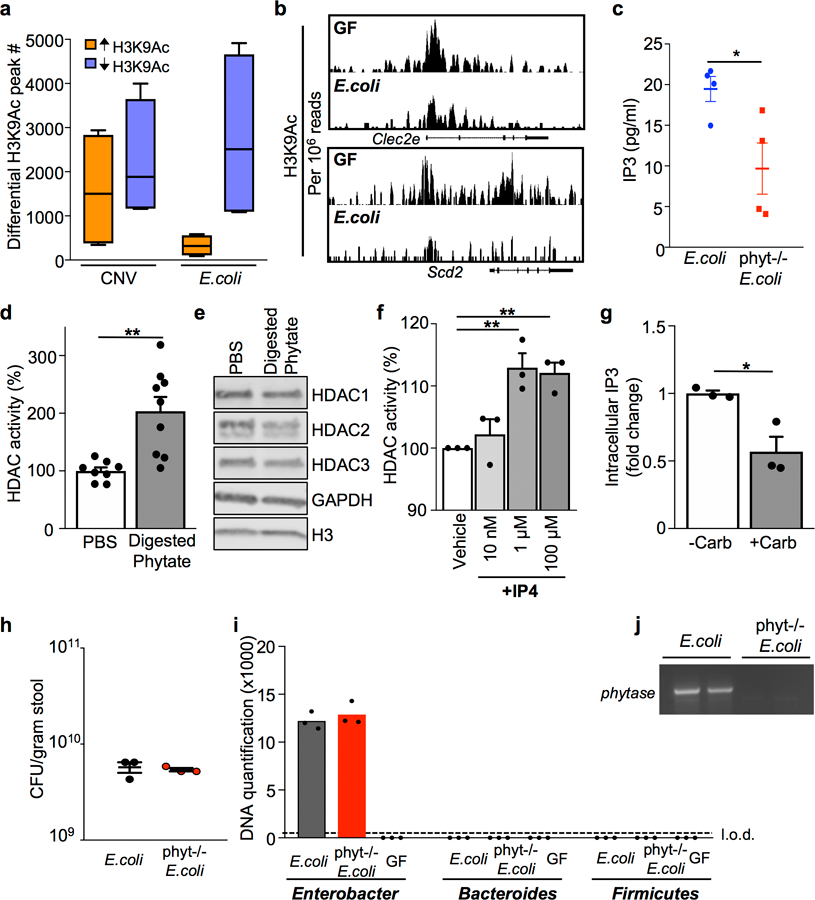
(a) Number of peaks identified by ChIP-sequencing with significantly increased or decreased H3K9Ac enrichment in IECs, relative to IECs harvested from GF mice. n=2/group; Min to max plots for each comparison (4 per bar); line at median. (b) ChIP-seq for H3K9Ac at HDAC3 target genes in primary IECs isolated from GF and E. coli mono-associated mice. Peaks are normalized to reads per million mapped reads. (c) IP3 levels in 1010 colony forming units (CFU)/ml cultures of phytase−/− E. coli (n=4) versus wildtype E. coli (n=4) *p= 0.0314. (d) HDAC activity of mouse colonoids treated with PBS (n=8) or phytase-digested phytate (1mg/ml) (n=9) for 5 hours.**p= 0.0016. (e) Western blot detection of HDACs in mouse colonoid lysate. For gel source data, see Supplementary Fig. 1. (f) HDAC activity with inositol-1,4,5,6-tetrakisphosphate (IP4) doses as indicated. n=3/group. **p=0.0052 (1μM), **p=0.0018 (100μM). (g) Relative intracellular IP3 levels of colonoids treated with phytase-digested phytate (1mg/ml) −/+ 40 μM carbenoxolone. n=3/treatment. *p=0.0189. (h) CFU measured in stool collected from mice mono-associated with E. coli or phytase−/− E. coli. n=3/group. (i) Bacterial-specific qPCR of feces for Enterobacteriaceae, Bacteroides, and Firmicutes. n=3/group. (j) PCR of E. coli phytase gene (appA1) in stool from mono-associated mice in (h, i). All graphs, except (a), are mean of biologic replicates ± s.e.m.; unpaired two-tailed t test. Data were independently repeated two (e, f) or three (c, d, g-j) times with similar results. *p ≤ 0.05, **p ≤ 0.01.
Extended Data Figure 6. Microbiota-dependent breakdown of dietary phytate improves recovery from intestinal damage.
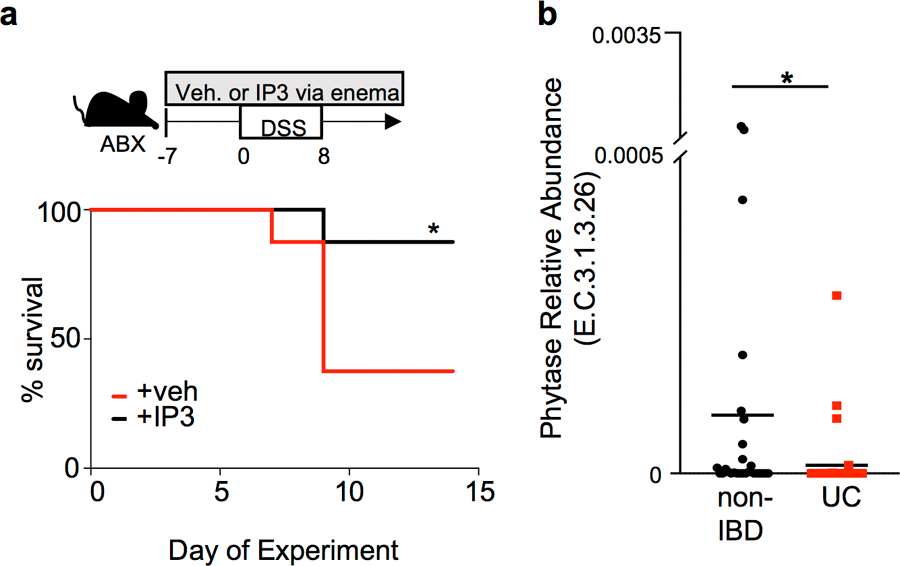
(a) Percent survival of antibiotic-treated mice exposed to 2.5% DSS while receiving vehicle (n=8) or 10 μM IP3 (n=8) via rectal enema as depicted in diagram. *p=0.0423 Mantel-Cox test; independently repeated two times. (b) Abundance of bacterial phytase (E.C.3.1.3.26) DNA sequence in last stool sample collected from non-IBD (n=27) and ulcerative colitis (UC) (n=38) patients in Human Microbiome Project27. *p=0.036; unpaired two-tailed t test. *p ≤ 0.05.
Extended Data Figure 7. Microbiota and SCFA composition are not altered in phytate-sensitive DSS protection.
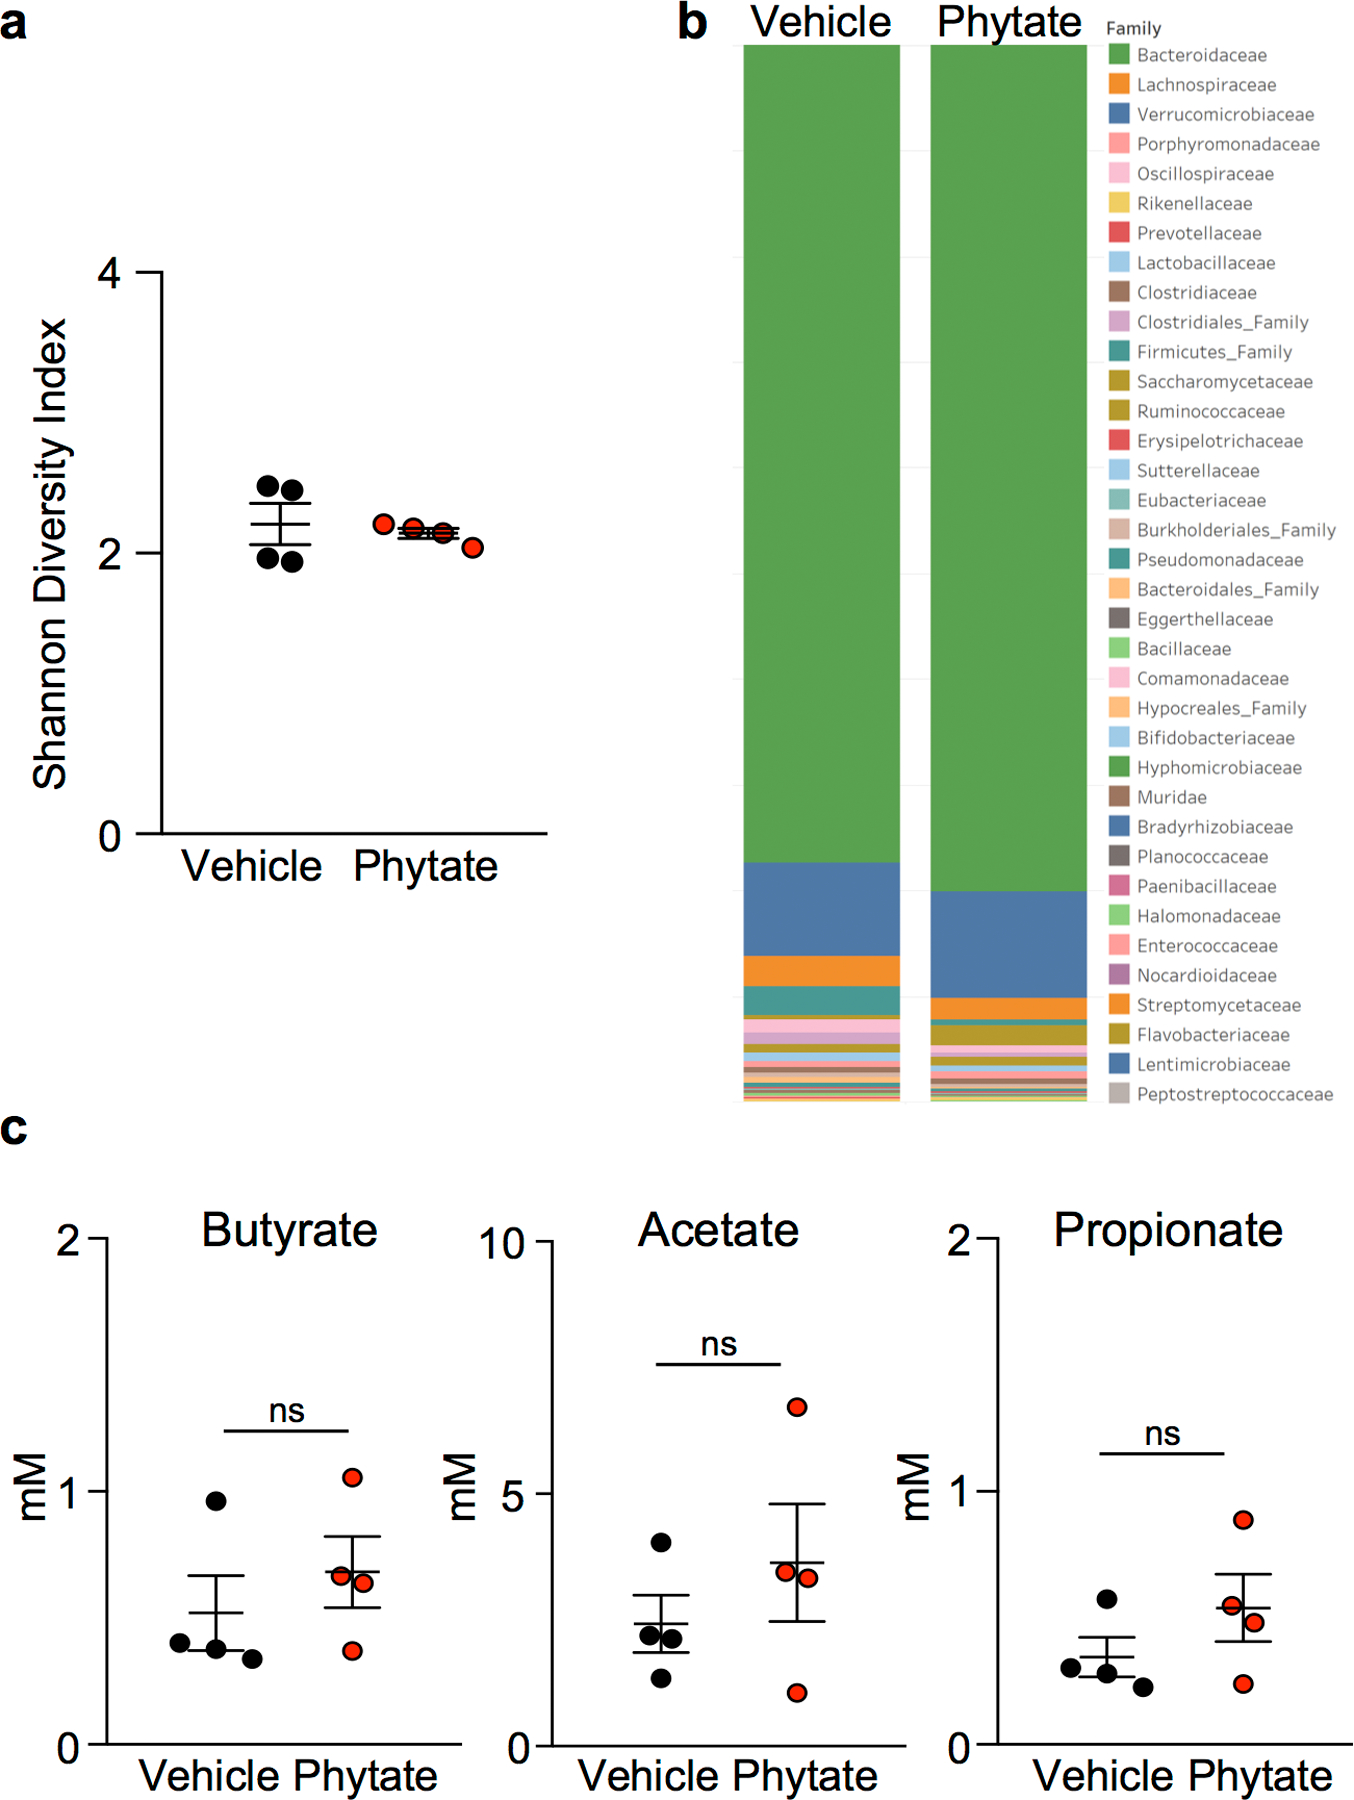
(a) Shannon diversity index (n=4/group) and (b) comparison of bacterial communities in stool collected from DSS-treated mice −/+ 2% phytate (n=4/group). (c) Nuclear magnetic resonance identification of short chain fatty acids in intestinal contents from vehicle- and 2% phytate-treated DSS mice, n = 4/group. Graphs (a, c) are mean ± s.e.m.; ns, not significant.
Extended Data Figure 8. Phytate decreases pathology caused by intestinal epithelial damage.
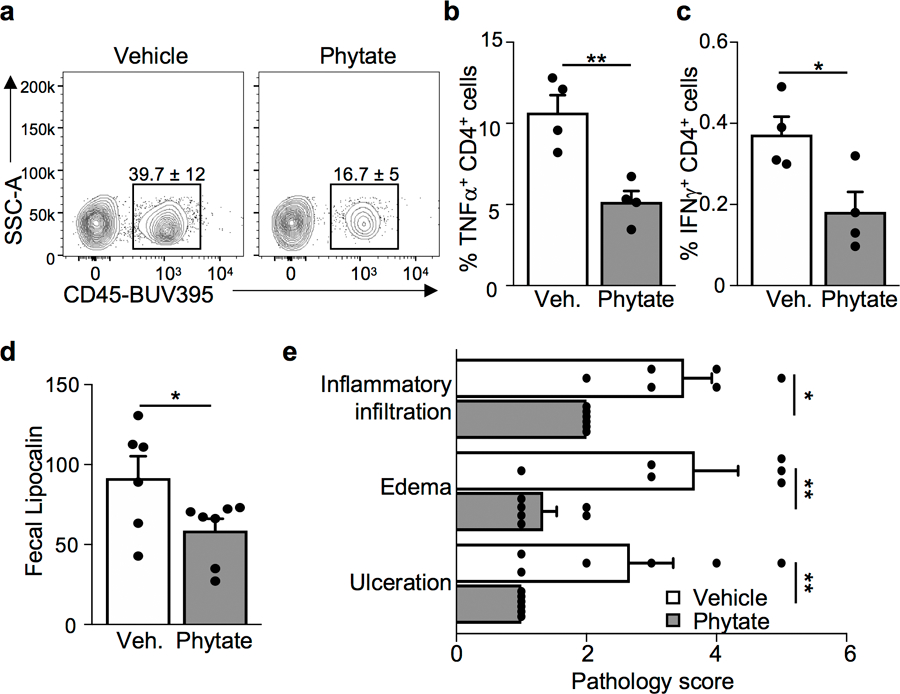
(a) Frequency of CD45+ intraepithelial leukocytes assessed by flow cytometry (gated on live cells). n=4/group. *p=0.0107. (b, c) Frequency of (b) TNFα and (c) IFNγ producing CD4+ lamina propria leukocytes from vehicle- and 2% phytate-treated mice during DSS-induced colitis (gated on live, CD45+ CD4+). n=4/group. **p=0.0048 (b), *p=0.0277 (c). (d) Relative fecal lipocalin levels measured by ELISA in vehicle (n=6) or phytate treated (n=7) mice *p=0.0484. (e) Histologic scoring parameters for figure 4d. Scores reflect severity of the DSS-induced histologic parameters: inflammatory infiltration (1–5), edema (1–5), and ulceration on a scale ranging from 1 to 5 with 5 being most severe. n=6/group [inflammatory infiltration: *p=0.0314; edema: **p=0.0075; ulceration: **p=0.0057]. Graphs are mean of biologic replicates ± s.e.m; unpaired two-tailed t test. Data were independently repeated three times with similar results. *p ≤ 0.05, **p ≤ 0.01.
Extended Data Figure 9. Inositol trisphosphate counters butyrate-induced inhibition of colonoid growth.
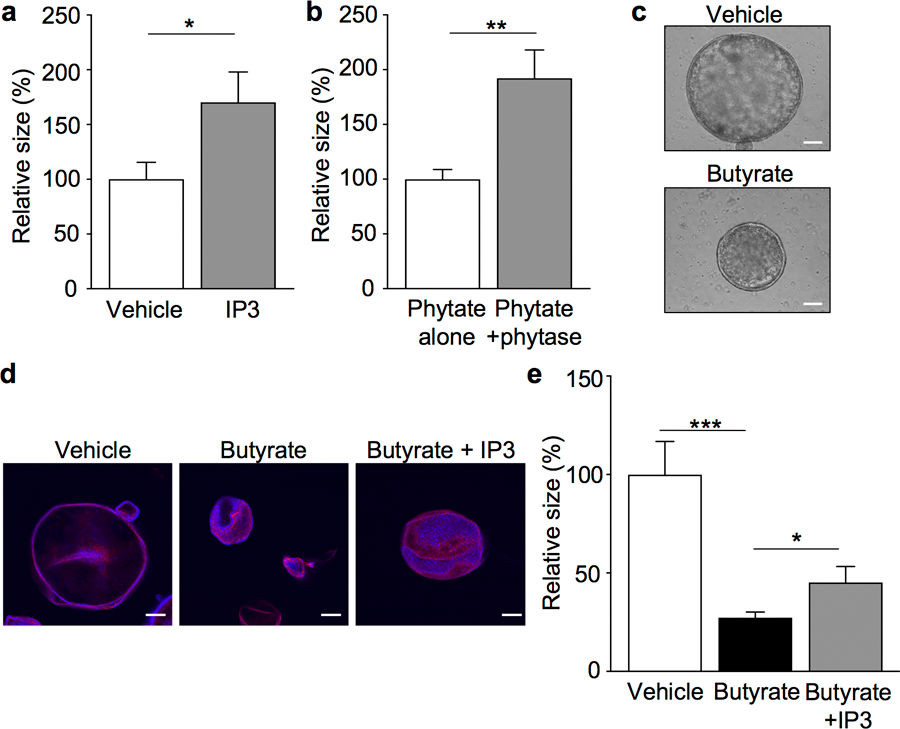
(a, b) Growth of colonoids generated from GF mice and treated with (a) vehicle or IP3 (10nM; n=60 colonoids/treatment; *p=0.029) or (b) phytate vs. phytase-digested phytate (0.2mg/ml; n=40 colonoids/treatment; **p=0.0012). (c) Representative images of GF colonoids treated with vehicle or 1mM butyrate, scale bars, 100 µm. (d, e) (d) Representative images (red: phalloidin, blue: DAPI), scale bars, 100µm and (e) growth of colonoids from GF mice treated with vehicle, 5mM butyrate, or 5mM butyrate + 50nM IP3; n=30 colonoids/treatment; *p=0.0409, ***p=0.0001). All graphs are mean of biologic replicates ± s.e.m.; unpaired two-tailed t test. Data were independently repeated two (b) or four (a, c-e) times with similar results. *p ≤ 0.05, **p ≤ 0.01, ***p ≤ 0.001.
Extended Data Figure 10. Epithelial HDAC3 functions as an intestinal sensor of distinct microbiota-derived metabolites.
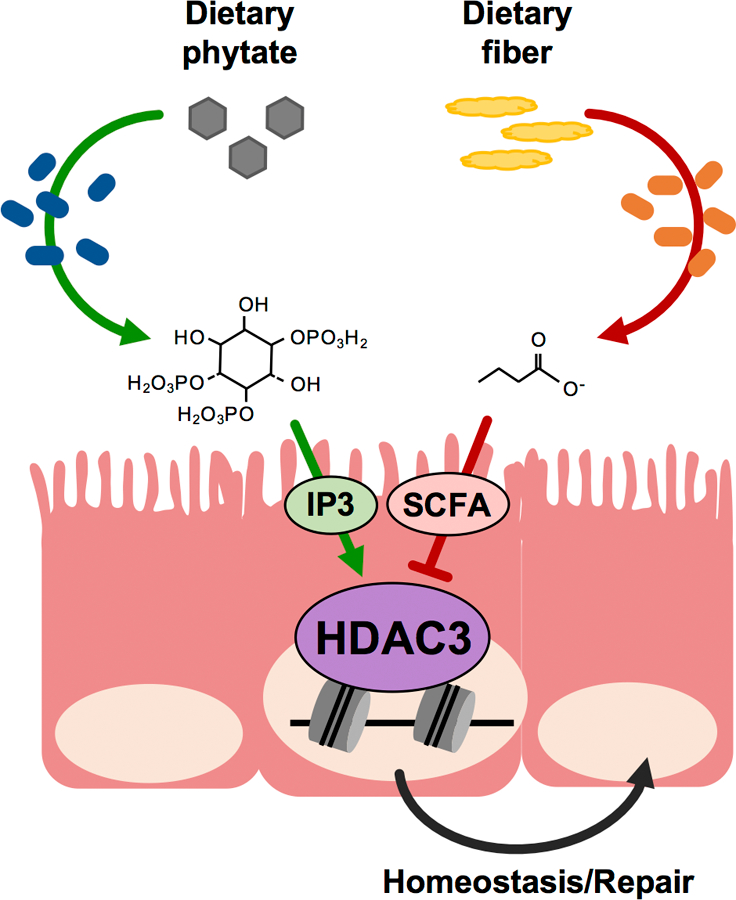
Microbiota can generate inhibitory (SCFA) and activating (IP3) signals through metabolism of dietary fibers and phytate, respectively. Epithelial HDAC3 functions as a central hub for these opposing signals, and likely additional factors, to modulate enzymatic activity and intestinal epithelial homeostasis/repair. Therefore, HDAC3 represents an epigenetic-modifying enzyme that can calibrate intestinal dynamics in response to alterations in diet and/or microbiota.
Supplementary Material
Acknowledgements
We thank the Way, Qualls, Deshmukh labs, M. Lazar, and D. Artis for useful discussions. We thank CCHMC Veterinary Services, Pathology Research Core, Research Flow Cytometry Core, NMR-based Metabolomics Core, and Confocal Imaging Core for services and technical assistance. This research is supported by the National Institutes of Health (DK114123, DK116868 to T.A., DK098231 to L.A.D., F32AI147591 to. E.M.E.), Pew Charitable Trust, and a Kenneth Rainin Foundation award to T.A. T.A. holds an Investigator in the Pathogenesis of Infectious Disease Award from the Burroughs Wellcome Fund. This project is supported in part by PHS grant P30 DK078392 and the CCHMC Trustee Award and Procter Scholar’s Program.
Footnotes
Competing interests
The authors declare no competing interests.
Data Availability Statement
Global datasets are available in the Gene Expression Omnibus repository (GSE50190, GSE148743). Source Data are provided for Figs. 1–4 and Extended Data Figs. 1–9. Raw uncropped gel scans with size markers indicated can be found in Supplementary Information.
Code Availability Statement
Description of scripts used to analyze metagenomic data are provided in the Methods and the scripts are available upon request.
REFERENCES
- 1.Honda K & Littman DR The Microbiome in Infectious Disease and Inflammation. Annu Rev Immunol, doi: 10.1146/annurev-immunol-020711-074937 (2011). [DOI] [PMC free article] [PubMed] [Google Scholar]
- 2.Feil R & Fraga MF Epigenetics and the environment: emerging patterns and implications. Nat Rev Genet 13, 97–109, doi: 10.1038/nrg3142 (2011). [DOI] [PubMed] [Google Scholar]
- 3.Peterson LW & Artis D Intestinal epithelial cells: regulators of barrier function and immune homeostasis. Nat Rev Immunol 14, 141–153, doi: 10.1038/nri3608 (2014). [DOI] [PubMed] [Google Scholar]
- 4.Kim TH et al. Broadly permissive intestinal chromatin underlies lateral inhibition and cell plasticity. Nature 506, 511–515, doi: 10.1038/nature12903 (2014). [DOI] [PMC free article] [PubMed] [Google Scholar]
- 5.Elliott EN, Sheaffer KL, Schug J, Stappenbeck TS & Kaestner KH Dnmt1 is essential to maintain progenitors in the perinatal intestinal epithelium. Development 142, 2163–2172, doi: 10.1242/dev.117341 (2015). [DOI] [PMC free article] [PubMed] [Google Scholar]
- 6.Wilson AJ et al. Histone deacetylase 3 (HDAC3) and other class I HDACs regulate colon cell maturation and p21 expression and are deregulated in human colon cancer. J Biol Chem 281, 13548–13558, doi: 10.1074/jbc.M510023200 (2006). [DOI] [PubMed] [Google Scholar]
- 7.Alenghat T et al. Histone deacetylase 3 coordinates commensal-bacteria-dependent intestinal homeostasis. Nature 504, 153–157, doi: 10.1038/nature12687 (2013). [DOI] [PMC free article] [PubMed] [Google Scholar]
- 8.Turgeon N et al. HDAC1 and HDAC2 restrain the intestinal inflammatory response by regulating intestinal epithelial cell differentiation. PloS one 8, e73785–e73785, doi: 10.1371/journal.pone.0073785 (2013). [DOI] [PMC free article] [PubMed] [Google Scholar]
- 9.Navabi N et al. Epithelial Histone Deacetylase 3 Instructs Intestinal Immunity by Coordinating Local Lymphocyte Activation. Cell Rep 19, 1165–1175, doi: 10.1016/j.celrep.2017.04.046 (2017). [DOI] [PMC free article] [PubMed] [Google Scholar]
- 10.Schell MJ Inositol trisphosphate 3-kinases: focus on immune and neuronal signaling. Cell Mol Life Sci 67, 1755–1778, doi: 10.1007/s00018-009-0238-5 (2010). [DOI] [PMC free article] [PubMed] [Google Scholar]
- 11.Kim E, Beon J, Lee S, Park J & Kim S IPMK: A versatile regulator of nuclear signaling events. Adv Biol Regul 61, 25–32, doi: 10.1016/j.jbior.2015.11.005 (2016). [DOI] [PubMed] [Google Scholar]
- 12.Zhang J, Kalkum M, Chait BT & Roeder RG The N-CoR-HDAC3 nuclear receptor corepressor complex inhibits the JNK pathway through the integral subunit GPS2. Mol Cell 9, 611–623, doi: 10.1016/s1097-2765(02)00468-9 (2002). [DOI] [PubMed] [Google Scholar]
- 13.Guenther MG, Barak O & Lazar MA The SMRT and N-CoR Corepressors Are Activating Cofactors for Histone Deacetylase 3. Molecular and Cellular Biology 21, 6091 LP-6101, doi: 10.1128/MCB.21.18.6091-6101.2001 (2001). [DOI] [PMC free article] [PubMed] [Google Scholar]
- 14.Alenghat T et al. Nuclear receptor corepressor and histone deacetylase 3 govern circadian metabolic physiology. Nature 456, 997–1000, doi: 10.1038/nature07541 (2008). [DOI] [PMC free article] [PubMed] [Google Scholar]
- 15.Watson PJ, Fairall L, Santos GM & Schwabe JW Structure of HDAC3 bound to co-repressor and inositol tetraphosphate. Nature 481, 335–340, doi: 10.1038/nature10728 (2012). [DOI] [PMC free article] [PubMed] [Google Scholar]
- 16.Feng D et al. A circadian rhythm orchestrated by histone deacetylase 3 controls hepatic lipid metabolism. Science 331, 1315–1319, doi:331/6022/1315 (2011). [DOI] [PMC free article] [PubMed] [Google Scholar]
- 17.Mullican SE et al. Histone deacetylase 3 is an epigenomic brake in macrophage alternative activation. Genes Dev 25, 2480–2488, doi: 10.1101/gad.175950.111 (2011). [DOI] [PMC free article] [PubMed] [Google Scholar]
- 18.Kuang Z et al. The intestinal microbiota programs diurnal rhythms in host metabolism through histone deacetylase 3. Science 365, 1428–1434, doi: 10.1126/science.aaw3134 (2019). [DOI] [PMC free article] [PubMed] [Google Scholar]
- 19.Krautkramer KA et al. Diet-Microbiota Interactions Mediate Global Epigenetic Programming in Multiple Host Tissues. Mol Cell 64, 982–992, doi: 10.1016/j.molcel.2016.10.025 (2016). [DOI] [PMC free article] [PubMed] [Google Scholar]
- 20.Schlemmer U, Frolich W, Prieto RM & Grases F Phytate in foods and significance for humans: food sources, intake, processing, bioavailability, protective role and analysis. Mol Nutr Food Res 53 Suppl 2, S330–375, doi: 10.1002/mnfr.200900099 (2009). [DOI] [PubMed] [Google Scholar]
- 21.Wise A & Gilburt DJ Phytate hydrolysis by germfree and conventional rats. Applied and Environmental Microbiology 43, 753–756 (1982). [DOI] [PMC free article] [PubMed] [Google Scholar]
- 22.Lim D, Golovan S, Forsberg CW & Jia Z Crystal structures of Escherichia coli phytase and its complex with phytate. Nat Struct Biol 7, 108–113, doi: 10.1038/72371 (2000). [DOI] [PubMed] [Google Scholar]
- 23.Woo V et al. Microbiota inhibit epithelial pathogen adherence by epigenetically regulating C-type lectin expression. Frontiers in Immunology 10, 1–10, doi: 10.3389/fimmu.2019.00928 (2019). [DOI] [PMC free article] [PubMed] [Google Scholar]
- 24.Gossman DG & Zhao H-B Hemichannel-Mediated Inositol 1,4,5-Trisphosphate (IP3) Release in the Cochlea: A Novel Mechanism of IP3 Intercellular Signaling. Cell Commun Adhes 15, 305–315, doi: 10.1080/15419060802357217. (2008). [DOI] [PMC free article] [PubMed] [Google Scholar]
- 25.Hernández-Chirlaque C et al. Germ-free and antibiotic-treated mice are highly susceptible to epithelial injury in DSS colitis. Journal of Crohn’s and Colitis 10, 1324–1335, doi: 10.1093/ecco-jcc/jjw096 (2016). [DOI] [PubMed] [Google Scholar]
- 26.Rakoff-Nahoum S, Paglino J, Eslami-Varzaneh F, Edberg S & Medzhitov R Recognition of commensal microflora by toll-like receptors is required for intestinal homeostasis. Cell 118, 229–241, doi: 10.1016/j.cell.2004.07.002 (2004). [DOI] [PubMed] [Google Scholar]
- 27.Lloyd-Price J et al. Multi-omics of the gut microbial ecosystem in inflammatory bowel diseases. Nature 569, 655–662, doi: 10.1038/s41586-019-1237-9 (2019). [DOI] [PMC free article] [PubMed] [Google Scholar]
- 28.Gevers D et al. The treatment-naive microbiome in new-onset Crohn’s disease. Cell Host and Microbe 15, 382–392, doi: 10.1016/j.chom.2014.02.005 (2014). [DOI] [PMC free article] [PubMed] [Google Scholar]
- 29.Franzosa EA et al. Gut microbiome structure and metabolic activity in inflammatory bowel disease. Nat Microbiol 4, 293–305, doi: 10.1038/s41564-018-0306-4 (2019). [DOI] [PMC free article] [PubMed] [Google Scholar]
- 30.Kaiko GE et al. The Colonic Crypt Protects Stem Cells from Microbiota-Derived Metabolites. Cell 165, 1708–1720, doi: 10.1016/j.cell.2016.05.018 (2016). [DOI] [PMC free article] [PubMed] [Google Scholar]
REFERENCES (METHODS)
- 31.Whitt J et al. Disruption of Epithelial HDAC3 in Intestine Prevents Diet-Induced Obesity in Mice. Gastroenterology 155, 501–513, doi: 10.1053/j.gastro.2018.04.017 (2018). [DOI] [PMC free article] [PubMed] [Google Scholar]
- 32.Madison BB et al. Cis elements of the villin gene control expression in restricted domains of the vertical (crypt) and horizontal (duodenum, cecum) axes of the intestine. J Biol Chem 277, 33275–33283, doi: 10.1074/jbc.M204935200 (2002). [DOI] [PubMed] [Google Scholar]
- 33.McAlees JW et al. Distinct Tlr4-expressing cell compartments control neutrophilic and eosinophilic airway inflammation. Mucosal Immunol 8, 863–873, doi: 10.1038/mi.2014.117 (2015). [DOI] [PMC free article] [PubMed] [Google Scholar]
- 34.Schnare M et al. Toll-like receptors control activation of adaptive immune responses. Nat Immunol 2, 947–950, doi: 10.1038/ni712 (2001). [DOI] [PubMed] [Google Scholar]
- 35.Vetizou M et al. Anticancer immunotherapy by CTLA-4 blockade relies on the gut microbiota. Science 350, 1079–1084, doi: 10.1126/science.aad1329 (2015). [DOI] [PMC free article] [PubMed] [Google Scholar]
- 36.Langmead B, Trapnell C, Pop M & Salzberg SL Ultrafast and memory-efficient alignment of short DNA sequences to the human genome. Genome Biol 10, R25, doi: 10.1186/gb-2009-10-3-r25 (2009). [DOI] [PMC free article] [PubMed] [Google Scholar]
- 37.Zhang Y et al. Model-based analysis of ChIP-Seq (MACS). Genome Biol 9, R137, doi:gb-2008-9-9-r137 (2008). [DOI] [PMC free article] [PubMed] [Google Scholar]
- 38.Kartashov AV & Barski A BioWardrobe: an integrated platform for analysis of epigenomics and transcriptomics data. Genome Biol 16, 158, doi: 10.1186/s13059-015-0720-3 (2015). [DOI] [PMC free article] [PubMed] [Google Scholar]
- 39.Shao Z, Zhang Y, Yuan G-C, Orkin SH & Waxman DJ MAnorm: a robust model for quantitative comparison of ChIP-Seq data sets. Genome Biology 13, R16, doi: 10.1186/gb-2012-13-3-r16 (2012). [DOI] [PMC free article] [PubMed] [Google Scholar]
- 40.Sagar GD & Larson DM Carbenoxolone inhibits junctional transfer and upregulates Connexin43 expression by a protein kinase A-dependent pathway. J Cell Biochem 98, 1543–1551, doi: 10.1002/jcb.20870 (2006). [DOI] [PubMed] [Google Scholar]
- 41.Wood D & Salzberg SL Kraken: ultrafast metagenomic sequence classification using exact alignments. Genome Biology 15, R46 (2014). [DOI] [PMC free article] [PubMed] [Google Scholar]
- 42.Oksanen J, Blanchet F Guillaume, Friendly, Michael, Kindt, Roeland, Legendre, Pierre, McGlinn, Dan, Minchin, Peter R, O’Hara RB, Simpson, Gavin L, Solymos, Peter, Henry M Stevens H, Szoecs, Eduard, Wagne, Helene vegan: Community Ecology Package. R package version 2.5–3. https://CRAN.R-project.org/package=vegan. (2018).
- 43.Franzosa EA et al. Species-level functional profiling of metagenomes and metatranscriptomes. Nat Methods 15, 962–968, doi: 10.1038/s41592-018-0176-y (2018). [DOI] [PMC free article] [PubMed] [Google Scholar]
Associated Data
This section collects any data citations, data availability statements, or supplementary materials included in this article.


