

Abstract
The pharmacokinetics of low dose busulfan (BU) were investigated as a non-myeloablative conditioning regimen for autologous gene therapy (GT) in pediatric subjects with adenosine deaminase-deficient severe combined immunodeficiency (ADA SCID). In three successive clinical trials, which included either γ-retroviral (γ-RV) or lentiviral (LV) vectors, subjects were conditioned with BU using different dosing nomograms; the first cohort received BU doses based on body surface area (BSA), the second based on actual body weight (ABW), and the third utilized therapeutic drug monitoring (TDM) to target a specific area under the concentration-time curve (AUC). Neither BSA nor ABW-based dosing achieved consistent cumulative BU AUC; in contrast, use of TDM-based dosing led to more consistent AUC. BU clearance increased as subject age increased from birth to eighteen months. However, weight and age alone were insufficient to accurately predict a single dose to administer that would consistently achieve a target AUC. Furthermore, various clinical, laboratory and genetic factors (i.e. genotypes for glutathione-S-transferase isozymes known to participate in BU metabolism) were analyzed; no single finding predicted subjects with rapid vs. slow clearance. Analysis of BU AUC and the post-engraftment vector copy number (VCN) in granulocytes, a surrogate marker of the level of engrafted gene-modified hematopoietic stem and progenitor cell (HSPC), demonstrated gene marking at levels sufficient for therapeutic benefit in the subjects who had achieved target BU AUC. While many factors ultimately determine the ultimate engraftment following GT, this work demonstrated that the BU AUC correlated with the eventual level of engrafted gene-modified HSPC within a vector group (γ-RV vs. LV), with significantly higher levels of granulocyte VCN in the recipients of LV-modified grafts compared to γ-RV transduced grafts. Taken together, these findings provide insight into low-dose BU pharmacokinetics in the unique setting of autologous GT for ADA SCID, and these dosing principles may be applied to future GT trials that utilize low dose BU to open the bone marrow niche.
Keywords: Adenosine deaminase, SCID, busulfan, pharmacokinetics, Gene therapy, Clinical trials
Introduction
Busulfan (1,4-butanediol dimethanesulfonate) is a bifunctional alkylating agent that is cytotoxic to hematopoietic stem and progenitor cells (HSPC).1 Busulfan (BU) is widely used for cytoreduction (full or partial) in both myeloablative and reduced intensity allogeneic hematopoietic stem cell transplant (HSCT) conditioning regimens and prior to autologous gene therapy (GT). Appropriate BU dosing is critical to the success of HSCT, because low BU plasma exposure can result in engraftment failure and high BU exposure can increase regimen-related toxicity.2 Previous groups have assessed varying BU doses and exposure [area under the concentration-time curve (AUC)] targets in non-human primates to determine a relationship between BU plasma exposure and stable engraftment of lentiviral (LV)-modified genetic material.3,4 When used prior to GT, higher BU doses and plasma exposure are associated with increased multi-lineage engraftment.5
However, BU conditioning before GT involves a short treatment course (i.e. 1-3 days) of BU administration, which makes it desirable to achieve the target plasma exposure quickly.5 There are various nomograms for the initial BU dose, many of which are weight-based and some of which include postnatal age, as both weight and age have been shown to influence BU pharmacokinetics.6,7 For IV BU, simulations from population pharmacokinetic modeling indicate that the target plasma exposure is attained more frequently with the nomogram approved by European Medicines Agency (70%) compared to that of the U.S. Food and Drug Administration (57%).6 There has also been keen interest in personalizing the initial BU dose using pharmacogenomics based on the candidate gene approach or metabolomics.8 While prior studies have reported decreased clearance in the immune deficient population compared with other populations requiring BU conditioning,9 an analysis of over 1600 subjects did not substantiate this finding.6
There has been great interest in identifying genetic determinants of inter-individual variations in BU pharmacokinetics.10,11 Prior work has demonstrated that glutathione S-transferase (GST) metabolizes BU, so an attractive putative etiology for the widespread variation in BU clearance has implicated polymorphisms of the genes encoding this enzyme.12–18 Genetic polymorphisms in GST isoenzymes GSTA1, GSTM1, GSTP1, and GSTT1 have been widely analyzed with respect to BU pharmacokinetics, although multiple studies have yielded inconsistent results.12,16,19–21 Other groups have analyzed variants in the cytochrome P450 superfamily as factors in BU metabolism.9,18 As the relationships between BU clearance with polymorphisms in the genes for various GST enzymes have been inconsistent, pharmacogenomics-based dosing of BU-receiving subjects has not become a standard practice.22
Given the paucity of clear determinants of BU metabolism, pharmacokinetic (PK)-based dosing regimens, in which subjects receive a preliminary dose of BU followed by serial level quantitation and calculation of subsequent doses to be given to target a goal cumulative BU plasma exposure, have been commonly adopted in pediatric transplants.7,23–25
Clinical trials to treat ADA SCID via GT have previously involved low intensity (i.e. non-myeloablative cytoreduction) conditioning with BU monotherapy for partial cytoreduction to facilitate engraftment of the gene-modified autologous HSPC. In these studies, BU conditioning improved engraftment of HSPC and resulted in multi-lineage gene-modified cells, compared with trials that used no conditioning.3,5,26 BU has been an attractive single agent given its efficacious destruction of hematopoietic stem and progenitors and minimal immuno-ablation at cytoreductive doses.27 However, standardized single dosing regimens to attain a target AUC have proven elusive.
The present study examined factors potentially influencing BU clearance and the association of BU AUC on the level of engraftment of gene-modified cells in infants and children receiving non-myeloablative BU before GT to treat ADA SCID. Subjects were conditioned in three successive cohorts using BU dosing based on (1) body-surface area (BSA) (n=10), (2) actual body weight (ABW) (n=20) and (3) therapeutic drug monitoring with dose adjustment using first-dose pharmacokinetic measurements (TDM) (n=10). In addition to assessing the value of these different dosing strategies to achieve consistent exposure to BU, we assessed potential clinical and genetic biomarkers to predict BU dosing. We conclude that therapeutic drug monitoring with pharmacokinetic-based adjustment is necessary to achieve consistent BU exposure and the only biomarker that was reliably predictive of BU clearance was age in subjects under 18 months old.
Materials and Methods
Subject selection.
From 2008 to 2019, subjects in three successive early phase clinical trials of GT for ADA SCID received autologous transplant with ADA gene-modified CD34+ HSPC. All subjects received BU for conditioning with pharmacokinetic monitoring of BU levels as a component of all three studies. For this analysis, the data were retrospectively collected from the subjects enrolled in these three trials.
Subjects underwent autologous gene-modified stem cell transplant with reduced intensity BU conditioning as part of three successive study protocols (1) “MND-ADA Transduction of CD34+ Cells from Children With ADA SCID” (ClinicalTrials.gov ID: NCT00794508), (2) “Autologous Transplant of EFS-ADA Modified Bone Marrow Cells for ADA-Deficient Severe Combined Immunodeficiency (SCID)” (ClinicalTrials.gov ID: NCT01852071) or (3) “Autologous Cryopreserved CD34+ Hematopoietic Cells Transduced With EFS-ADA Lentivirus for ADA SCID” (ClinicalTrials.gov ID: NCT02999984). The first trial involved GT with a γ-retroviral (γ-RV) vector (MND-ADA) under FDA IND# BB8556, while the latter two trials utilized a LV (EFS-ADA) under FDA IND# BB15440. The trials received approval by the Institutional Review Boards and Institutional Biosafety Committees at UCLA and the National Human Genome Research Institute (NHGRI), NIH and were reviewed by the NIH Office of Biotechnology Activities, Recombinant DNA Advisory Committee (protocols 9908-337 and 0910-1006). All legal guardians gave written informed consent for participants, all of whom were minors at the time of the study. The NHLBI Gene and Cell Therapy Data Safety Monitoring Board oversaw the clinical trials.
Similar major eligibility criteria were applied for the three studies and included proven demonstration of ADA deficiency, lack of a suitable matched sibling donor, laboratory evidence of adequate organ function, and expected survival greater than six months due to general health status. In addition, exclusion criteria included prior exposure to BU, active opportunistic infections, severe neurologic, cardiac, or other major congenital abnormalities, history of uncontrolled seizure disorder, severe intractable diarrhea, and known active malignant disease (excluding dermatofibrosarcoma protuberans).
Chart review.
Retrospective chart reviews were conducted to examine additional factors with a potential influence on BU AUC; these factors included concomitant medication administration, hospitalization complications, and clinical laboratory data.
Cells.
All subjects underwent bone marrow harvest from the posterior iliac crest as previously described.28 In the cohort of subjects receiving cells transduced with the γ-RV vector (BSA cohort), subjects underwent bone marrow harvest on day -5 prior to transplant; subjects receiving fresh cells transduced ex vivo with the LV (ABW cohort) underwent bone marrow harvest on day -2; and those receiving cryopreserved cells transduced ex vivo with the LV (TDM cohort) had bone marrow harvested 1-3 months prior to cell infusion, followed by transduction, cryopreservation and storage of the final drug product prior to bedside thawing and infusion (Figure 1).
Figure 1. Timeline for the different treatment cohorts.
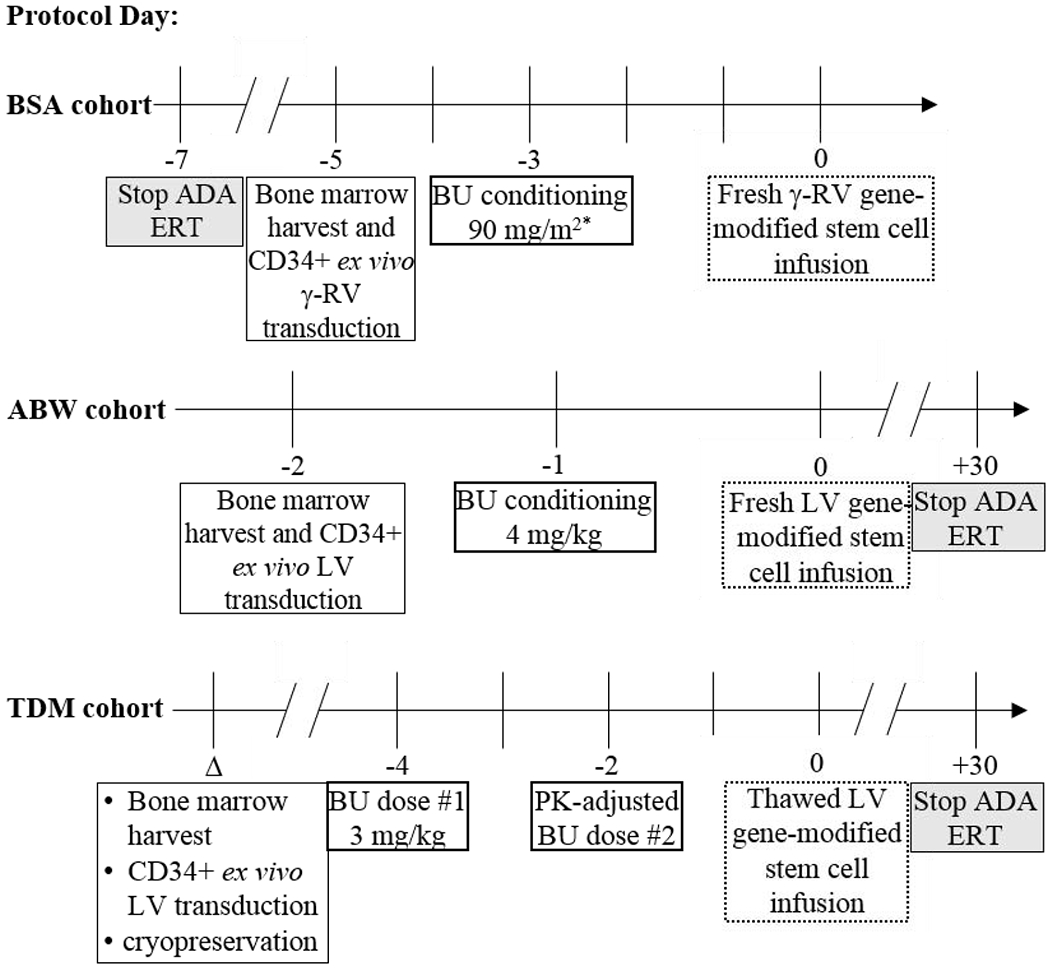
The different cohorts underwent bone marrow harvest, BU conditioning, and gene-modified stem cell infusion at different time points. Note that day 0 marks the day of gene-modified CD34+ cell infusion for all subjects.
*One subject received 2 doses of 45 mg/m2 BU separated by six hours, while the remaining subjects in this cohort received a single 90 mg/m2 BU dose.
Δ = variable date
Vectors.
The MMLV-based MND-ADA γ-RV vector was prepared as previously described,28,29 and was used in the manufacture of the drug product treating the BSA cohort. The EFS-ADA LV was used in the manufacture of the drug product treating the ABW and TDM cohorts.30
CD34+ HSPC ex vivo transduction and characterization.
As previously described, bone marrow harvest specimens were enriched for mononuclear cells followed by CD34+ cell isolation.28 Pre-stimulation of the CD34+ cells followed by viral transduction and maintenance of the cell product in culture were performed as previously described.28,30 After completion of the culture period, cells were harvested, washed, and suspended in Plasma-Lyte with 1% human serum albumin prior to immediate infusion (BSA and ABW cohorts) or cryopreserved for later administration (TDM cohort). Fresh and cryopreserved cell products were required to meet the same release criteria.28
Busulfan dosing cohorts.
As shown in Figure 1, the BSA cohort (n=10) received body surface area (BSA)-dosed BU of 90 mg/m2 as a single intravenous (IV) dose over 2 hours 04:00-06:00 on day -3 with day 0 being the day of gene-modified stem cell infusion. Of note, BSA was calculated by the Mosteller method using actual body weights of the subjects. One subject, based on larger weight at the time of GT, received BU as two 45 mg/m2 doses separated by 6 hours. The ABW cohort (n=20) received actual body weight (ABW)-based dosed BU of 4 mg/kg, administered as a single IV dose over 3 hours 00:00-03:00 on day -1 with GT infusion at least 24 hours later on day 0. One subject from this cohort received a two-hour BU infusion. The TDM cohort (n=10) received BU divided into two 3-hour doses, two days apart with each dose run 11:00-14:00. These subjects received a first dose of 3 mg/kg BU over 3 hours followed by AUC quantitation and calculation of the required additional dose to be given as another 3-hour infusion 48 hours following initial dosing (i.e. day -2) to target cumulative BU AUC of 20 mg/L × hour (4900 μM × min). This busulfan exposure target was selected based on observations in the initial subjects receiving fixed-dose BU and reaching various AUCs.28,29,31,32 All subjects received prophylactic doses of levetiracetam as part of the conditioning regimen due to the known risk of BU-induced seizures, which can occur at myeloablative BU doses.14,33
Busulfan AUC.
All subjects had serial blood samples drawn after the end of infusion of the BU dose and 1, 2, 4, 8, and 13 hours following infusion completion to measure serum BU levels to assess pharmacokinetic parameters. For the BSA and ABW cohorts receiving a single dose of BU, the BU levels were obtained after treatment and only provide post hoc information. With the TDM dosing cohort, serial blood samples were obtained after completion of the first BU dose with quantitation of levels used to predict the second dose needed to achieve the target AUC (20 mg/L × hour). BU levels were also measured after the second dose and used to calculate the cumulative BU AUC from the two doses. BU concentrations in the serum samples were quantitated at Children’s Hospital Los Angeles, Department of Laboratory and Pathology (n=35) or at the Mayo Clinic Laboratories (n=4, 3 from the BSA cohort and 1 from the ABW cohort). Busulfan AUC was determined by non-compartmental analysis using the linear trapezoidal method for linear interpolation between data points with reference to the time from the start of BU infusion through the time extrapolated to infinity using Phoenix 8.1 modeling software (Certara, Princeton, NJ).
BU clearance was determined by the following formula:
The molecular weight for BU of 246.304 g/mole was used in these calculations. For the clearance analysis, the TDM cohort measurements reflected the results of the first dose (weight-based 3 mg/kg) BU measurements, while the clearance calculations for the two other cohorts utilized their single dose measurements.
Concomitant medication analysis.
Fluconazole and co-trimoxazole use was considered to be concomitant with BU, if the medication dosing(s) occurred within four half-lives (t1/2) preceding or following BU administration. The fluconazole t1/2=30 hours,34 and 4 × t1/2=5 days, while co-trimoxazole t1/2=10 hours,35 and 4 × t1/2≈2 days.
Quantification of VCN in peripheral blood.
Serial peripheral blood samples were obtained from subjects after GT infusion to monitor engraftment levels of ADA gene-modified CD34+ cells, using the VCN in peripheral blood granulocytes as a surrogate for HSPC gene marking. Heparinized peripheral blood was separated by Ficoll-Hypaque gradient; the granulocyte/RBC pellets were collected, RBCs lysed, lymphocyte-depleted with immunomagnetic beads against CD3, CD19 and CD56, and genomic DNA extracted (ThermoFisher), with Digital Droplet PCR (ddPCR, Bio-Rad) employed to quantify granulocyte VCN. Lymphocyte-depleted, gene-marked granulocyte levels measured six or more months after cell infusion were considered indicative of engrafted gene-modified CD34+ HSPCs. Granulocyte gene-marking rates were used instead of peripheral blood mononuclear cell (PBMC) marking, as granulocytes do not require the ADA enzyme, while PBMC require functional ADA activity for survival lymphocytes within the PBMC fraction selectively accumulate gene-marked cells. For each subject, the median VCN was calculated from samples collected 6-24 months after GT infusion, with the exception for subjects 402-404, whose lineage depleted granulocyte samples were obtained from samples up to 48 months after GT.
GST isoenzyme genetic analysis.
Genomic DNA extracted from blood samples collected from twenty-eight of the subjects was amplified via PCR. For GSTA1, single nucleotide polymorphisms (SNPs) at positions -69, -513, -631, and -1142 were detected. These positions correspond to various promoter haplotypes that have previously been shown to affect the promoter activity, and genotyping was performed by allele-specific oligonucleotide (ASO) hybridization with probes as previously described.8,15 Allele nomenclature based on polymorphic position and registered SNP ID information are shown in Supplemental Table S1.8 GSTM1 and GSTT1 gene deletions were determined by absence of predicted PCR amplicon generation as detected by gel electrophoresis as previously described.36–39
Statistical Analysis.
GraphPad Prism 7 software was utilized to perform statistical analysis via linear regression, student’s t-test, one-way ANOVA, and Fisher’s exact test, as appropriate. Feltz & Miller asymptotic testing to assess the equality of coefficients of variation in groups was calculated as described using the R software environment.40 In all statistical testings, significance assessments were 2-tailed with a statistically significant P value threshold of 0.05. Unless otherwise specified, all dot plots include horizontal bars representing the mean and standard deviation of the data.
Results
Subjects
Forty subjects with ADA SCID were studied (Table 1). Initial diagnosis occurred upon biochemical or genetic testing revealing ADA deficiency. Nearly 12% of the subjects had in utero or at-birth samples procured, given family histories of ADA SCID, 54% of the subjects were diagnosed on newborn screening (NBS), 27% of the subjects were diagnosed based on clinical suspicion within the first year of life, and 7% of the subjects were diagnosed at greater than one year of life. Enzyme replacement therapy (ERT) was initiated shortly after diagnosis in all cases with subsequent discontinuation as part of the GT trial protocols. Subjects were also regularly receiving replacement doses of immunoglobulin prior to therapy.
Table 1.
Subject characteristics
| Gender | |
| Male | 17 |
| Female | 23 |
| Age at diagnosis | |
| <1 month of age | 27 |
| 1 month – 12 months of age | 10 |
| ≥12 months of age | 3 |
| Method of diagnosis | |
| Directed testing prenatally/at birth with family history | 5 |
| Newborn Screening | 22 |
| Immune function testing given clinical suspicion | 13 |
| Age at BU dose | |
| 3 – 11.9 months of age | 25 |
| ≥12 months of age | 15 |
| BU dosing cohorts | |
| Body-surface area (BSA) based | 10 |
| Actual body weight (ABW) based | 20 |
| Therapeutic drug monitoring (TDM) cohort | 10 |
BU conditioning
To promote improved engraftment, all subjects received intravenous BU as a single agent for reduced-intensity, non-myeloablative conditioning prior to infusion of the gene-modified autologous CD34+ HSPCs. BU was administered based on different pharmacological protocols in three successive cohorts, as detailed in Methods. The subjects in the BSA and ABW cohorts received fresh cells at the completion of the transduction protocol, which did not allow time for measuring PK and giving a second actual dose. In contrast, the subjects in the TDM cohort received a cryopreserved drug product that did allow PK-based BU dose adjustments to be performed, followed by thawing and administration of the drug product.
BU AUCs Measured
The mean and median AUCs (units: mg/L × hour) for each of the three cohorts were: BSA: 18.8 and 22.3, ABW: 16.9 and 16.4, and TDM: 19.4 and 18.9, respectively. The AUC ranges were: BSA: 8.8-27.5, ABW: 9.9-23.7, and TDM: 16.9-22.7. The cumulative BU AUC (i.e., AUC after 1 or 2 BU doses) did not differ among the three cohorts (r2=0.07, P=0.27) based on analysis of variance (ANOVA).
Coefficients of variation (CoV) for the cumulative BU AUC were calculated for the three cohorts through Feltz and Miller asymptotic testing (Figure 2).38 The CoV of the cumulative AUCs of the TDM cohort (11.6%) differed significantly from those of the BSA-based cohort (33.3%) (P<0.01). although the CoV did not quite reach statistical significance with respect to the ABW-based cohort (22.4%) (P=0.05), while the CoVs of the BSA-based and ABW-based cohorts did not differ in a statistically significant manner (P=0.18). In addition, the CoV of the first fixed dose AUC for the TDM cohort (22.7%) did not differ significantly from the fixed dose of the ABW-based cohort (P=0.97). First dose AUC levels for each of the 10 TDM subjects are shown in Supplemental Figure S1 along with the second dose AUC and the resultant cumulative AUC.
Figure 2. Busulfan (BU) AUC achieved from various dosing modalities.
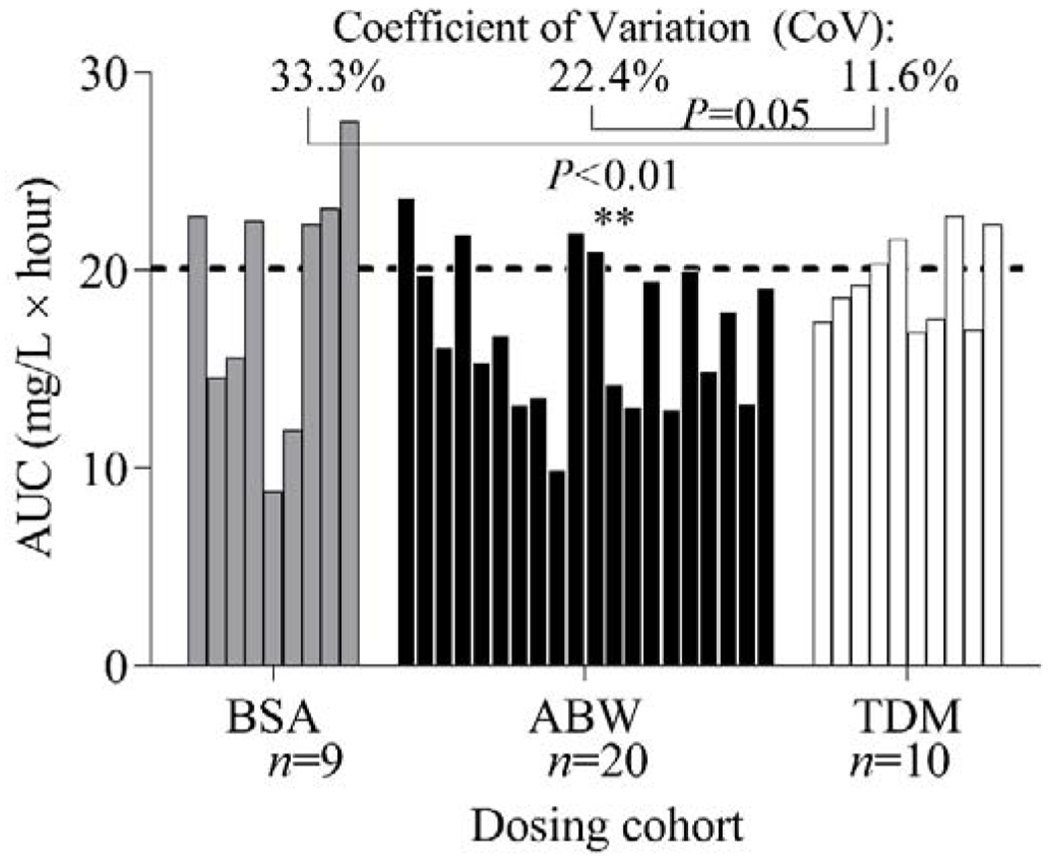
The dosing cohorts included body surface area (BSA), actual body weight (ABW), and therapeutic drug monitoring (TDM) modalities. The three dosing cohorts and the resulting AUC (cumulative AUC in the TDM cohort) per subject. The dashed line represents the target AUC of 20 mg/L × hour used in the TDM cohort. The Feltz & Miller asymptotic testing method was used to assess the significance of differences in variation in groups.
To determine whether BSA or ABW-based BU dose determination provides a better prediction of AUC, BSA-normalized doses were calculated from the administered BU dose and the computed BSA for all subjects of all cohorts. The extrapolated BSA-based dosing did not correlate with AUCs in a statistically significant fashion (r2=0.04, P=0.24). Similarly, ABW-normalized doses were calculated from all the administered doses, based on the subjects’ weights; the correlation between the ABW-normalized dose and AUC did achieve strong statistical significance (r2=0.27, P<0.01). However, there was a wide range of BU AUCs achieved, even at similar BU doses based on ABW.
Factors associated with BU exposure and clearance
Various clinical and genetic factors that may influence BU pharmacokinetics and resultant AUC were analyzed. BU AUC did not vary with gender (Supplemental Figure S2). When analyzing BU clearance related to subject age (Figure 3), there was no significant relationship between age and BU clearance when all ages were analyzed (r2=0.00, P=0.67). However, there was a strongly significant positive correlation between age and the BU clearance for children ages 3-18 months (r2=0.48, P<0.01).
Figure 3. Busulfan (BU) clearance versus age at transplant.
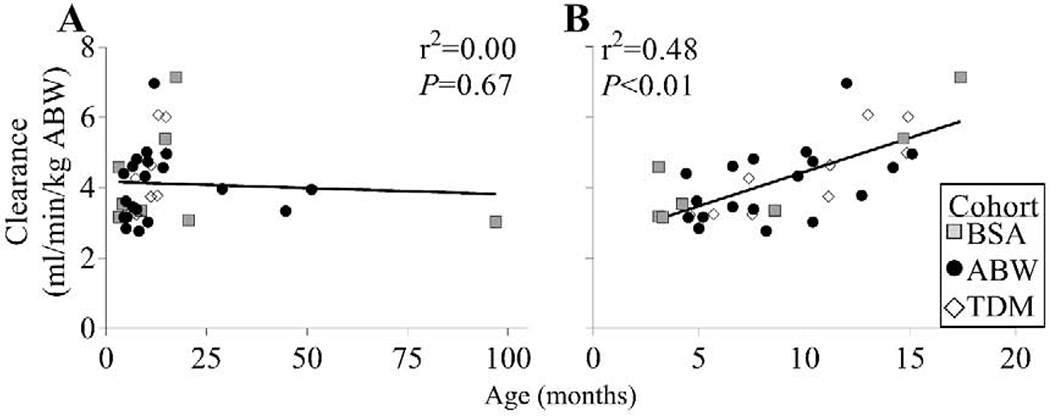
Age and BU clearance were evaluated across (A) all subjects and (B) subjects ≤18 months of age.
The effects of concomitant medication administration on the resultant BU clearance were explored in medications with known interactions with the cytochrome P450 system (Supplemental Figure S3). Fluconazole use within four half-lives preceding or following BU administration was not significantly associated with BU clearance (r2=0.07, P=0.09). Concomitant treatment with co-trimoxazole within four half-lives preceding or following BU administration was significantly associated with a modestly higher BU clearance (r2=0.11, P=0.04).
Untreated ADA deficiency has been associated with elevated hepatic transaminases, which can also occur in the setting of withdrawal of polyethylene glycol-conjugated ADA (PEG-ADA) ERT.41–43 As in the initial ADA SCID trial using BU, subjects in the BSA cohort ceased PEG-ADA ERT use 1-2 weeks prior to bone marrow harvest and BU administration.44 In contrast, in the ABW and TDM cohorts, PEG-ADA ERT was continued through one month post-GT, based on findings in the ADA knock-out mouse model indicating that therapy supported better reconstitution.45 Comparison of BU clearances between subjects showed no significant correlation between extended ERT and BU clearance (r2=0.00, P=0.83).
Impact of Busulfan dosing on cytoreduction and liver function
As previously noted, low-dose BU has been associated with transient neutropenia, thrombocytopenia, and occasional mild transaminitis.28,29,31,46 Of note, all 40 subjects experienced neutropenia (ANC<1,500/mm3) at their nadir; 24 subjects (60.0%) had severe neutropenia (ANC<500/mm3), 13 subjects (32.5%) had moderate neutropenia (ANC 500-1,000/mm3), and 3 subjects (7.5%) had mild neutropenia (ANC 1,000-1,500/mm3). While higher cumulative BU AUC trended toward a more marked neutropenia nadir, this relationship was not significant (r2=0.09, P=0.06) (Figure 4A). In contrast, 24/40 subjects (60.0%) experienced thrombocytopenia with no correlation between BU AUC and the degree of thrombocytopenia (r2=0.01, P=0.57) (Figure 4B).
Figure 4. Absolute Neutrophil Count (ANC) and Platelet Nadirs.
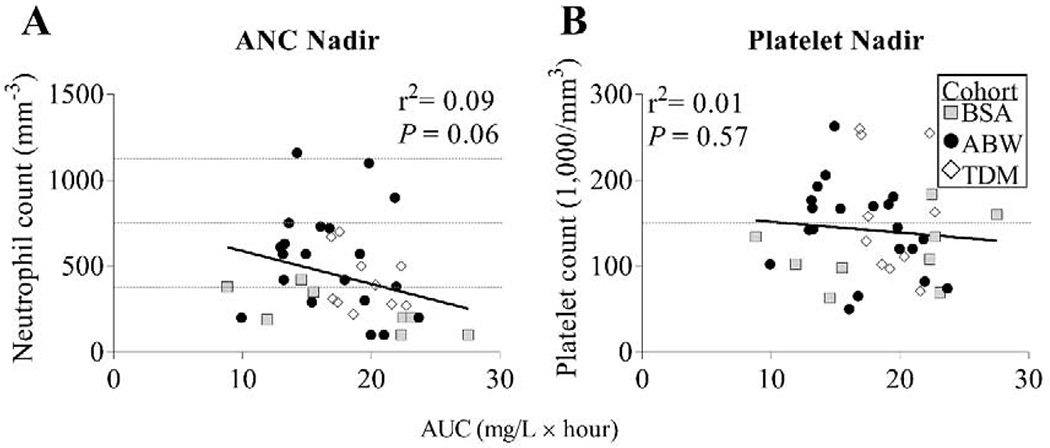
The nadir values of (A) ANC and (B) platelet counts measured after BU administration for each subject are shown versus the cumulative BU AUC. Dashed gray line(s) in (A) depict reference values for severe neutropenia (ANC <500/mm3), moderate neutropenia (ANC 500-999/mm3), and mild neutropenia (ANC 1000-1500/mm3), and in (B) depict reference value for thrombocytopenia (platelet count <150,000/mm3).
Regarding the subsequent hepatic complications following BU administration, no clinically significant hepatotoxicity occurred, such as hyperbilirubinemia or sinusoidal obstruction syndrome. Eleven subjects (27.5%) developed alanine transaminase (ALT) levels above the published age-based normal limits in the 1-2 months after BU treatment, while 23 subjects (57.5%) developed a transiently elevated aspartate transaminase (AST) level in reference to age norms, but these lab results were not significantly correlated with prior BU AUC.47 The peak ALT and AST levels each occurred a mean of 35 days following BU infusion. Grade II ALT elevation was seen in 5 subjects (12.8%), and notably 4 of these subjects were in the BSA cohort (i.e. 44.4% of the BSA cohort compared with 5% of the ABW cohort and 0% of the TDM cohort) (Supplemental Figure S4). Of note, 4 of the 5 subjects with the highest transaminase peaks (>100 IU/L), did not have high BU AUC. None of the subjects had transaminase levels that required intervention, and all ALT and AST abnormalities self-resolved.
Genetic analysis of glutathione S-transferase (GST) isoenzymes
No single GSTA1 allele was associated with altered BU clearance except for the presence of GSTA1*B alleles (n=15, r2=0.18, P=0.03), which were associated with reduced BU clearance compared with all other GSTA1 allele types (Table 2 and Figure 5). For these calculations, the BU clearance for the TDM cohort was determined from only the first dose (weight-based) BU measurements rather than a composite of the clearance calculated from both the first and second dose measurements. BU clearance did not vary with GSTT1 wild-type (WT) or null status, though BU clearance was significantly higher in GSTM1 null subjects compared with WT (r2=0.25, P<0.01) (Figure 5B).
Table 2.
Glutathione-S-Transferase (GST) genotypes
| n (%) | |
|---|---|
| GSTA1 | |
| *AA | 13 (46.4) |
| *BB | 3 (10.7) |
| *AB | 12 (42.9) |
| GSTM1 | |
| Wild-type | 16 (57.1) |
| Null | 12 (42.9) |
| GSTT1 | |
| Wild-type | 25 (89.3) |
| Null | 3 (10.7) |
Figure 5. Busulfan (BU) clearance versus Glutathione-S-Transferase (GST) genetic analysis.
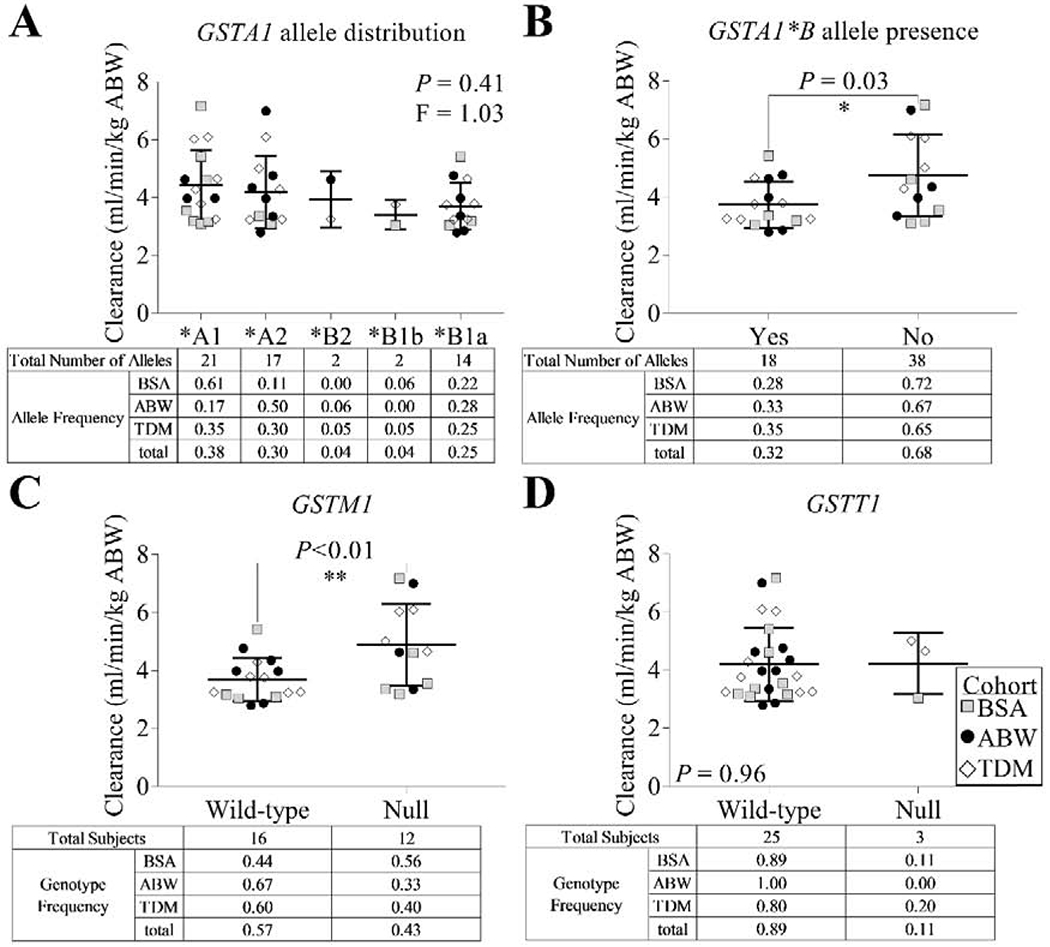
BU clearance using actual body weight (ABW) was analyzed with respect to (A) GSTA1 allele, (B) presence of the GSTA1*B allele, (C) GSTM1 genotype, and (D) GSTT1 genotype. Note that for (A) and (B), allele frequencies reflect true allele representation in the study population.
Factors associated with engraftment of gene-marked cells
A direct comparison of median granulocyte VCN over 6-24 months after cell infusion demonstrated significantly higher VCN in the recipients of LV-modified HSPC grafts (ABW and TDM cohorts) compared with the recipients of γ-RV-modified grafts (BSA cohort) (Figure 6A, P<0.01). BU AUC versus median granulocyte VCN did not show a significant relationship by linear regression (r2=0.05, P=0.18) across all subjects, and no significant correlation between BU AUC and median granulocyte VCN was observed within either the recipients of γ-RV- or LV-modified grafts (P=0.15 and P=0.08, respectively, Figure 6B). In addition, Partial Pearson correlation between AUC and median granulocyte VCN controlled for the effects of two covariates, CD34+ cells/kg and CD34+ VCN, did not achieve statistical significance for the entire group of subjects (n=38, P=0.16). Notably, this analysis was statistically significant within the γ-RV-treated subjects (n=9, P=0.03). For the LV-treated subjects, this analysis did not find a significant relationship (n=29, P=0.17); however, when a single outlying subject with markedly low BU AUC and high median granulocyte VCN was excluded, there was a significant relationship between BU AUC and median granulocyte VCN (n=28, P=0.03). One subject from the TDM cohort did not engraft within the first six months, so ERT was resumed until the patient was able to successfully undergo allogeneic HSCT.
Figure 6. Median granulocyte vector copy number (VCN).
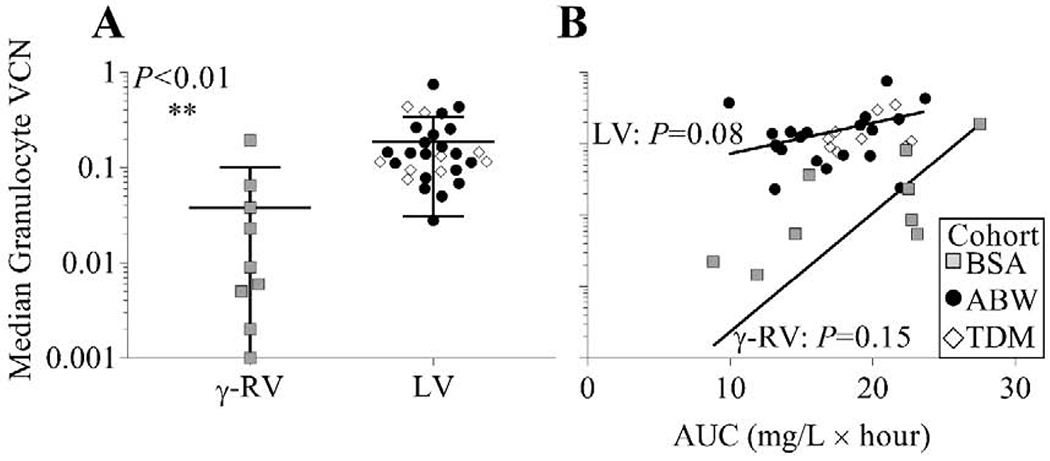
(A) Median granulocyte VCN over 6-24 months after cell infusion (±standard deviation) comparing the recipients of the γ-RV-modified HSPC graft (BSA cohort) and the recipients of the LV-modified HSPC graft (ABW and TDM cohorts). (B) Median granulocyte VCN versus BU AUC shown for the recipients of γ-RV- or LV-modified grafts.
Discussion
In this report of busulfan pharmacokinetics in ADA SCID subjects undergoing reduced intensity conditioning for GT, our most significant findings were: (a) there was large inter-subject variation in BU clearance and hence exposure, (b) we did not identify useful clinical or genetic factors predicting BU clearance that would support personalized fixed dosing, (c) BU clearance did correlate with age in infants <1.5 years of age but was still markedly variable, (d) a therapeutic drug monitoring-based approach led to more consistent BU exposure than fixed dosing, (e) there were not significant correlations between BU AUC and the degree of myelosuppression, (f) when controlled for the varying numbers of infused gene-modified HSPC, the net BU exposure correlated with the eventual level of engrafted gene-modified HSPC, a key index of GT effectiveness, within a vector group (γ-RV vs. LV), with significantly higher levels of granulocyte VCN in the recipients of LV-modified grafts compared to γ-RV transduced grafts.
Despite the relative small age range of the subjects and the common factor of ADA-deficiency, there was large inter-subject variation in BU clearance. For the subjects who received BU as a single, fixed dose (the BSA and ABW cohorts), the range of AUCs varied 2.1-fold (range: 8.8-27.5 mg/L × hour). TDM-based dosing supported a more predictable BU AUC, as reflected by a smaller CoV, although some variability remained (range: 16.9-22.7 μM × min; variation: 0.34-fold). Of note, the cohorts received their infusions at different times of the day (see Methods), and prior work has demonstrated diurnal variation in BU with elevated plasma levels measured during the night time relative to that measured during the daytime in protocols involving four-days of dosing every six hours.48
We reviewed clinical features of the subjects looking for factors that predict their BU clearance, but did not find consistent predictive factors. Included in this list of clinical variables that were not predictive of BU clearance were concomitant use of trimethoprim-sulfamethoxazole, fluconazole, or ERT as well as a robust relationship with a specific GST polymorphism. Subject age did correlate with BU clearances rates in infants in that BU clearance increased as subject age increased from three to eighteen months. Clearance of BU reaches 95% of adult values at 2.5 postnatal years; the majority of our subjects were below this age (36 of the 40).6 However, even within this age group there was inter-subject variability in clearance that was too high to allow designation of a single BU dose to administer that would consistently achieve a target AUC.
The analysis of AUC versus age was particularly noteworthy, as this study included immune deficient subjects predominantly younger than 18 months old, which has been a minimally analyzed group with respect to BU pharmacokinetics in the literature. Of note, prior work has analyzed this age group (n>200) outside of the primary immune deficiency and GT settings.6 When the subjects younger than eighteen months of age were further analyzed, it became apparent that BU clearance increased sharply with age, consistent with prior analysis of subjects in this age group.6 The decrease in AUC during this time is likely due to increasing liver maturation and expression of GST enzymes with greater clearance of BU as well as the development of metabolic pathways with maturation.7
In addition, due to the different allometric composition of infants and toddlers compared with older children and adults, prior groups have reported the use of upfront normal fat mass dosing for more accurate clearance calculations and improved TDM dosing to reach a target AUC.6 The present TDM dosing strategy employed an upfront ABW dose to achieve a non-myeloablative AUC.
BU dosing to achieve a target BU AUC may be challenging when it is used as conditioning for GT. The timing of harvesting and modifying the autologous cell product with minimal ex vivo time must be coordinated with the timing of the BU administration. This can be especially difficult for GT centers that rely on outside laboratories to measure BU levels. Thus, it is ideal to be able to accurately predict BU doses to achieve the target AUC before BU is administered.
For the latest of the trials, the use of a cryopreserved formulation of the GT product avoided the time pressure that occurs using a fresh drug product that needs to be re-administered as soon as transduction is completed. With the cryopreserved drug product, the BU dosing could be split into two administrations and pharmacokinetic blood sampling and BU dose personalization performed to approach a specific targeted BU exposure.
Various approaches are being evaluated to predict the personalized BU dose to achieve a target AUC before BU administration: 1. test dose; 2. pharmacogenomics; 3. pharmacometabolomics. The ASBMT Guideline committee recently stated that test doses of BU are not recommended for estimating BU clearance.22 GST isoenzymes may play a role in BU metabolism, especially with regard to presence of a GSTA1*B allele or presence or absence of GSTM1, potentially allowing pharmacogenomic-guided BU dosing.12,15,17–20,49 We analyzed GST variations in our population of infants and young toddlers, but did not find predictive factors, though the rapid acceleration of liver maturation from infancy through age 2.5 years, which included the vast majority of the subjects, could have obscured this relationship.
Interestingly, our subjects with a GSTM1-null genotype had an associated lower AUC, which is in contrast to prior reports of either no difference or higher AUC with this allele;17,20,50 however, it is important to note that these studies reporting lower AUC with GSTM1-null genotype included only subjects older than four years of age.15,16 In addition, we observed lower clearance in carriers of the GSTA1*B allele, similar to other studies,8,17,51 even though this population differs from prior cohorts in term of diagnosis, age and treatment, and is limited by sample size. Previous pharmacogenomics studies predominantly considered BU pharmacokinetics in the context of myeloablative regimens, and there is a paucity of literature with regard to GST isoenzyme variants in the setting of non-myeloablative conditioning.
In addition to the variability in BU pharmacokinetics and levels reached, the myelosuppressive effects of BU also were variable. There were not significant correlations between the cumulative BU AUC achieved and the degree of neutropenia or thrombocytopenia.
Furthermore, regarding the BU-induced transaminitis, we reported peak ALT and AST levels both occurred, on average, 35 days following dosing BU administration. This finding, in addition to the lower maximal AST and ALT in the cohorts receiving ERT through day +30 following GT suggests that continued ERT through one month following GT may slightly mitigate this potentially adverse outcome. In addition, there was no evidence of impaired engraftment in the cohorts receiving prolonged ERT. Prior to these trials, GT trials for ADA SCID have generally involved early cessation of ERT with the goal of giving the gene-modified cells a survival advantage over the unmodified cells.29,31,46 Notably, ERT has previously been reported to mitigate the severity of neutropenia in the ADA-SCID population.52 Our results demonstrated the greatest rate of severe neutropenia (ANC<500/mm3) in those subjects with early ERT cessation (90%); this rate was lower in the ABW (45%) and TDM (60%) cohorts. While most of the subjects had moderate neutropenia following BU administration, it was not associated with development of any serious bacterial or fungal infections.
Lastly, implications of varying AUC levels were analyzed with respect to eventual engraftment, as approximated by VCN in granulocytes after six months post-GT. There are many likely contributors to eventual engraftment in GT protocols, and these factors may include subject age, underlying condition being treated, HSPC numbers collected and transduced, transduction methods, ex vivo cell handling, bone marrow stromal health at the time of cell infusion, and overall patient health at the time of cell collection and infusion. For these studies, the difference between the granulocyte VCN between the recipients of HSPC grafts modified by γ-RV vs. LV may partly reflect the use of the less effective γ-RV in the BSA cohort and the better transducing LV in the ABW and TDM cohorts. Median granulocyte VCN, controlled for the effects of two covariates that reflected the dose of gene-modified HSPCs, was significantly correlated with BU AUC for the γ-RV-treated subjects. For the LV-treated subjects, this relationship was significant after exclusion of a subject with an outlying BU clearance. This subject had the highest BU clearance of all subjects analyzed: 6.97 ml/min/kg, which was >2.5 standard deviations greater than the mean of 4.15 ml/min/kg. Despite the subject’s low AUC and low cell dose, high levels of marked granulocyte reflected a strong engraftment. With the exclusion of this subject, median granulocyte VCN and AUC were significantly correlated within the LV-treated subjects. Other aspects of the different GT trials, including bone marrow harvest techniques, cell processing, and transduction methods likely contribute to variation in engraftment between subjects but were not directly compared in this study.
The evidence supports a first weight-based dose with TDM-based dosing of the second dose to attain target AUC. The optimal target BU AUC for subjects undergoing GT with various primary immune deficiencies requires further study. The results reported here demonstrate the importance of TDM for more precise dosing of BU in GT for ADA SCID.
Supplementary Material
Highlights.
Low dose busulfan can open the bone marrow niche in the setting of gene therapy.
BSA and weight-based dosing resulted in variable busulfan plasma exposure.
Therapeutic drug monitoring-based dosing resulted in consistent plasma exposure.
Busulfan clearance increased as subject age increased from birth to 18 months.
Acknowledgements
This work was supported by research grants from the Doris Duke Charitable Foundation (Distinguished Clinical Scientist Award to D.B.K.), the Food and Drug Administration Office of Orphan Product Development (RO1 FD003005), the National Institutes of Health (UO1 AI100801, N01 HV78204, 5P40HL116242), the NHGRI Intramural Program, the California Institute for Regenerative Medicine (CIRM CLIN2 09339, FA1-00613, and CL1-00505), Orchard Therapeutics, a training grant from the Hematology Opportunities for the Next Generation of Research Scientists (HONORS), funded by the American Society of Hematology (K.L.B.), as well as a T32 training grant in Developmental Hematology through the National Institutes of Health (K.L.B.). We would like to thank Dr. Jeannine McCune from the Departments of Population Science and Hematology & Hematopoietic Cell Transplantation at the City of Hope/Beckman Research Institute for her valuable contributions to the editing of this work.
Financial Disclosure Statement
D.B.K. is a member of the Scientific Advisory Board of Orchard Therapeutics and HB Gaspar is the Chief Executive Officer of Orchard Therapeutics, which is developing a commercial lentiviral vector gene therapy product.
Abbreviations
- ABW
actual body weight
- ADA
adenosine deaminase
- AUC
area under the curve
- BU
busulfan
- CoV
coefficient of variation
- EFS
shortened intron-less EF1 alpha
- ERT
enzyme replacement therapy
- γ-RV
γ-retrovirus
- GT
gene therapy
- HSCT
hematopoietic stem cell transplant
- HSPC
hematopoietic stem and progenitor cell
- LV
lentivirus
- NBS
newborn screen
- PBMC
peripheral blood mononuclear cell
- PEG-ADA
polyethylene glycol-conjugated adenosine deaminase
- SCID
severe combined immunodeficiency
- t½
half-life
- TDM
therapeutic drug monitoring
- VCN
vector copy number
- WPRE
Woodchuck Hepatitis Virus Posttranscriptional Regulatory Element
- WT
wild-type
Footnotes
Publisher's Disclaimer: This is a PDF file of an unedited manuscript that has been accepted for publication. As a service to our customers we are providing this early version of the manuscript. The manuscript will undergo copyediting, typesetting, and review of the resulting proof before it is published in its final form. Please note that during the production process errors may be discovered which could affect the content, and all legal disclaimers that apply to the journal pertain.
References
- 1.Iwamoto T, Hiraku Y, Oikawa S, Mizutani H, Kojima M, Kawanishi S. DNA intrastrand cross-link at the 5′-GA-3′ sequence formed by busulfan and its role in the cytotoxic effect. Cancer Science. 2004;95(5):454–458. [DOI] [PMC free article] [PubMed] [Google Scholar]
- 2.Bartelink IH, Lalmohamed A, van Reij EML, et al. Association of busulfan exposure with survival and toxicity after haemopoietic cell transplantation in children and young adults: a multicentre, retrospective cohort analysis. The Lancet Haematology. 2016;3(11):e526–e536. [DOI] [PMC free article] [PubMed] [Google Scholar]
- 3.Kahl CA, Tarantal AF, Lee CI, et al. Effects of busulfan dose escalation on engraftment of infant rhesus monkey hematopoietic stem cells after gene marking by a lentiviral vector. Experimental Hematology. 2006;34(3):369–381. [DOI] [PubMed] [Google Scholar]
- 4.Tarantal AF, Giannoni F, I Lee CC, et al. Nonmyeloablative Conditioning Regimen to Increase Engraftment of Gene-modified Hematopoietic Stem Cells in Young Rhesus Monkeys. Molecular Therapy. 2012;20(5):1033–1045. [DOI] [PMC free article] [PubMed] [Google Scholar]
- 5.Mamcarz E, Zhou S, Lockey T, et al. Lentiviral Gene Therapy Combined with Low-Dose Busulfan in Infants with SCID-X1. New England Journal of Medicine. 2019;380(16): 1525–1534. [DOI] [PMC free article] [PubMed] [Google Scholar]
- 6.McCune JS, Bemer MJ, Barrett JS, Scott Baker K, Gamis AS, Holford NHG. Busulfan in Infant to Adult Hematopoietic Cell Transplant Recipients: A Population Pharmacokinetic Model for Initial and Bayesian Dose Personalization. Clinical Cancer Research. 2013;20(3):754–763. [DOI] [PMC free article] [PubMed] [Google Scholar]
- 7.Long-Boyle JR, Savic R, Yan S, et al. Population Pharmacokinetics of Busulfan in Pediatric and Young Adult Patients Undergoing Hematopoietic Cell Transplant. Therapeutic Drug Monitoring. 2015;37(2):236–245. [DOI] [PMC free article] [PubMed] [Google Scholar]
- 8.Ansari M, Curtis PH-D, Uppugunduri CRS, et al. GSTA1 diplotypes affect busulfan clearance and toxicity in children undergoing allogeneic hematopoietic stem cell transplantation: a multicenter study. Oncotarget. 2017;8(53). [DOI] [PMC free article] [PubMed] [Google Scholar]
- 9.ten Brink MH, van Bavel T, Swen JJ, et al. Effect of genetic variants GSTA1 and CYP39A1 and age on busulfan clearance in pediatric patients undergoing hematopoietic stem cell transplantation. Pharmacogenomics. 2013; 14(14): 1683–1690. [DOI] [PubMed] [Google Scholar]
- 10.ten Brink MH, Zwaveling J, Swen JJ, Bredius RGM, Lankester AC, Guchelaar HJ. Personalized busulfan and treosulfan conditioning for pediatric stem cell transplantation: the role of pharmacogenetics and pharmacokinetics. Drug Discovery Today. 2014;19(10): 1572–1586. [DOI] [PubMed] [Google Scholar]
- 11.El-Serafi I, Terelius Y, Abedi-Valugerdi M, et al. Flavin-containing monooxygenase 3 (FMO3) role in busulphan metabolic pathway. PLOS ONE. 2017;12(11):e0187294. [DOI] [PMC free article] [PubMed] [Google Scholar]
- 12.Ansari M, Huezo-Diaz P, Rezgui MA, et al. Influence of glutathione S-transferase gene polymorphisms on busulfan pharmacokinetics and outcome of hematopoietic stem-cell transplantation in thalassemia pediatric patients. Bone Marrow Transplant. 2015;51(3):377–383. [DOI] [PMC free article] [PubMed] [Google Scholar]
- 13.Kim AH, Tse JC, Ikeda A, Moore TB. Evaluating pharmacokinetics and pharmacodynamics of intravenous busulfan in pediatric patients receiving bone marrow transplantation. Pediatric Transplantation. 2009; 13(8):971–976. [DOI] [PubMed] [Google Scholar]
- 14.Booth BP, Rahman A, Dagher R, et al. Population Pharmacokinetic-Based Dosing of Intravenous Busulfan in Pediatric Patients. The Journal of Clinical Pharmacology. 2007;47(1): 101–111. [DOI] [PubMed] [Google Scholar]
- 15.Ansari M, Lauzon-Joset JF, Vachon MF, et al. Influence of GST gene polymorphisms on busulfan pharmacokinetics in children. Bone Marrow Transplantation. 2009;45:261. [DOI] [PubMed] [Google Scholar]
- 16.Ansari M, Rezgui MA, Théoret Y, et al. Glutathione S-transferase gene variations influence BU pharmacokinetics and outcome of hematopoietic SCT in pediatric patients. Bone Marrow Transplantation. 2013;48(7):939–946. [DOI] [PubMed] [Google Scholar]
- 17.Kim S-D, Lee J-H, Hur E-H, et al. Influence of GST Gene Polymorphisms on the Clearance of Intravenous Busulfan in Adult Patients Undergoing Hematopoietic Cell Transplantation. Biology of Blood and Marrow Transplantation. 2011;17(8): 1222–1230. [DOI] [PubMed] [Google Scholar]
- 18.ten Brink MΗ, Wessels JA, Hartigh Jd, et al. Effect of genetic polymorphisms in genes encoding GST isoenzymes on BU pharmacokinetics in adult patients undergoing hematopoietic SCT. Bone Marrow Transplantation. 2011;47(2): 190–195. [DOI] [PubMed] [Google Scholar]
- 19.Johnson LA, Orchard PJ, Baker KS, et al. Glutathione S-Transferase A1 Genetic Variants Reduce Busulfan Clearance in Children Undergoing Hematopoietic Cell Transplantation. Journal of clinical pharmacology. 2008;48(9): 1052–1062. [DOI] [PMC free article] [PubMed] [Google Scholar]
- 20.Zwaveling J, Press RR, Bredius RGM, et al. Glutathione S-transferase Polymorphisms Are Not Associated With Population Pharmacokinetic Parameters of Busulfan in Pediatric Patients. Therapeutic Drug Monitoring. 2008;PAP. [DOI] [PubMed] [Google Scholar]
- 21.Huezo-Diaz P, S. Uppugunduri C, Tyagi A, Krajinovic M, Ansari M. Pharmacogenetic Aspects of Drug Metabolizing Enzymes in Busulfan Based Conditioning Prior to Allogenic Hematopoietic Stem Cell Transplantation in Children . Current Drug Metabolism. 2014;15(3):251–264. [DOI] [PubMed] [Google Scholar]
- 22.Palmer J, McCune JS, Perales M-A, et al. Personalizing Busulfan-Based Conditioning: Considerations from the American Society for Blood and Marrow Transplantation Practice Guidelines Committee . Biology of Blood and Marrow Transplantation. 2016;22( 11): 1915–1925. [DOI] [PubMed] [Google Scholar]
- 23.Tran H, Petropoulos D, Worth L, et al. Pharmacokinetics and individualized dose adjustment of intravenous busulfan in children with advanced hematologic malignancies undergoing allogeneic stem cell transplantation. Biology of Blood and Marrow Transplantation. 2004; 10(11):805–812. [DOI] [PubMed] [Google Scholar]
- 24.Tran HT, Madden T, Petropoulos D, et al. Individualizing high-dose oral busulfan: prospective dose adjustment in a pediatric population undergoing allogeneic stem cell transplantation for advanced hematologic malignancies. Bone Marrow Transplantation. 2000;26(5):463–470. [DOI] [PubMed] [Google Scholar]
- 25.Bolinger AM, Zangwill AB, Slattery JT, et al. Target dose adjustment of busulfan in pediatric patients undergoing bone marrow transplantation. Bone Marrow Transplantation. 2001;28:1013. [DOI] [PubMed] [Google Scholar]
- 26.Cavazzana-Calvo M, Fischer A, Hacein-Bey-Abina S, Aiuti A. Gene therapy for primary immunodeficiencies: part 1. Current Opinion in Immunology. 2012;24(5):580–584. [DOI] [PubMed] [Google Scholar]
- 27.Aiuti A, Brigida I, Ferrua F, et al. Hematopoietic stem cell gene therapy for adenosine deaminase deficient-SCID. Immunologic Research. 2009;44(1-3):150–159. [DOI] [PubMed] [Google Scholar]
- 28.Shaw KL, Garabedian E, Mishra S, et al. Clinical efficacy of gene-modified stem cells in adenosine deaminase-deficient immunodeficiency. The Journal of clinical investigation. 2017;127(5):1689–1699. [DOI] [PMC free article] [PubMed] [Google Scholar]
- 29.Candotti F, Shaw KL, Muul L, et al. Gene therapy for adenosine deaminase-deficient severe combined immune deficiency: clinical comparison of retroviral vectors and treatment plans. Blood. 2012;120(18):3635–3646. [DOI] [PMC free article] [PubMed] [Google Scholar]
- 30.Carbonaro DA, Zhang L, Jin X, et al. Preclinical Demonstration of Lentiviral Vector-mediated Correction of Immunological and Metabolic Abnormalities in Models of Adenosine Deaminase Deficiency. Molecidar Therapy. 2014;22(3):607–622. [DOI] [PMC free article] [PubMed] [Google Scholar]
- 31.Gaspar HB, Cooray S, Gilmour KC, et al. Hematopoietic Stem Cell Gene Therapy for Adenosine Deaminase-Deficient Severe Combined Immunodeficiency Leads to Long-Term Immunological Recovery and Metabolic Correction. Science Translational Medicine. 2011;3(97):97ra80–97ra80. [DOI] [PubMed] [Google Scholar]
- 32.Cooper AR, Lill GR, Shaw K, et al. Cytoreductive conditioning intensity predicts clonal diversity in ADA-SCID retroviral gene therapy patients. Blood. 2017;129(19):2624. [DOI] [PMC free article] [PubMed] [Google Scholar]
- 33.Pasquini MC, Le-Rademacher J, Zhu X, et al. Intravenous Busulfan-Based Myeloablative Conditioning Regimens Prior to Hematopoietic Cell Transplantation for Hematologic Malignancies. Biology of blood and marrow transplantation : journal of the American Society for Blood and Marrow Transplantation. 2016;22(8):1424–1430. [DOI] [PMC free article] [PubMed] [Google Scholar]
- 34.DIFLUCAN® (Fluconazole). In. New York, NY: Roerig, a division of Pfizer Inc; 2011. [Google Scholar]
- 35.BACTRIM™ sulfamethoxazole and trimethoprim DS (double strength) tablets and tablets USP [package insert]. In. Philadelphia, PA: Hoffmann-La Roche Inc; 2013. [Google Scholar]
- 36.Lin DX, Tang YM, Peng Q, Lu SX, Ambrosone CB, Kadlubar FF. Susceptibility to esophageal cancer and genetic polymorphisms in glutathione S-transferases Tl, PI, and Ml and cytochrome P450 2E1. Cancer Epidemiology Biomarkers & Prevention. 1998;7(11): 1013. [PubMed] [Google Scholar]
- 37.Zhong S, Wyllie AH, Barnes D, Wolf CR, Spurr NK. Relationship between the GSTM1 genetic polymorphism and susceptibility to bladder, breast and colon cancer. Carcinogenesis. 1993;14(9): 1821–1824. [DOI] [PubMed] [Google Scholar]
- 38.Seidegard J, Vorachek WR, Pero RW, Pearson WR. Hereditary differences in the expression of the human glutathione transferase active on trans-stilbene oxide are due to a gene deletion. Proceedings of the National Academy of Sciences. 1988;85(19):7293–7297. [DOI] [PMC free article] [PubMed] [Google Scholar]
- 39.Pemble S, Schroeder KR, Spencer SR, et al. Human glutathione S-transferase theta (GSTT1): cDNA cloning and the characterization of a genetic polymorphism. Biochemical Journal. 1994;300(1):271–276. [DOI] [PMC free article] [PubMed] [Google Scholar]
- 40.Feltz CJ, Miller GE. An Asymptotic Test for the Equality of Coefficients of Variation from k Populations. Statistics in Medicine. 1996;15(6):647–658. [DOI] [PubMed] [Google Scholar]
- 41.Bollinger ME, Arredondo-Vega FX, Santisteban I, Schwarz K, Hershfield MS, Lederman HM. Hepatic Dysfunction as a Complication of Adenosine Deaminase Deficiency. New England Journal of Medicine. 1996;334(21): 1367–1372. [DOI] [PubMed] [Google Scholar]
- 42.Migchielsen AAJ, Breuer ML, van Roon MA, et al. Adenosine–deaminase–deficient mice die perinatally and exhibit liver–cell degeneration, atelectasis and small intestinal cell death. Nature Genetics 1995;10(3):279–287. [DOI] [PubMed] [Google Scholar]
- 43.Wakamiya M, Blackburn MR, Jurecic R, et al. Disruption of the adenosine deaminase gene causes hepatocellular impairment and perinatal lethality in mice. Proceedings of the National Academy of Sciences. 1995;92(9):3673–3677. [DOI] [PMC free article] [PubMed] [Google Scholar]
- 44.Aiuti A, Slavin S, Aker M, et al. Correction of ADA-SCID by Stem Cell Gene Therapy Combined with Nonmyeloablative Conditioning. Science. 2002;296(5577):2410. [DOI] [PubMed] [Google Scholar]
- 45.Carbonaro DA, Jin X, Wang X, et al. Gene therapy/bone marrow transplantation in ADA-deficient mice: roles of enzyme-replacement therapy and cytoreduction. Blood. 2012; 120(18):3677–3687. [DOI] [PMC free article] [PubMed] [Google Scholar]
- 46.Cicalese MP, Ferrua F, Castagnaro L, et al. Update on the safety and efficacy of retroviral gene therapy for immunodeficiency due to adenosine deaminase deficiency. Blood. 2016;128(1):45–54. [DOI] [PMC free article] [PubMed] [Google Scholar]
- 47.The Harriet Lane Handbook: A Manual for Pediatric House Officers. In: Helen K Hughes Mand Kahl Lauren K., ed. Twenty-first edition ed.: Elsevier, Inc; 2018. [Google Scholar]
- 48.Hassan M, Oberg G, Bekassy AN, et al. Pharmacokinetics of high-dose busulphan in relation to age and chronopharmacology. Cancer Chemotherapy and Pharmacology. 1991. ;28(2):130–134. [DOI] [PubMed] [Google Scholar]
- 49.Abbasi N, Vadnais B, Knutson JA, et al. Pharmacogenetics of Intravenous and Oral Busulfan in Hematopoietic Cell Transplant Recipients. The Journal of Clinical Pharmacology. 2011;51(10):1429–1438. [DOI] [PMC free article] [PubMed] [Google Scholar]
- 50.Bredschneider M, Klein K, Mürdter TE, et al. Genetic polymorphisms of glutathione S-transferase Al, the major glutathione S-transferase in human liver: Consequences for enzyme expression and busulfan conjugation*. Clinical Pharmacology & Therapeutics. 2002;71(6):479–487. [DOI] [PubMed] [Google Scholar]
- 51.Bremer S, Floisand Y, Brinch L, Gedde-Dahl T, Bergan S. Glutathione Transferase Gene Variants Influence Busulfan Pharmacokinetics and Outcome After Myeloablative Conditioning. Therapeutic Drag Monitoring. 2015;37(4):493–500. [DOI] [PMC free article] [PubMed] [Google Scholar]
- 52.Sokolic R, Marie I, Kesserwan C, et al. Myeloid dysplasia and bone marrow hypocellularity in adenosine deaminase-deficient severe combined immune deficiency. Blood. 2011; 118(10):2688–2694. [DOI] [PMC free article] [PubMed] [Google Scholar]
Associated Data
This section collects any data citations, data availability statements, or supplementary materials included in this article.