

Abstract
Alzheimer’s disease (AD) is a neurodegenerative disorder without a cure or prevention to date. Hyperphosphorylated tau forms the neurofibrillary tangles (NFTs) that correlate well with the progression of cognitive impairments. Animal studies demonstrated the pathogenic role of hyperphosphorylated tau. Understanding how abnormal phosphorylation renders a normal tau prone to form toxic fibrils is key to delineating molecular pathology and to developing efficacious drugs for AD. Production of a tau bearing the disease-relevant hyperphosphorylation and molecular characters is a pivotal step. Here we report the preparation and characterization of a recombinant hyperphosphorylated tau (p-tau) with strong relevance to disease. P-tau generated by the PIMAX approach resulted in phosphorylation at multiple epitopes linked to the progression of AD neuropathology. In stark contrast to unmodified tau that required an aggregation inducer, and which had minimal effects on cell functions, p-tau formed inducer-free fibrils that triggered a spike of mitochondrial superoxide, induced apoptosis, and caused cell death at sub-micromolar concentrations. P-tau-induced apoptosis was suppressed by inhibitors for reactive oxygen species. Hyperphosphorylation apparently caused rapid formation of a disease-related conformation. In both aggregation and cytotoxicity, p-tau exhibited seeding activities that converted the unmodified tau into a cytotoxic species with increased propensity for fibrillization. These characters of p-tau are consistent with the emerging view that hyperphosphorylation causes tau to become an aggregation-prone and cytotoxic species that underlies diffusible pathology in AD and other tauopathies. Our results further suggest that p-tau affords a feasible tool for Alzheimer’s disease mechanistic and drug discovery studies.
Keywords: Alzheimer’s disease, tauopathy, hyperphosphorylated tau, neurofibrillary tangle
Introduction
Thirty million people in the world suffer from Alzheimer’s disease (AD). This number is expected to triple by 2050, according to the World Health Organization. While regimens for AD treatment and prevention remain to be developed, tremendous efforts have been devoted to dissecting the mechanisms of pathogenesis. It is hopeful that better understanding of key pathological players will eventually lead to efficacious means to fight this devastating disease.
Major biomarkers for AD include the senile plaques of Aβ peptide precipitates [1], and the neurofibrillary tangles (NFTs) of fibrillar hyperphosphorylated tau protein [2]. The discovery of mutations in the Aβ pathway associated with familial early onset Alzheimer’s disease led to the hypothesis that Aβ is directly responsible for neurodegeneration [3]. However, recurring failures of anti-Aβ drug trials to improve cognition argue strongly against the notion that dementia involves solely Aβ[4]. The interest in developing NFT-centric AD drugs is becoming higher. Unlike senile plaques, the spatiotemporal distribution of NFTs correlates with the advancement of cognitive impairments [5–8]. NFTs consist of fibrils of abnormally phosphorylated tau protein. Tau is a microtubule-binding protein possibly involved in controlling the axonal transport [9], but homozygous tau knockout mice do not show significant neurodevelopmental defects [10]. The physiological function of human tau therefore remains to be fully elucidated. In AD and other neurodegenerative tauopathies, the overall tau abundance and its per-molecule phosphoryl content increase by several fold [11]. At least 46 of the 85 Ser/Thr/Tyr residues of tau have been found to be phosphorylated in AD [12]. GSK-3β (glycogen synthase kinase 3β) and CDK5 (cyclin-dependent kinase 5) are among the prime suspects for tau hyperphosphorylation [13]. Animal studies, in particular intracerebral injection of tau purified from AD or tauopathy brains [14–19], support a pathogenic role of hyperphosphorylated tau even in the absence of Aβ [20].
Tau isolated from the brain may be monomers, soluble oligomers, or insoluble polymeric species [20]. The terminal deposits of NFTs was once thought to overwhelm the functions of the underlying neurons, but accumulating evidence suggests that the pre-tangle, oligomeric hyperphosphorylated tau causes AD pathology in a prion-like fashion [21–24]. The enrichment of a 140 – 170 kDa oligomer was associated with memory loss in transgenic mice [25]. Intermediates of tau aggregation impaired membrane and cell viability, but longer aggregation period reduced the cytotoxicity [26, 27], suggesting that the potency of impairing cellular functions may be defined by the state of tau aggregation. A pore-like structure of tau annular protofibrils was found on the membrane of human tauopathy brain samples [28]. In tissue cultures, hyperphosphorylated tau can be secreted by cells in vesicle-free mechanisms [29, 30]. Exocytosis has also been postulated to be a route by which cytosolic toxic tau species spread from one to another cell [20, 31, 32]. Animal and tissue culture studies showed that pre-tangle aggregates of hyperphosphorylated tau propagated to and damaged neighboring cells [17, 33–36]. Intracerebral injection of AD brain homogenates to mice caused the endogenous tau to form fibrils at distal areas anatomically connected to the injection site [14–16]. A fly model presented many transgenic tau-dependent pathological features without significant accumulation of neurofibrillary tangles [37]. The hypothesis of cytotoxic aggregation intermediates therefore is gaining momentum [38].
If the pre-tangle intermediates are a critical pathogenic factor, studies of the genesis of this species will likely shed light on the development of therapeutic and preventative measures. There have been many such studies. However, most of these works shared one limitation, that is, the nearly exclusive use of unmodified tau lacking altogether the pathological feature of phosphorylation. Unlike hyperphosphorylated tau that aggregates spontaneously [39, 40], unmodified tau relies on an artificial inducer such as heparin or micelles of fatty acids to accelerate fibrillization [41, 42]. The pathophysiological significance of these inducers has not been fully explored. Moreover, heparin-induced tau aggregates presented different biophysical characters from those of hyperphosphorylated tau isolated from the AD brain [43]. Another deficiency of the unmodified tau is its substantially weaker potency in nucleating the aggregation of monomeric tau molecules [43]. These shortcomings of the unmodified tau may have hindered the progression of AD drug discovery targeting NFT genesis [44].
To facilitate mechanistic studies of the molecular mechanisms underlying neurodegeneration of tauopathies, and to enable neurofibrillary tangle-based drug development, we report here the procurement of hyperphosphorylated tau (p-tau) via the use of the PIMAX system (Protein Interaction Modules-Assisted function X) [39]. This p-tau exhibited multiple disease-relevant molecular characters, including disease-relevant phosphorylation, inducer-independent fibrillization, and significant cytotoxicity. Together, these unique characters render this recombinant p-tau an attractive subject for AD drug discovery and disease mechanism studies.
Results
Recombinant hyperphosphorylated tau isoforms produced by PIMAX
A large body of knowledge has been obtained from the studies of recombinant and patient-derived tau. Recombinant tau allows for easy access, but lacks the disease-associated hyperphosphorylation, whereas tau extracted from patients or transgenic animals likely contained interfering post-translational modifications and other biomolecules. We wished to use the recombinant DNA technology for the synthesis of hyperphosphorylated tau to support both mechanistic and drug development research. To this end, we used the PIMAX method [39], in which the heterodimerizing Fos and Jun leucine zipper domains were respectively fused to the GSK-3β kinase and the human 1N4R isoform of tau. Upon bacterial co-expression, Fos-Jun heterodimerization brought GSK-3β and tau to close proximity, resulting in efficient phosphorylation of the latter [39]. Using this approach and protocols designed for p-tau purification (see Materials and Methods), we produced GSK-3β-modified p-tau at a yield of 500 −800 μg per liter of bacterial culture. SDS-PAGE (Fig. 1a) showed significant phosphorylation-dependent mobility shift of p-tau. To map the phosphorylation sites, we used mass spectrometry (MS) on four different batches of 1N4R p-tau, and identified 21 to 32 sites of phosphorylation from each MS attempt (Table 1). Of these residues, 10 were detected in all four MS assays (“4-hitters”), and 6 were positive in 3 out of 4 attempts (“3-hitters”) (Table 2). There were nineteen 1-hitters and seventeen 2-hitters. 3- and 4-hitters were considered high-confidence sites and are shown in Fig. 1b. The disease relevance of p-tau was manifested by two observations. Firstly, there were significant overlaps of the high-confidence sites and phosphoepitopes associated with AD pathology progression. Antibodies against these phosphorylation marks are used for postmortem AD staging [6, 45]. Eight of the 16 high-confidence sites were among these NFT staging markers (last column in Table 2; red underlines in Fig. 1b). Secondly, there was a strong correlation between the high-confidence p-tau phosphorylation and GSK-3β substrates and PHF (paired-helical filaments) phosphorylation (Table 2). Eight out of ten 4-hitters (80%) and five of the six 3-hitters (83%) were known to be phosphorylated by GSK-3β and detectable in PHF [12]. Overall, these independent MS mapping data demonstrated the robust and disease-relevant phosphorylation of tau expressed by the PIMAX system.
Figure 1.

Hyperphosphorylated tau (p-tau) produced by the PIMAX system possesses a disease-relevant phosphorylation pattern. (a) Purified 1N4R tau, p-tau (phosphorylated by GSK-3β) and p-tau bearing Cys-to-Ser mutations were resolved by an 8% SDS-PAGE gel and visualized by Coomassie blue staining. (b) Distribution of high-confidence p-tau phosphorylation sites (i.e., 4- and 3-hitters by MS mapping). The number designation conforms to the 2N4R isoform. N1 and N2 are the two N’ domains subjected to alternative splicing. R1 – R4 are the four microtubules binding repeats. The 1N4R isoform used throughout this study lacks N2 but maintains all four microtubules binding repeats. Bold fonts represent 4-hitters that were detected by four MS analyses. The remainders are 3-hitters. Red underlines indicate phosphoepitopes for neurofibrillary tangle staging according to references [6] and [45].
Table 1.
Summary of PIMAX p-tau phosphorylation sites mapped by four independent mass spectrometry examination. Column 1 shows all serine, threonine, and tyrosine residues of the longest tau isoform, 2N4R. 4- and 3-hitters are in bold. GSK-3β and PHF phosphorylation sites are based on database from [12]. Staging markers for neurofibrillary tangles are from [6, 45].
| Ser/Thr/Tyr | MS #1 | MS #2 | MS #3 | MS #4 | Reported GSK-3β sites | PHF sites | AD staging* | No. of hits | Ser/Thr/Tyr | MS #1 | MS #2 | MS #3 | MS #4 | Reported GSK-3β sites | PHF sites | AD staging* | No. of hits |
|---|---|---|---|---|---|---|---|---|---|---|---|---|---|---|---|---|---|
| T17 | S210 | √ | √ | ||||||||||||||
| Y18 | √ | T212 | + | + | + | √ | √ | √(A) | 3 | ||||||||
| Y29 | + | 1 | S214 | + | √ | √ | √(A) | 1 | |||||||||
| T30 | + | 1 | T217 | + | + | + | + | √ | 4 | ||||||||
| T39 | + | 1 | T220 | + | √ | √ | 1 | ||||||||||
| S46 | + | + | √ | √ | 2 | T231 | + | + | + | + | √ | √ | √(A) | 4 | |||
| T50 | + | + | √ | 2 | S235 | + | + | + | √ | √ | 3 | ||||||
| T52 | + | 1 | S237 | √ | √ | ||||||||||||
| S56 | S238 | + | 1 | ||||||||||||||
| S61 | S241 | √ | |||||||||||||||
| T63 | T245 | + | √ | √ | 1 | ||||||||||||
| S64 | S258 | √ | √ | ||||||||||||||
| S68 | √ | S262 | √ | √(A) | |||||||||||||
| T69 | + | √ | √ | 1 | T263 | ||||||||||||
| T71 | √ | S285 | + | √ | √ | 1 | |||||||||||
| T76 | S289 | + | + | √ | 2 | ||||||||||||
| T95 | S292 | ||||||||||||||||
| T101 | S305 | + | + | √ | 2 | ||||||||||||
| T102 | S316 | ||||||||||||||||
| T111 | + | + | 2 | T319 | |||||||||||||
| S113 | √ | S320 | + | 1 | |||||||||||||
| T123 | + | √ | 1 | S324 | + | + | √ | 2 | |||||||||
| S129 | S341 | ||||||||||||||||
| S131 | S352 | √ | 1 | ||||||||||||||
| T135 | S356 | + | + | √ | √ | √(A) | 2 | ||||||||||
| S137 | S361 | + | 1 | ||||||||||||||
| T149 | + | √ | √ | 1 | T373 | + | + | √ | 2 | ||||||||
| T153 | + | + | √ | √ | √(A) | 2 | T377 | ||||||||||
| S162 | √ | T386 | |||||||||||||||
| S169 | + | + | √ | 2 | Y394 | + | + | √ | 2 | ||||||||
| T175 | + | + | + | + | √ | √ | √(A) | 4 | S396 | + | + | + | + | √ | √ | √(A) | 4 |
| T181 | + | + | + | + | √ | √ | √(A) | 4 | S400 | + | + | + | + | √ | √ | 4 | |
| S184 | + | √ | √ | 1 | T403 | + | + | + | + | √ | 4 | ||||||
| S185 | + | √ | 1 | S404 | + | + | + | + | √ | √ | √(A) | 4 | |||||
| S191 | + | + | 2 | S409 | + | + | + | + | √ | √ | 4 | ||||||
| S195 | + | + | + | √ | √ | 3 | S412 | + | + | √ | 2 | ||||||
| Y197 | + | + | √ | 2 | S413 | + | + | + | √ | √ | 3 | ||||||
| S198 | + | + | √ | √ | 2 | T414 | + | √ | 1 | ||||||||
| S199 | + | + | √ | √ | √(A,B) | 2 | S416 | + | + | + | √ | 3 | |||||
| S202 | + | + | + | + | √ | √ | √(A,B) | 4 | S422 | + | + | √ | √ | √(A) | 2 | ||
| T205 | + | + | + | √ | √ | √(A,B) | 3 | T427 | √ | ||||||||
| S208 | + | √ | 1 | S433 | √ | ||||||||||||
| S435 | √ | ||||||||||||||||
| peptide coverage | 98% | 94% | 49% | 85% | |||||||||||||
| # P-tau phos. sites | 31 | 25 | 32 | 21 |
Staging epitopes used in A = Augustinak et al 2002; B = Braak et al 2006
Table 2.
PIMAX p-tau possesses a phosphorylation pattern with significant overlap with known PHF and GSK-3β phosphorylation sites.
| Overlap in: | |||||
|---|---|---|---|---|---|
| # sites | GSK | PHF | GSK+PHF | Staging markers | |
| 4-hitters | 10 | 9 | 9 | 8 | 6 |
| 3-hitters | 6 | 5 | 6 | 5 | 2 |
| 2-hitters | 17 | 10 | 10 | 6 | 2 |
| 1-hitters | 19 | 8 | 11 | 6 | 1 |
| 52 | 32 | 36 | 25 | 11 | |
Besides 1N4R, three other isoforms were also expressed and purified with PIMAX. These four p-tau (0N3R, 0N4R, 1N4R, and 2N4R) were examined by SDS-PAGE and mass spectrometry. Supplementary Figure 1 and supplementary Table 1 show that all four p-tau isoforms shared a high degree of overlap in their phosphorylation pattern, suggesting that the alternatively spliced N and R domains had minor, if any, effects on GSK-3β substrate specificity. Due to the apparent similarity in their phosphorylation status, we used the 1N4R p-tau as the representative for studies henceforward.
To examine how hyperphosphorylation might affect the characters of tau, we first compared the kinetics of aggregation of p-tau, unmodified tau, and the K18 fragment (i.e., the R1–R4 core domain). The latter two are common subjects used in a variety of biochemical, structural, and drug discovery studies [46, 47]. Our typical fibrillization (aggregation) assays used 6 μM of each protein (unless otherwise stated). This dose was selected because terminal AD has ~10 μM total tau in the frontal cortex [48], of which 40% – 70% was estimated to be in a non-PHF pre-aggregate state [49]. Six micromolar of p-tau was close to the pathological state but lower than most aggregation assays using unphosphorylated tau [50–52]. Quantitative comparisons of the aggregation kinetics of the three tau species showed that hyperphosphorylation alone caused tau to aggregate (Fig. 2a), whereas unmodified tau and K18 did not change much under the assay conditions. Heparin stimulated both tau and p-tau fibrillization. K18, at 6 μM, showed very little fluorescence change, without or with heparin. When K18 was increased to 20 μM, a more pronounced response to heparin induction was observed, consistent with previous findings [50]. Assessments of the net changes of thioflavin S fluorescence over the course of 17 hours confirmed statistically the hyperphosphorylation-driven tau aggregation (Fig. 2b). The additive nature of phosphorylation and heparin suggested two independent modes for tau aggregation.
Figure 2.

Inducer-free and redox-independent fibrillization of p-tau. (a) Aggregation of p-tau, tau, and K18 with or without heparin was quantified by thioflavin S (ThS) fluorescence changes through the entire course of assays and (b) by calculating the net changes of ThS signals after 17 hours of reaction. Numbers above each bar are the P values for the comparison with p-tau without the use of heparin (leftmost column). These were one-tailed Student’s t tests; n = 3. (c) P-tau aggregation does not require the reducing agent DTT and is independent of Cys291 and 322. Shown are the net changes of ThS fluorescence from aggregation of wildtype and the C291S C322S mutant p-tau in the presence or absence of 1 mM DTT. P values were obtained from two-tailed Student’s t tests; n = 3.
In addition to the requirement of an inducer, aggregation of the unphosphorylated tau was shown to be influenced by the redox state of the two cysteine residues (Cys291 and Cys322) [53]. Recombinant tau aggregation was enhanced by inter-molecular Cys-Cys conjugation, but inhibited by the intramolecular disulfide bond [53]. The prominent influence of redox on the aggregation of unmodified tau obscured tau-centric drug discovery attempts in that many compounds identified in tau-based drug screens turned out to be non-selective redox modulators [44]. To see whether hyperphosphorylation-induced tau aggregation was also affected by the two Cys residues, two approaches were taken. Firstly, we compared p-tau aggregation in the presence or absence of the reducing agent DTT. Unlike the unphosphorylated K18 fragment that required a reducing environment for fibril formation [50], DTT was not essential for p-tau fibrillogenesis (Fig. 2c). A moderate reduction of p-tau aggregation efficiency resulted from DTT omission, but the heparin-independent increase of ThS fluorescence remained appreciable without DTT. In the second approach to definitively ruling out critical involvement of either cysteine residues, we mutated Cys291 and Cys322 to serine. The C/S p-tau was produced by PIMAX (Fig. 1a, third lane), and found to form fibrils as efficiently as its wildtype counterpart (Fig. 2c) in the absence of heparin. We concluded from data shown in Figure 2 that hyperphosphorylation alone was sufficient to trigger tau aggregation.
Besides thioflavin, p-tau fibrillogenesis was examined by four additional approaches without the use of a fluorescence indicator. Firstly, we used the MC-1 monoclonal antibody to probe p-tau conformation during aggregation (Fig. 3a). MC-1 recognized an epitope indicative of the formation of PHF [54]. P-tau harvested from 0, 48- and 120-hr aggregation reactions were immunoblotted by MC-1 and a general tau antibody. There was a clear increase of MC-1 recognition of p-tau during the 120-hour aggregation. Interestingly, without incubation for fibrillization (0-hr), p-tau already exhibited low but detectable MC-1 epitope. This observation was reminiscent of the ThS fluorescence of p-tau at the very beginning of our standard aggregation assays (Fig. 2a). We attributed these observations to the formation of pathologically relevant, fibrillar species among p-tau molecules during the five-day purification process. Indeed, it has been reported that hyperphosphorylation caused recombinant tau to form aggregates within hours [40, 55, 56]. Another thioflavin-independent assay was transmission electron microscopy (Fig. 3b). In 0- and 16-hr samples, fractals, i.e., aggregates characterized by irregular shapes that were recapitulated at any scale magnification, were frequently observed [57]. The canonical fibrillar and annular structures were seen more frequently at later times (72-hr). If p-tau aggregation was performed in the presence of heparin, fibrils were visible in as short as 16 hours (compare the second and the fourth micrographs), again consistent with the notion that both hyperphosphorylation and heparin promoted tau fibril formation.
Figure 3.

Immunological and biophysical characterization of p-tau aggregation. (a) Immunoblotting of p-tau with the PHF-specific MC-1 antibody [54] and a general tau antibody MAB3494 (R&D Systems). Duration of aggregation (0 – 120 hours) are shown on the left of the corresponding slots. Parallel blots were probed with the two indicated antibodies. (b) Transmission electron microscopy of p-tau aggregated for the indicated period. (c) PICUP (photo-induced cross-linking of unmodified protein) assays detecting high-molecular weight p-tau species. Shown are overnight aggregation products. (d) FTIR (Fourier transformation infrared) spectroscopy analysis of p-tau after aggregation. Spectral shifts after aggregation are indicated by two arrows.
Structural changes of p-tau during the course of aggregation reactions were further revealed by PICUP (photo-induced cross-linking of unmodified protein) and FTIR (Fourier-transform infrared spectroscopy). PICUP exploited photolysis of tris-bipyridylruthenium(II) dication induced by strong visible light in the presence of ammonium persulfate as the electron acceptor that, when activated, caused cross-linking of oligomeric proteins [58]. Figure 3c shows that overnight incubation resulted in the enrichment of a high-molecular weight p-tau species resolved by denaturing polyacrylamide gel electrophoresis. Furthermore, the overall secondary structure of p-tau before and after extended aggregation was examined by FTIR. This technique has been used to assess conformational differences between free and PHF tau [59]. After five days of aggregation, a clear shift of a peak from ~1654 wavenumber (cm−1) to around 1645 wavenumber, as well as increased signals toward 1630 wavenumber (red arrows) were observed. This spectral shift indicated the conversion of a disordered structure to a β-sheet-rich content at wavenumbers around 1633 cm−1 [60].
Together, biochemical and biophysical assays shown in Figures 2 and 3 demonstrated that hyperphosphorylation was sufficient to trigger tau to form fibrils. Moreover, the detection of MC-1 epitope further tied p-tau aggregation to a conformation associated with AD pathology.
PIMAX p-tau is cytotoxic
Neuron loss underlies the progressive decline of cognitive functions in AD and tauopathy patients. The discoveries that intracerebral injection of human AD brain extracts was sufficient to cause tau pathology in experimental mice [14, 15] suggest a path of tau pathology through an extracellular route. Cytotoxicity of hyperphosphorylated tau therefore is a feasible proxy for assessing the pathogenic potential of p-tau. To this end, different doses of p-tau (0.25 – 1 μM) and 1 μM of unmodified tau were used to treat the SH-SY5Y neuroblastoma cells for 20 hours. Viability was quantified by propidium iodide (PI) and fluorescein diacetate (FDA) differential staining before microscopic examination. FDA is converted by cellular esterases into a fluorogenic fluorescein, therefore revealing live cells. PI is excluded by living cells, but diffuses into dead cells and binds nucleic acid. FDA/PI differential staining thus provides a quantitative assessment of cellular viability. Figure 4a shows clear dose-dependent cell killing by p-tau: 0.5 μM of p-tau caused 50% of cell death, and 1.0 μM of p-tau essentially wiped out the entire population of cells. In sharp contrast, the unmodified tau, at 1 μM, had no effect on cell viability (orange bar, Fig.4a). These results were originally done with tau and p-tau pre-aggregated without an inducer for 20 hours before cell treatment. To see whether different degrees of aggregation affected p-tau cytotoxicity, varying doses of p-tau aggregation intermediates were harvested every 24 hours for SH-SY5Y cell treatment. As anticipated, p-tau showed increasing cytotoxicity when aggregation was allowed to proceed for up to 48 hours (Fig. 4b). Further extension of pre-aggregation reduced the cytotoxicity progressively (see 72-, 96-, and 120-hr timepoints, Fig. 4b), indicating that when fibrils grew larger, their toxicity to cells actually decreased. The reversal of p-tau cytotoxicity during the process of aggregation was consistent with reports showing cell toxicity specifically associated with tau oligomers but not polymers [26, 27, 40, 61, 62], that a phosphomimetic tau but not PHF disrupted microtubule network [62], and that the formation of large deposits of NFTs in a fly model was not required for neuron loss [37].
Figure 4.
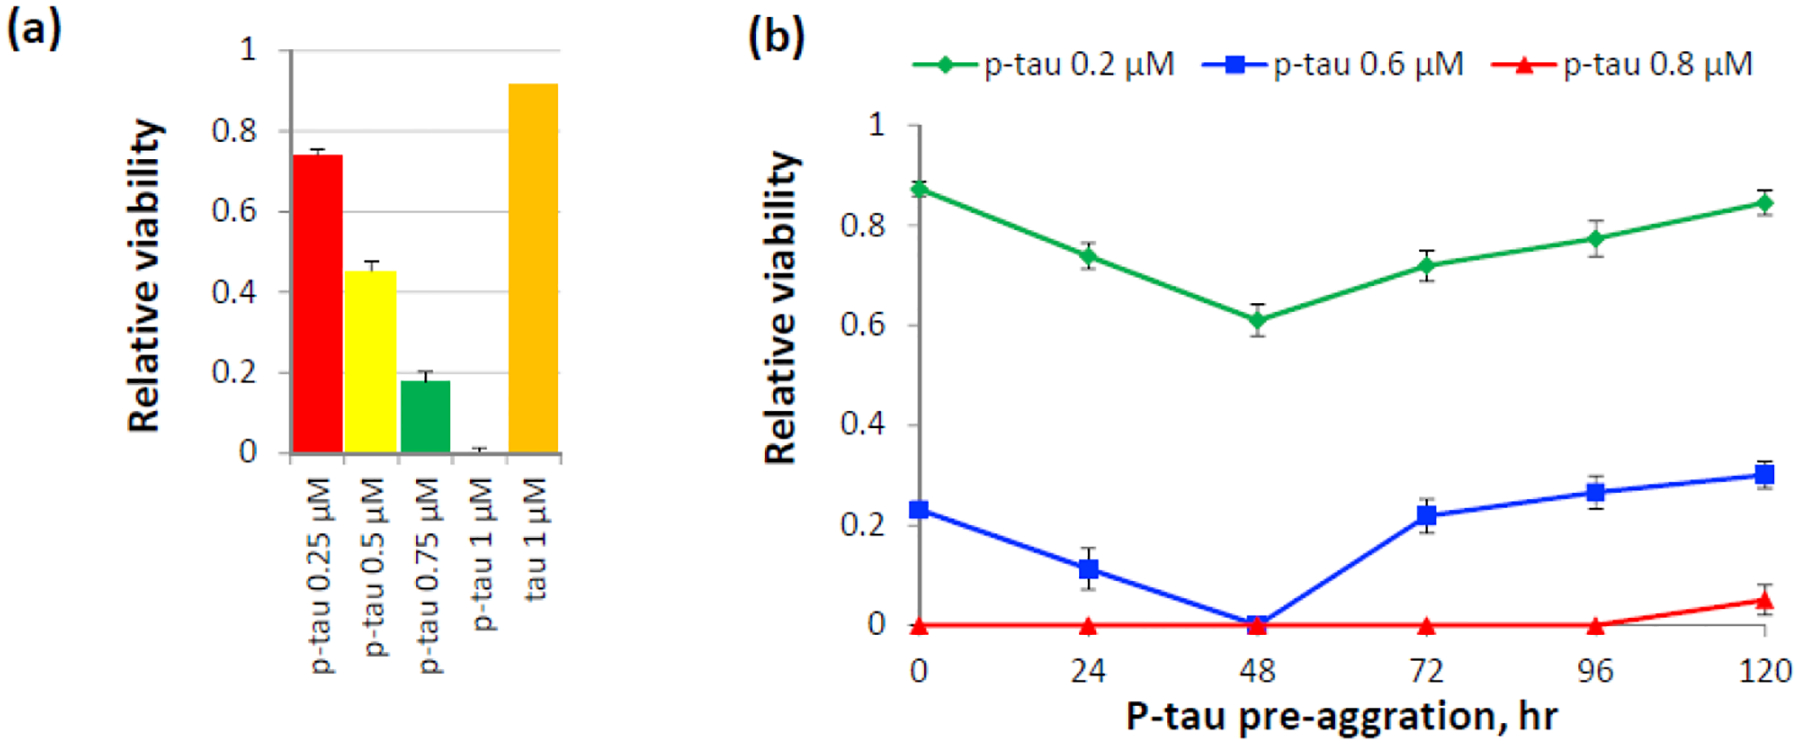
P-tau aggregates are toxic to cells. (a) Viability of cells after 20-hr treatment of 0.25 – 1 μM of p-tau or 1 μM of unmodified tau pre-aggregated for 20 hrs. Cells were double-stained by fluorescein diacetate (FDA) and propidium iodide (PI) for the quantification of relative viability. Error bars are standard deviation. n = 3. This graph is a representative of more than three biological repeats. (b) P-tau cytotoxicity is influenced by the extent of aggregation. P-tau subjected to standard aggregation reactions was collected at the indicated time points and used to treat the neuroblastoma SH-SY5Y cells for 16 hours before FDA/PI double staining and microscopic quantification. 0.8 μM of p-tau (red curve) caused quantitative cell death except the 120-hr pre-aggregation sample.
PIMAX p-tau potentiates the aggregation propensity and cytotoxicity of unmodified tau
An anticipated feature of a pathogenic tau is the ability to nucleate aggregation and cytotoxicity of an otherwise benign tau. That is, the pathogenic tau acts in a prion-like manner [21]. To test whether p-tau produced by PIMAX exhibited the “seeding” activity, we first examined the aggregation of unmodified tau in the absence or presence of a small amount of p-tau. Without heparin, 9- and 18-μM unmodified tau showed a net increase of 41 and 54 units of ThS fluorescence (Fig. 5a, red bars). With the addition of 1 or 2 μM of p-tau (1/9 of that of tau), the ThS fluorescence essentially doubled to 71 and 117 units, respectively (green bars). At these low concentrations, p-tau alone registered less than 10 fluorescence units of increase (yellow bars). The synergism of ThS signals suggested that p-tau converted the otherwise poorly aggregating tau into a more fibrillogenic species.
Figure 5.
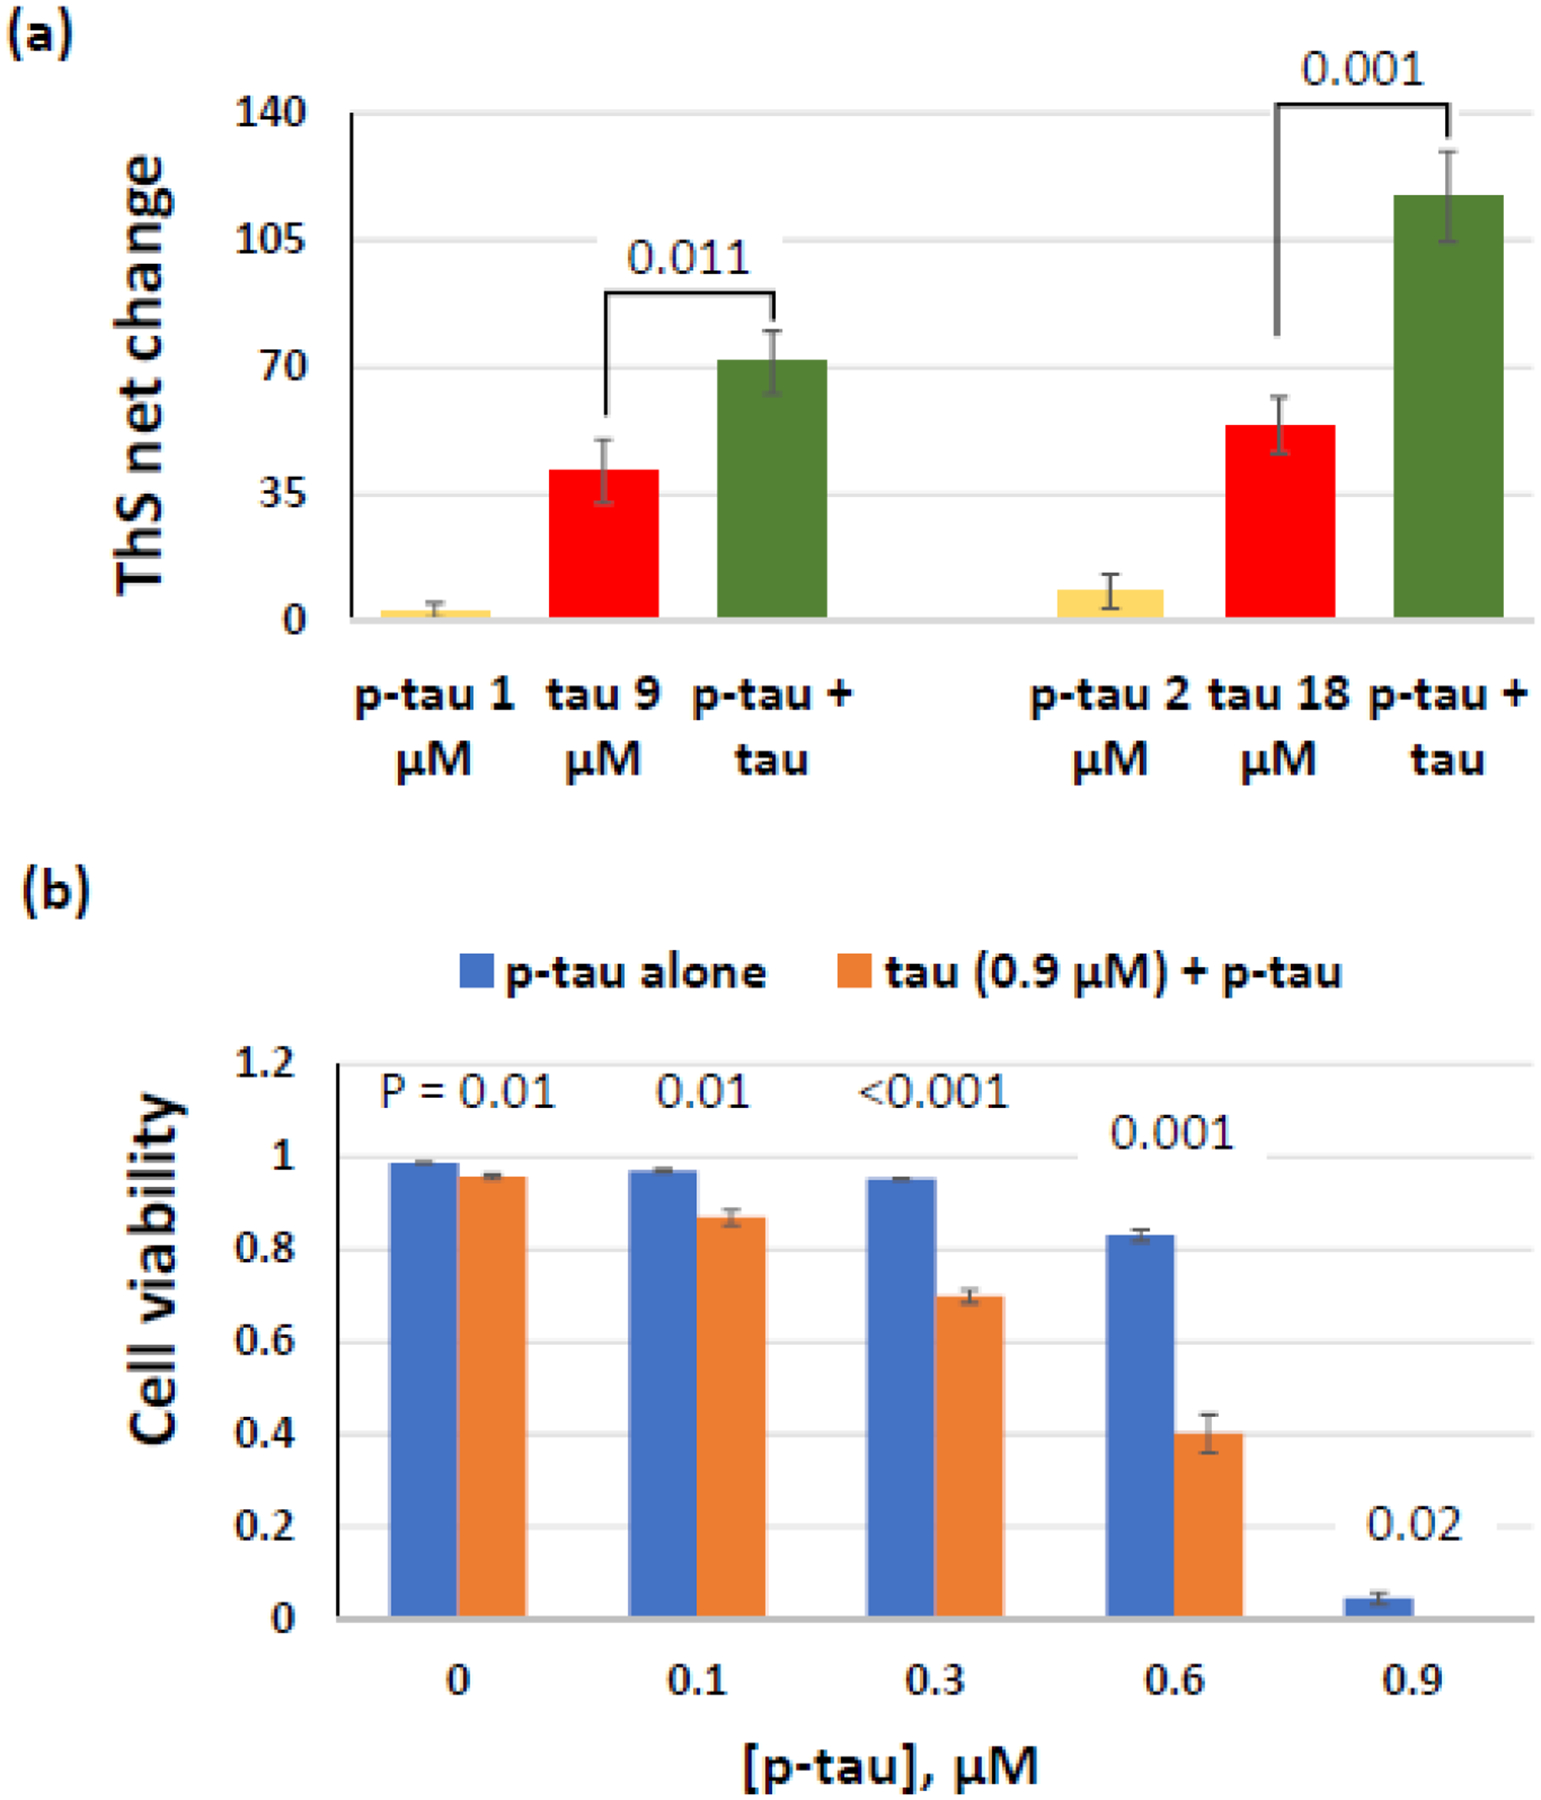
P-tau potentiates tau aggregation and cytotoxicity. (a) Inducer-free aggregation reactions with tau, p-tau, or a mixture of these two proteins were monitored for 16 hours. Comparison of ThS net changes is shown. (b) P-tau converts tau into a cytotoxic species. HEK 293T cells were treated with 0.9 μM of tau supplemented with 0 – 0.9 μM of p-tau for 24 hours before FDA and PI staining. Percentage of live cells is shown here. Note Errors are standard deviation; n = 3. P values (one-tailed Student’s t tests) of each pair of p-tau vs. (p-tau + tau) are shown above the corresponding columns.
We next tested whether tau could be rendered cytotoxic by p-tau using the HEK 293T cells. The lack of endogenous tau expression in this cell line permitted a more accurate assessment of the interplay between the recombinant tau and p-tau. Fig. 5b shows the viability of HEK 293T cells after 24-hr treatment of tau and/or p-tau. Without any exogenous protein (leftmost blue bar), 99% cells were viable. With 0.9 μM of unphosphorylated tau, cells maintained high (96%) viability (first orange bar), whereas 0.9 μM of p-tau alone killed 95% of cells (rightmost blue bar). Low concentrations of p-tau (0.1 or 0.3 μM) had negligible effects on these cells. In contrast, supplementing the same doses of p-tau with 0.9 μM of tau augmented cell death. This effect can be easily seen with 0.3-μM and 0.6-μM p-tau treatment, in which cell viability reduced from 95% and 83% to 70% and 40%, respectively, if tau was included in the treatment. It was therefore concluded that p-tau converted the benign tau into a cytotoxic species, likely mimicking the prion-like activity of hyperphosphorylated tau in the spread of neurofibrillary tangles. This notion was also consistent with the observations that the tau-expressing SH-SY5Y cells were consistently more sensitive to p-tau than HEK 293T cells in our analysis (data not shown; see Discussion below).
P-tau triggers apoptosis and elevation of mitochondrial superoxide levels
To begin to understand the mechanism of p-tau-triggered cell death, we examined apoptosis and superoxide levels of cells after p-tau treatment. In the viability tests shown above, cells were exposed to p-tau for 20 hours. Under this situation, many cells that died showed morphological changes indicative of lysis. To better understand how p-tau affected cells, we treated SH-SY5Y cells with a lower dose (0.5 μM) for a shorter period (5 hours) before performing the assays. The first test was to stain cells with PI and annexin V. Annexin V is a cytoplasmic membrane marker for apoptosis [63]. Fig. 6a shows a clear indication of apoptosis following p-tau treatment. While a few cells were stained positive by PI after 5-hr p-tau treatment, many others were PI-negative and annexin V-positive, suggesting that these were early apoptotic, not necrotic, cells that maintained the ability to exclude PI.
Figure 6.

P-tau activates apoptosis and triggers mitochondrial superoxide accumulation. (a) Examination of apoptosis after p-tau treatment. SH-SY5Y cells treated by 0.6-μM p-tau for 12 hours were examined by FITC-annexin V and PI double staining. Here shows the existence of both early apoptotic (annexin V positive and PI negative) and late apoptotic or already dead (annexin V and PI both positive) cells. DIC: differential interference contrast. (b) and (c) P-tau raises mitochondrial superoxide levels. SH-SY5Y cells treated by 0.6 μM of p-tau for 5 hours were stained by MitoSOX for for microscopy (b) and FACS analysis (c). 20 mM Tris (pH 7.4) buffer was used as mock treatment. The mean fluorescence intensity (MFI) is shown in the bar graph. Error bars show range of two independent assays. (d) Examination of the effect of ROS scavengers on apoptosis after p-tau treatment. SH-SY5Ycells grown in the presence of two concentrations of NAC, TEMPOL or Trolox for 24 hours were treated by 0.4-μM p-tau for 5 hours. The cells were then double-stained by MitoSOX and FITC-annexin V. The percentage of cells stained by annexin V and those exhibiting strong MitoSOX signals are shown. Error bars are standard deviation. n = 3.
An increasing number of reports linked neurodegeneration to oxidative stress [64] caused by an imbalance in reactive species. One of the most prominent sources for oxidative stress is reactive oxygen species (ROS). To see whether p-tau treatment might affect the ROS levels in cells, cells were treated with p-tau for 5 hours and then probed by MitoSOX, a mitochondrion-targeting fluoroprobe for superoxide and other radicals [65]. Figure 6b shows representative images of MitoSOX staining. P-tau treatment caused a number of cells to exhibit a spike of superoxide. These cells frequently showed morphological alterations (see DIC panels, Figure 6b). For a more quantitative assessment, MitoSOX stained cells were analyzed by FACS (Fig. 6c). Compared with the mock (untreated) samples, p-tau treatment more than doubled the overall intensity of MitoSOX fluorescence. These results clearly showed that p-tau caused significant elevation of cellular levels of radicals. To further test the causal link between ROS and apoptosis, ROS inhibitors were given to cells prior to the addition of p-tau. If ROS accumulation was an underpinning for p-tau-induced apoptosis, preventing ROS accumulation would reduce the number of apoptotic cells after p-tau treatment. This indeed was the case. Figure 6d shows that the SH-SY5Y cells stained by annexin V increased from 12% to 70% after 5-hr, 0.4 xM p-tau treatment. In the presence of N-acetyl-L-cysteine (NAC) [66], TEMPOL [67], or Trolox [68], p-tau-induced apoptosis (blue columns) and ROS accumulation (orange columns) were both reduced, indicating that p-tau caused apoptosis via the induction of mitochondrial radical accumulation.
Discussion
In this work, we show that p-tau produced by PIMAX exhibits characters likely relevant to the pathology of Alzheimer’s disease. These include multiple phosphorylation sites associated with the disease, inducer-free fibril formation, and clear toxicity to cells. These characters are absent from the unmodified tau produced in parallel, demonstrating that hyperphosphorylation is the underlying reason for the observed changes in the molecular behaviors of tau.
Given the tight association between the abnormal phosphorylation of tau and tauopathy neurodegeneration, different means have been used by many to prepare hyperphosphorylated tau. In vitro phosphorylation with purified kinases is feasible but costly [55, 69]. Biochemical purification of tau from postmortem brain tissues is faced with the challenges of heterogeneity in tau isoforms and additional, even antagonizing, post-translational modifications [70]. A baculoviral expression system produced a tau containing up to 20 phosphates (P20) per molecule after okadaic acid treatment [56]. However, this P20-tau did not form the canonical fibrils that were easily quantifiable with dyes such as thioflavin S, and had minor effects on cell survival. The carryover of other eukaryotic post-translational modifications or metabolites may have influenced the molecular characters of this P20-tau. To date, heparin-induced aggregation of unmodified tau prevails in biochemical, biophysical and structural assays, as well as drug discovery endeavors. It should be cautioned that the pathophysiological contribution of heparin in AD remains elusive. Additionally, the aggregation of unmodified tau is affected by the redox state of the two cysteine residues of tau [52, 53]. As such, many tau aggregation inhibitors originally touted to be of therapeutic potential turned out to be unselective redox modulators [44].
One interesting observation is that the newly prepared p-tau already assumed cytotoxicity (Fig. 4). This character is likely related to the noticeable initial ThS fluorescence in aggregation reactions (e.g., Fig. 2a). Apparently, neither the fibrillogenesis (i.e., ThS reactivity) nor the cytotoxicity of p-tau had reached saturation at the time when the respective assays started. The “background” thioflavin reactivity of hyperphosphorylated tau has been observed in at least three previous reports [40, 55, 56], suggesting a swift structural impact by hyperphosphorylation. Our attempts to remove the T0 ThS reactivity by ultracentrifugation (100,000 × g), were not successful (data not shown). The only effective approach was treating p-tau with a strong chaotropic denaturant such as 6 M guanidinium thiocyanate (Supplementary Figure 2) or 6 M guanidinium hydrochloride (not shown). Supplementary Figure 2 shows that 6 M guanidinium thiocyanate reduced the background ThS reactivity and also prevented the further formation of p-tau fibrils. Intriguingly, “snap-dilute” guanidinium thiocyanate from 6 M to 1 M with the aggregation reaction buffer allowed p-tau to reassume the ThS signal within the ~5-minute duration of reaction assembly. These observations strongly suggested that p-tau molecules rapidly organized into a ThS-reactive amyloid that was too buoyant for precipitation by commonly practiced centrifugation procedures. This species is likely analogous to the reported tau cytotoxic oligomers with a molecular weight of 140 – 190 kDa [25, 26]. Alternatively, considering the fast “snack-back” of ThS signals after reducing the chaotropic denaturant concentration, and that each of the four repeat domains of tau may form more than one β-sheet [71], it is tempting to speculate that monomeric p-tau molecules fold into a “mini-amyloid” with intramolecular cross β-sheets before engaging into quaternary structures visible under transmission electron microcopy (Figure 3b) and PICUP (Figure 3c). Biochemical fractionation and additional biophysical and structural approaches to identifing the p-tau species contributing to cytotoxicity are in progress.
An important trait of PIMAX p-tau relevant to the disease is cytotoxicity. Relatively high concentrations of unmodified tau oligomers [26, 72] affected moderately the survival of SH-SY5Y cells based on MTT and LDH leakage assays. Comparatively, p-tau produced by PIMAX shows a significantly greater potency of killing cells. Quantified by FDA and PI differential staining, the LD50 (dose of p-tau causing 50% of cell death) for SH-SY5Y cells was estimated to be ~0.57 μM (Fig. 4a, and data not shown). In addition, we have tested HEK293T cells and mouse neurons differentiated from neonatal mouse neural stem cells (data not shown). The LD50 was estimated to be ~0.75 μM and ~1.10 μM, respectively. These numbers are lower than the estimated concentration of soluble, pre-tangle tau in AD cortices [48], suggesting that the 1N4R p-tau provides appropriate potency for disease mechanism studies. In addition, the existence of the ghost tangles in AD brains (from the Braak Stage III and up) suggests a burst of hyperphosphorylated tau following neuron death [73]. The local concentration of extracellular p-tau can in theory reach a critical mass leading to a cascade of neuronal dysfunction. Prior to massive cell death, sub-micromolar concentrations of p-tau caused the accumulation of ROS and activation of apoptosis. Possible modes of action of p-tau cytotoxicity may include membrane impairment [28, 72], binding to a mitochondrial protein, such as VDAC1 [74], or others. Identifying the pathway(s) affected by p-tau may reveal new druggable targets. More in-depth studies are apparently needed to fully delineate the molecular mechanisms underlying p-tau cytotoxicity.
The four p-tau isoforms produced by PIMAX (1N4R, 0N3R, 0N4R, and 2N4R) shared a high degree of similarity in their phosphorylation patterns (Supplementary Figure 1), suggesting that, at least for GSK-3β, the substrate specificity determinants reside outside the two N domains and the R2 repeat subjected to alternative splicing. Whether these isoforms exhibit distinctions in aggregation kinetics and/or cytotoxicity that may shed light on the differential distribution of 3R and 4R isoforms in tauopathies awaits further investigation. A recent intracerebral injection study on transgenic mice showed clearly that tau isolated from tauopathy brains resulted in pathology reflecting the original disease, and that each tau species propagated the respective disease-specific conformation [75](also see [18] for review). The molecular underpinnings for such conformations are elusive, due partly to the relatively low abundance of pathological tau in the brain extracts used for injection. The recombinant PIMAX approach may provide a biochemically more defined alternative that complements the brain extracts for in vitro and in vivo studies. The PIMAX approach can be easily adjusted to expand the p-tau repertoire. For example, kinases other than GSK-3β, such as CDK5 and AMPK have been implicated in tau hyperphosphorylation [12]. We showed previously that the 1N4R p-tau generated by CDK5 or GSK-3β possessed different phosphorylation patterns and aggregation kinetics [39]. Pairing different tau isoforms and kinases for PIMAX production will afford a useful tool set for a variety of mechanistic studies of tauopathies.
A biochemically refined recombinant p-tau, advantageous as it is, apparently is limited to only one set of phosphorylation events. Additional PTMs, such as acetylation [76], O-GlcNAcylation [77, 78], and other phosphorylation sites associated with the disease are excluded. For example, phosphorylation at Ser262 has been shown to be a potent driver for aggregation [79], and is part of a tripartite phosphorylation pattern for neurodegeneration [62, 80]. Ser262 phosphorylation was not detected in the current p-tau by mass spectrometry (see Table 1), although our early study using anti-pS262 antibodies did detect this modification [39]. Besides aggregation and cytotoxicity, the morphology of fibrils can also be affected by the status of tau phosphorylation [18]. It is foreseeable that expansion from the current PIMAX platform may bring about additional tau species for more in-depth AD studies.
As to hyperphosphorylated tau-based drug discovery, experiments shown above can support compound screening at an intermediate throughput. P-tau aggregation assays were done in 384-well plates, which allowed us to conduct a pilot screen of ~1300 compounds for molecules with significant p-tau aggregation modulation activities, followed by cell-based assays and other validating examinations (Liu et al, to be published elsewhere). Both p-tau aggregation inhibitors and enhancers that antagonized or exacerbated p-tau cytotoxicity were discovered. It is anticipated that more screens and targeted tests of compounds that can potentially control p-tau pathogenicity will be materialized. These developments will support a new avenue for AD and tauopathy drug discovery, as well as the identification of manageable risk factors for sensible prevention.
METHODS
Materials
Fluorescein diacetate, propidium iodide and thioflavin S were purchased from Sigma Aldrich (St. Louis, MO). Gibco Dulbecco’s Modified Eagle Medium (DMEM), HyClone™ Fetal Bovine Serum, Optical Adhesive Film and FITC-Annexin V were purchased from Thermo Fisher Scientific (Waltham, MA). All other chemicals for common buffers and solutions were from Sigma Aldrich. MC-1 antibody was a generous gift by Dr. Peter Davies.
Plasmids and recombinant genes
The plasmids pMK1013-GSK-tau(1N4R) and pMK1013-tau(1N4R) for the expression of the 1N4R tau and p-tau were previously described [39]. This p-tau was used throughout the main portion of this study. The four isoforms shown in Supplementary Figure 1 and Supplementary Table 1 were from pMK1013-sGSK-tau, where “sGSK” refers to the swapping of the human GSK-3β cDNA a synthetic sequence with codons optimized for E. coli expression. However, this modification did not result in significantly higher levels of p-tau expression (data not shown). K18 was constructed via deletion of the DNA regions corresponding to amino acid residues (1–243) and (369–441) from pMK1013-tau(1N4R) by QuikChange mutagenesis. Cys-to-Ser mutations were generated using QuikChange mutagenesis. Mutagenic primer sequences are available upon request. All constructs were verified by DNA sequencing. The final tau and p-tau expressed from the PIMAX system contained a 7-residue remnant from cloning: GSSPEQP at the N’ end.
Recombinant protein expression and purification
P-tau, p-tau carrying the Cys-to-Ser mutations, tau, and K18 were expressed as the following: overnight cultures of BL21 codon plus bearing the desired plasmid were diluted to 0.03 OD600 in fresh LB medium with ampicillin. Cells were grown at 37°C until OD600 reached between 0.3 and 0.5 when 0.1 – 0.5 mM IPTG was added to the culture for induction for 1 – 2 hours. Cells were then collected by centrifugation. For purification, bacterial pellets from each liter of cultures were suspended in 10-ml cold purification buffer (20 mM Tris-HCl pH 5.8, 100 mM NaCl, 1 mM PMSF, and 0.2 mM orthovanadate to preserve the phosphorylation) and treated with 1 mg/ml lysozyme at 30°C for 30 min. The mixture was then sonicated (Branson Digital Sonifier 450; 30% amplitude; total process time 3 min; pulse-ON time 5 sec; pulse-OFF time 5 sec) and centrifuged at 17,000 × g for 40 min at 4°C. The supernatant was left in a boiling water bath for 30 min and left on ice for 30 min with occasional and gentle shaking in both steps. After centrifugation at 17,000 × g for 50 min at 4°C, the supernatant was transferred to another tube before 0.5 mM DTT and 1 mM EDTA were supplied. One OD280 of purified recombinant TEV protease was added to digest each 100 OD280 of the sample, and the reaction was incubated at 4°C for overnight. The digestion mixture was then centrifuged at 17,000 × g for 30 min at 4°C, and the supernatant was transferred to another tube. The buffer was adjusted to gel filtration buffer (20 mM Tris-HCl pH 7.4, 100 mM NaCl) by the use of a spin column (Amicon Centrifugal Filter Unit, Ultra-15, 10K) at 5,000 × g at 4°C until the volume reduced to less than 1 ml. 3 ml of gel filtration buffer was added to the column. The centrifugation and buffer change were repeated twice. The final gel filtration buffer equilibrated solution was injected to a Superdex 200 10/300 GL column (GE Healthcare Life Sciences, USA). Size exclusion chromatography was done on an AKTA explorer FPLC unit at 4°C. The flow rate was set at 0.3 ml/min, and the fractions containing the desired protein were pooled and concentrated by a spin column. After the concentration was completed, the protein solution was collected and supplemented with 10% glycerol (v/v) before −80°C storage. All p-tau preparations were verified for inducer-free aggregation and cytotoxicity.
Mapping p-tau phosphorylation sites by LC-MS/MS
For in-gel digestion, the protein band of interest was excised from the SDS-PAGE gel for digestion with endoproteinase trypsin, Lys-C, Arg-C or AspN (Roche, USA). The gel piece was soaked in 1 mL of 25 mM NH4HCO3 for 10 min and dehydrated with 1 mL of 25 mM NH4HCO3/50% acetonitrile for 10 min. After dried in a Speed-Vac (Savant, USA), the gel was incubated in 100 mL of 1% β mercaptoethanol/25 mM NH4HCO3 for 20 min at room temperature and at dark. An equal volume of 5% 4-vinylpyridine in 25 mM NH4HCO3/50% acetonitrile was added for cysteine alkylation. After a 20-min incubation, the gel piece was washed in 1 mL of 25 mM NH4HCO3 for 10 min and in 1 mL of 25 mM NH4HCO3/50% acetonitrile for another 10 min. The gel piece was dried and then incubated with 25 mM NH4HCO3 containing 500 ng of endoproteinase at 37°C or at room temperature overnight (~18 h). After the digest was saved, the peptides remaining in gel piece were extracted sequentially with 300 mL of 25 mM NH4HCO3 and 300 mL of 25 mM NH4HCO3/50% acetonitrile. The digest and the two extracts were combined together and then dried in a Speed-Vac. The dried sample was kept at 20°C for storage and resuspended in 0.1% formic acid immediately before use.
For phosphorylation site mapping by LC-MS/MS, electrospray mass spectrometry was performed using LTQ-Orbitrap hybrid tandem mass spectrometer (ThermoFisher, USA) in-lined with Agilent 1200 nanoflow HPLC system. The HPLC system was equipped with LC packing C18 PepMap100 (length: 5 mm; internal diameter: 300 mm; bead size 5 mm) as the trap column and in house-made capillary column packed with C18 beads (length: 105 mm; internal diameter: 75 mm; bead size: 5 mm) as the separating column. The mobile phase consisted of (A) 0.1% formic acid in water and (B) 0.1% formic acid in acetonitrile. Mass spectra for the elute were acquired as successive sets of scan modes. For the setting of LTQ-Orbitrap, full scans with Orbitrap analyses were collected in the range of 200~2000. The Dynamic Exclusion function in Data Dependent Settings was activated, with the Repeat Count as 1, Exclusion Duration as 180 s and Exclusion List Size as 50. While those with +1 or unassigned charge state were rejected, the top three ions in the survey scan fulfilling the above criteria were examined for their MS/MS with LTQ mass analyzer.
For informatics analysis, File Converter in Xcalibur 2.0.7 (ThermoFisher, USA) and a set of our in-house programs [81] were used to process the LC-MS/MS data. The mass spectra (MS) and tandem mass spectra (MS/MS) were first extracted and separated using our OutputPlus computer program. The MS spectra became segmental average MS using our SegAveMS algorithm. MS/MS were interpreted using Sequest/TurboSequest to find the bested matched peptide with human protein FASTA database (release 2016_06) downloaded from UniProt website. Our GetOUT macro found peptide sequences with XCorr score ≥ 2.5 and a mass error ≤ 15 ppm. The GetOUT and SegAveMS results were queried using our FindPTM algorithm, which produced a list of candidates modified peptides. The MS/MS spectra were eventually verified using our MS2Display and MS2Graph programs [81].
In another approach to mapping p-tau phosphorylation, online nanoLC-MSMS analysis was performed on a nanoLC (Eksigent NanoLC 2-D, currently Sciex) connected online to a hybrid LTQ-Orbitrap XL mass spectrometer (Thermo Fisher Scientific) via a TriVersa NanoMate (Advion) nano-electrospray source. Peptides were separated with a 120 min gradient (5% acetonitrile for 0–5 min, 5–40 % in 85 min, 40–95% in 5 min, 95% for 10 min, 95–5% in 5 min, and 5% for 10 min) on a custom packed 15 cm reverse-phase capillary column (50 μm i.d., Sepax HP-C18, 3 μm, 200 Å) at a flow rate of 200 nL/min. LTQ-Orbitrap instrument was operated in a data-dependent acquisition mode acquiring one MS scan (450–1700 m/z) in the Orbitrap analyzer and following CAD MSMS analysis in LTQ for the seven most abundant ions in the MS scan. Each sample was analyzed twice (two technical replicates) and submitted to MaxQuant (ver.1.5.1.2) [82] for database searching. The data were searched against a composite sequence database of human MAPT (microtubule-associated protein tau) proteins and common contaminants. A fixed modification of C-Carbamidomethyl, and variable modifications of M-oxidation, K-acetylation, and STY-phosphorylation were applied. Peptides, modifications, and proteins were identified at an FDR threshold of 1%.
Aggregation assay
Before aggregation assays, proteins were removed from the freezer and thawed on ice. Initially, the thawed protein was subjected to ultracentrifugation to remove large protein aggregates (100,000 × g, 60 min). However, this step did not result in significant reduction of the initial (T0) ThS fluorescence. A typical aggregation reaction contained 6 μM of protein unless otherwise stated. Other components of the reaction included 20 mM Tris (pH 7.4), 0 or 1 mM DTT, and 20 μM thioflavin S (ThS). Typically, the assays were assembled in a 384-well low-volume plate. The plate was covered by an Optical Adhesive Film to minimize evaporation during the assay. The plate was set at 37°C briefly before placing to a BioTek Synergy Neo Plate reader. ThS fluorescence was measured every 10 min (excitation 440 nm; emission 490 nm) for 16 hrs and collected using Gen5 software bundled with the BioTek plate reader. We observed batch-to-batch, and instrument-related variations in the absolute fluorescence of ThS binding. All reactions were therefore performed with triplicate. Only assays conducted at the same time were plotted in the same graph.
Examination of whether p-tau affected tau aggregation or cytotoxicity (i.e., seeding experiments), p-tau at 0, 1, 3, 6 or 9 μM was mixed with 9 μM tau, and 20 μM ThS was then added and the mixture was transferred into a 384-well low-volume plate for ThS reading as the typical aggregation reactions.
Slot-blot assay
Six μM of p-tau was incubated in the standard aggregation buffer (see above) without ThS for 0, 48 or 120 hours. Two μL of the samples were diluted into 400 μL TBS buffer (20 mM Tris, pH 7.4, 150 mM NaCl) and applied to a PVDF membrane in a slot blot apparatus (Bio-Rad, Hercules, CA). The membrane was blocked in 5% nonfat milk in TBST (20 mM Tris, pH 7.4, 150 mM NaCl, 0.1% Tween 20) for 1 hour, and then incubated with the MC-1 monoclonal antibody (at 1:1000 dilution) or MAB3494 (at 1:3000 dilution) for overnight at 4°C. After washing three times in TBST, the membrane was incubated with HRP goat anti-mouse secondary antibody (at 1:10000 dilution) for 1 hour at room temperature. The membrane was washed again 3 times in TBST and developed with the Lumi-light Western Blotting Substrate for 5 min.
PICUP and FTIR assays
For PICUP assays, appropriate volume of 10 μM of p-tau was incubated in 20 mM Tris-HCl (pH 7.4), 1 mM DTT, at 37°C for 24 hours for fibrillization. The subsequent procedures were performed in a dimly lit dark room. To 18 μl of the p-tau aggregation reactions in a PCR microtube, 1 μl of 20 mM APS and 1 μl of 1mM tris(bipyridyl)Ru(II) [Ru(Bpy)] were added, making the final concentrations of APS and Ru(Bpy) to be 1 mM and 0.05 mM, respectively. The reaction mixtures were placed approximately 10 cm above a 50 W, 5000 lumens LED work light (Porter Cable) for 1-second exposure. The reactions were quenched by the addition of 1 μl of 1 M DTT, followed by SDS-PAGE loading dye before resolving by 8% SDS-PAGE.
For FTIR, 10 μM of p-tau was incubated in 20 mM Tris-HCl (pH 7.4), 1 mM DTT, at 37°C for 5 days. This longer incubation was necessary for the detection of clear spectral shift. At the end of the aggregation, 4 reaction-volumes of cold (−20°C) acetone was added to the reaction, followed by centrifugation at 14,000 rpm in a standard microcentrifuge for 15 minutes. The pellet was washed with cold acetone, centrifuged, and air-dried before dissolving in D2O to bring p-tau concentration to 1 mg/ml (~20 μM). The sample was incubated in D2O for 2 hours at room temperature, then loaded to a CaF2 cell with a 100-μm spacer (PIKE Technologies). The infrared spectrum was recorded with a Mattson Galaxy series GL5020 spectrometer between wavenumbers 1900 and 1200 cm−1 at a resolution of 2 cm−1, and 128 scans were averaged for comparison.
Cytotoxicity, apoptosis and ROS assessment
Cell viability assays were conducted in 96-well plates. Two thousand HEK 293T or SH-SY5Y cells in 100 μL media (DMEM, 10% FBS, pen/strep) were seeded to a well and cultured for 40 – 48 hours at 37°C, 5% CO2. The confluency of cells may affect their sensitivity to p-tau. Values of LD50 can therefore only be compared among experiments done at the same time. Pre-aggregation, if needed, was done with tau or p-tau at 10x concentration for cell treatment for the duration (0 – 72 hours) specified in the corresponding figure without heparin or ThS. At the time of cell treatment, 10 μl of the (pre-aggregated) protein was added to each well of cells. 16 – 20 hours after the addition of proteins, cells were trypsinized and transferred to microcentrifuge tubes, and pelleted at 1,000 × g for 5 min at room temperature. Cell pellets were resuspended in phosphate-buffered saline (137 mM NaCl, 2.7 mM KCl, 10 mM Na2HPO4, 1.8 mM KH2PO4) and incubated with 5 μg/ml fluorescein diacetate (FDA) for 5 min at room temperature. Five μg/ml propidium iodide (PI) was then added to the mixture. Cells stained by FDA or PI were examined using an Olympus BX51 Fluorescence Microscope. Cells from randomly chosen fields were counted for FDA or PI stainability. At least fifty cells from multiple fields were counted for each treatment well. Viability was calculated using the equation:
To examine apoptosis, cell pellets from 5-hour p-tau treatment were resuspended in annexin V binding Buffer (0.1 M HEPES pH7.4, 1.4M NaCl, 25 mM CaCl2). Five μL of cell suspension was stained with 0.5 μL of FITC-conjugated annexin V (Invitrogen, USA) at room temperature for 15 min in the dark, followed by addition of PI to final concentration of 5 μg/ml. Microscopy procedures were identical to those for FDA/PI assays. For MitoSOX and ThS double staining to link mitochondrial superoxide to intracellular fibrils, HEK 293T cells were harvested after 5-hr 0.6 μM of p-tau treatment. Cell pellets were resuspended in 20 mM Tris, pH7.4 buffer and incubated with 100 μM ThS for 5 min at room temperature. The cell suspension was then stained with 5 μM MitoSOX at 37°C for 10 min in the dark and examined using an Olympus BX51 Fluorescence Microscope. To analyze the production of superoxide by flow cytometry, SH-SY5Y cells after 5-hr 0.6 μM of p-tau treatment was only stained by MitoSOX, and then examined at Excitation 510 nm, Emission 580 nm using the BD™ LSR II flow cytometer. For ThS and PI staining, cell pellets were resuspended in PBS and stained by 100 μM ThS for 5 min at room temperature, followed by additional staining with 5 μg/ml PI.
To analyze the effect of ROS scavengers on p-tau cytotoxicity, SH-SY5Y cells were first treated by NAC (N-acetyl-l-cysteine), TEMPOL (4-hydroxy-2,2,6,6-tetramethyl-1-piperdinyloxy) or Trolox for 24 hrs. The medium was then replaced by DMEM medium containing 0.4 μM p-tau. After 5-hr incubation, the cells were stained by 5 μM MitoSOX as described above. To detect the percentage of apoptotic cells, FITC-conjugated annexin V was used to stain the samples after supplementing 25 mM CaCl2. The cell suspension was then examined using an Olympus BX51 Fluorescence Microscope.
Supplementary Material
Acknowledgments
We are grateful for the generous supply of MC-1 monoclonal antibodies by Peter Davies, and technical help and suggestions from Justin McCormick, Doug Gage, David DeWitt, John LaPres, Lisa Lapidus, Andrea Doseff, and Richard Neubig, and Kathryn Severin. We also thank Wei-Yu Liu and Yuk Kei Wan for assistance, and Christopher Buehl and Witawas Handee for discussions throughout the development of this project.
Funding:
This work received funding from the National Institute on Aging (1R21AG051820, 1R01AG062435), the College of Osteopathic Medicine and the Office of the Vice President for Research and Graduate Studies, and the Molecular Discovery Group, Michigan State University, to M-HK, and from NIA (1R41AG057274) to DAB and M-HK.
Footnotes
Publisher's Disclaimer: This Author Accepted Manuscript is a PDF file of a an unedited peer-reviewed manuscript that has been accepted for publication but has not been copyedited or corrected. The official version of record that is published in the journal is kept up to date and so may therefore differ from this version.
Conflict of interest: The authors declare that they have no conflicts of interest with the contents of this article.
Data sharing is not applicable to this article as no datasets were generated or analyzed during the current study.
REFERENCES
- 1.Glenner GG & Wong CW (1984) Alzheimer’s disease: initial report of the purification and characterization of a novel cerebrovascular amyloid protein, Biochem Biophys Res Commun. 120, 885–90. [DOI] [PubMed] [Google Scholar]
- 2.Grundke-Iqbal I, Iqbal K, Tung YC, Quinlan M, Wisniewski HM & Binder LI (1986) Abnormal phosphorylation of the microtubule-associated protein tau (tau) in Alzheimer cytoskeletal pathology, Proc Natl Acad Sci U S A. 83, 4913–7. [DOI] [PMC free article] [PubMed] [Google Scholar]
- 3.Hardy J & Selkoe DJ (2002) The amyloid hypothesis of Alzheimer’s disease: progress and problems on the road to therapeutics, Science. 297, 353–6. [DOI] [PubMed] [Google Scholar]
- 4.Mehta D, Jackson R, Paul G, Shi J & Sabbagh M (2017) Why do trials for Alzheimer’s disease drugs keep failing? A discontinued drug perspective for 2010–2015, Expert opinion on investigational drugs. 26, 735–739. [DOI] [PMC free article] [PubMed] [Google Scholar]
- 5.Braak H, Alafuzoff I, Arzberger T, Kretzschmar H & Del Tredici K (2006) Staging of Alzheimer disease-associated neurofibrillary pathology using paraffin sections and immunocytochemistry, Acta Neuropathologica. 112, 389–404. [DOI] [PMC free article] [PubMed] [Google Scholar]
- 6.Nelson PT, Alafuzoff I, Bigio EH, Bouras C, Braak H, Cairns NJ, Castellani RJ, Crain BJ, Davies P, Del Tredici K, Duyckaerts C, Frosch MP, Haroutunian V, Hof PR, Hulette CM, Hyman BT, Iwatsubo T, Jellinger KA, Jicha GA, Kovari E, Kukull WA, Leverenz JB, Love S, Mackenzie IR, Mann DM, Masliah E, McKee AC, Montine TJ, Morris JC, Schneider JA, Sonnen JA, Thal DR, Trojanowski JQ, Troncoso JC, Wisniewski T, Woltjer RL & Beach TG (2012) Correlation of Alzheimer disease neuropathologic changes with cognitive status: a review of the literature, J Neuropathol Exp Neurol. 71, 362–81. [DOI] [PMC free article] [PubMed] [Google Scholar]
- 7.Tomlinson BE, Blessed G & Roth M (1970) Observations on the brains of demented old people, Journal of the neurological sciences. 11, 205–42. [DOI] [PubMed] [Google Scholar]
- 8.Alafuzoff I, Iqbal K, Friden H, Adolfsson R & Winblad B (1987) Histopathological criteria for progressive dementia disorders: clinical-pathological correlation and classification by multivariate data analysis, Acta Neuropathol. 74, 209–25. [DOI] [PubMed] [Google Scholar]
- 9.Ballatore C, Brunden KR, Huryn DM, Trojanowski JQ, Lee VM & Smith AB 3rd (2012) Microtubule stabilizing agents as potential treatment for Alzheimer’s disease and related neurodegenerative tauopathies, J Med Chem. 55, 8979–96. [DOI] [PMC free article] [PubMed] [Google Scholar]
- 10.Ke YD, Suchowerska AK, van der Hoven J, De Silva DM, Wu CW, van Eersel J, Ittner A & Ittner LM (2012) Lessons from tau-deficient mice, International journal of Alzheimer’s disease. 2012, 873270. [DOI] [PMC free article] [PubMed] [Google Scholar]
- 11.Gong CX & Iqbal K (2008) Hyperphosphorylation of microtubule-associated protein tau: a promising therapeutic target for Alzheimer disease, Curr Med Chem. 15, 2321–8. [DOI] [PMC free article] [PubMed] [Google Scholar]
- 12.Hanger DP, Anderton BH & Noble W (2009) Tau phosphorylation: the therapeutic challenge for neurodegenerative disease, Trends Mol Med. 15, 112–9. [DOI] [PubMed] [Google Scholar]
- 13.Mazanetz MP & Fischer PM (2007) Untangling tau hyperphosphorylation in drug design for neurodegenerative diseases, Nat Rev Drug Discov. 6, 464–79. [DOI] [PubMed] [Google Scholar]
- 14.He Z, Guo JL, McBride JD, Narasimhan S, Kim H, Changolkar L, Zhang B, Gathagan RJ, Yue C, Dengler C, Stieber A, Nitla M, Coulter DA, Abel T, Brunden KR, Trojanowski JQ & Lee VM (2018) Amyloid-beta plaques enhance Alzheimer’s brain tau-seeded pathologies by facilitating neuritic plaque tau aggregation, Nat Med. 24, 29–38. [DOI] [PMC free article] [PubMed] [Google Scholar]
- 15.Clavaguera F, Akatsu H, Fraser G, Crowther RA, Frank S, Hench J, Probst A, Winkler DT, Reichwald J, Staufenbiel M, Ghetti B, Goedert M & Tolnay M (2013) Brain homogenates from human tauopathies induce tau inclusions in mouse brain, Proceedings of the National Academy of Sciences. 110, 9535–9540. [DOI] [PMC free article] [PubMed] [Google Scholar]
- 16.Peeraer E, Bottelbergs A, Van Kolen K, Stancu IC, Vasconcelos B, Mahieu M, Duytschaever H, Ver Donck L, Torremans A, Sluydts E, Van Acker N, Kemp JA, Mercken M, Brunden KR, Trojanowski JQ, Dewachter I, Lee VM & Moechars D (2015) Intracerebral injection of preformed synthetic tau fibrils initiates widespread tauopathy and neuronal loss in the brains of tau transgenic mice, Neurobiol Dis. 73, 83–95. [DOI] [PMC free article] [PubMed] [Google Scholar]
- 17.Lasagna-Reeves CA, Castillo-Carranza DL, Sengupta U, Clos AL, Jackson GR & Kayed R (2011) Tau oligomers impair memory and induce synaptic and mitochondrial dysfunction in wild-type mice, Mol Neurodegener. 6, 39. [DOI] [PMC free article] [PubMed] [Google Scholar]
- 18.Hu W, Zhang X, Tung YC, Xie S, Liu F & Iqbal K (2016) Hyperphosphorylation determines both the spread and the morphology of tau pathology, Alzheimers Dement. 12, 1066–1077. [DOI] [PubMed] [Google Scholar]
- 19.Dai CL, Hu W, Tung YC, Liu F, Gong CX & Iqbal K (2018) Tau passive immunization blocks seeding and spread of Alzheimer hyperphosphorylated Tau-induced pathology in 3 × Tg-AD mice, Alzheimer’s research & therapy. 10, 13. [DOI] [PMC free article] [PubMed] [Google Scholar]
- 20.Wang Y & Mandelkow E (2016) Tau in physiology and pathology, Nat Rev Neurosci. 17, 5–21. [DOI] [PubMed] [Google Scholar]
- 21.Jucker M & Walker LC (2018) Propagation and spread of pathogenic protein assemblies in neurodegenerative diseases, Nature neuroscience. 21, 1341–1349. [DOI] [PMC free article] [PubMed] [Google Scholar]
- 22.Clavaguera F, Tolnay M & Goedert M (2017) The Prion-Like Behavior of Assembled Tau in Transgenic Mice, Cold Spring Harb Perspect Med. 7. [DOI] [PMC free article] [PubMed] [Google Scholar]
- 23.Alonso AC, Grundke-Iqbal I & Iqbal K (1996) Alzheimer’s disease hyperphosphorylated tau sequesters normal tau into tangles of filaments and disassembles microtubules, Nat Med. 2, 783–7. [DOI] [PubMed] [Google Scholar]
- 24.Alonso AC, Zaidi T, Grundke-Iqbal I & Iqbal K (1994) Role of abnormally phosphorylated tau in the breakdown of microtubules in Alzheimer disease, Proc Natl Acad Sci U S A. 91, 5562–6. [DOI] [PMC free article] [PubMed] [Google Scholar]
- 25.Berger Z, Roder H, Hanna A, Carlson A, Rangachari V, Yue M, Wszolek Z, Ashe K, Knight J, Dickson D, Andorfer C, Rosenberry TL, Lewis J, Hutton M & Janus C (2007) Accumulation of pathological tau species and memory loss in a conditional model of tauopathy, J Neurosci. 27, 3650–62. [DOI] [PMC free article] [PubMed] [Google Scholar]
- 26.Flach K, Hilbrich I, Schiffmann A, Gartner U, Kruger M, Leonhardt M, Waschipky H, Wick L, Arendt T & Holzer M (2012) Tau oligomers impair artificial membrane integrity and cellular viability, J Biol Chem. 287, 43223–33. [DOI] [PMC free article] [PubMed] [Google Scholar]
- 27.Lasagna-Reeves CA, Castillo-Carranza DL, Guerrero-Muoz MJ, Jackson GR & Kayed R (2010) Preparation and characterization of neurotoxic tau oligomers, Biochemistry. 49, 10039–41. [DOI] [PubMed] [Google Scholar]
- 28.Lasagna-Reeves CA, Sengupta U, Castillo-Carranza D, Gerson JE, Guerrero-Munoz M, Troncoso JC, Jackson GR & Kayed R (2014) The formation of tau pore-like structures is prevalent and cell specific: possible implications for the disease phenotypes, Acta Neuropathol Commun. 2, 56. [DOI] [PMC free article] [PubMed] [Google Scholar]
- 29.Katsinelos T, Zeitler M, Dimou E, Karakatsani A, Muller HM, Nachman E, Steringer JP, Ruiz de Almodovar C, Nickel W & Jahn TR (2018) Unconventional Secretion Mediates the Trans-cellular Spreading of Tau, Cell Rep. 23, 2039–2055. [DOI] [PubMed] [Google Scholar]
- 30.Merezhko M, Brunello CA, Yan X, Vihinen H, Jokitalo E, Uronen RL & Huttunen HJ (2018) Secretion of Tau via an Unconventional Non-vesicular Mechanism, Cell Rep. 25, 2027–2035.e4. [DOI] [PubMed] [Google Scholar]
- 31.Guo JL & Lee VM (2014) Cell-to-cell transmission of pathogenic proteins in neurodegenerative diseases, Nat Med. 20, 130–8. [DOI] [PMC free article] [PubMed] [Google Scholar]
- 32.Goedert M, Eisenberg DS & Crowther RA (2017) Propagation of Tau Aggregates and Neurodegeneration, Annu Rev Neurosci. 40, 189–210. [DOI] [PubMed] [Google Scholar]
- 33.Clavaguera F, Bolmont T, Crowther RA, Abramowski D, Frank S, Probst A, Fraser G, Stalder AK, Beibel M, Staufenbiel M, Jucker M, Goedert M & Tolnay M (2009) Transmission and spreading of tauopathy in transgenic mouse brain, Nat Cell Biol. 11, 909–13. [DOI] [PMC free article] [PubMed] [Google Scholar]
- 34.Frost B, Jacks RL & Diamond MI (2009) Propagation of tau misfolding from the outside to the inside of a cell, J Biol Chem. 284, 12845–52. [DOI] [PMC free article] [PubMed] [Google Scholar]
- 35.Wu JW, Hussaini SA, Bastille IM, Rodriguez GA, Mrejeru A, Rilett K, Sanders DW, Cook C, Fu H, Boonen RA, Herman M, Nahmani E, Emrani S, Figueroa YH, Diamond MI, Clelland CL, Wray S & Duff KE (2016) Neuronal activity enhances tau propagation and tau pathology in vivo, Nature neuroscience. 19, 1085–92. [DOI] [PMC free article] [PubMed] [Google Scholar]
- 36.Wegmann S, Maury EA, Kirk MJ, Saqran L, Roe A, DeVos SL, Nicholls S, Fan Z, Takeda S, Cagsal-Getkin O, William CM, Spires-Jones TL, Pitstick R, Carlson GA, Pooler AM & Hyman BT (2015) Removing endogenous tau does not prevent tau propagation yet reduces its neurotoxicity, Embo j. [DOI] [PMC free article] [PubMed] [Google Scholar]
- 37.Wittmann CW, Wszolek MF, Shulman JM, Salvaterra PM, Lewis J, Hutton M & Feany MB (2001) Tauopathy in Drosophila: neurodegeneration without neurofibrillary tangles, Science. 293, 711–4. [DOI] [PubMed] [Google Scholar]
- 38.Gerson JE, Castillo-Carranza DL & Kayed R (2014) Advances in therapeutics for neurodegenerative tauopathies: moving toward the specific targeting of the most toxic tau species, ACS Chem Neurosci. 5, 752–69. [DOI] [PubMed] [Google Scholar]
- 39.Sui D, Xu X, Ye X, Liu M, Mianecki M, Rattanasinchai C, Buehl C, Deng X & Kuo MH (2015) Protein Interaction Module-assisted Function X (PIMAX) Approach to Producing Challenging Proteins Including Hyperphosphorylated Tau and Active CDK5/p25 Kinase Complex, Mol Cell Proteomics. 14, 251–62. [DOI] [PMC free article] [PubMed] [Google Scholar]
- 40.Alonso A, Zaidi T, Novak M, Grundke-Iqbal I & Iqbal K (2001) Hyperphosphorylation induces self-assembly of tau into tangles of paired helical filaments/straight filaments, Proc Natl Acad Sci U S A. 98, 6923–8. [DOI] [PMC free article] [PubMed] [Google Scholar]
- 41.Perez M, Valpuesta JM, Medina M, Montejo de Garcini E & Avila J (1996) Polymerization of tau into filaments in the presence of heparin: the minimal sequence required for tau-tau interaction, J Neurochem. 67, 1183–90. [DOI] [PubMed] [Google Scholar]
- 42.Wilson DM & Binder LI (1997) Free fatty acids stimulate the polymerization of tau and amyloid beta peptides. In vitro evidence for a common effector of pathogenesis in Alzheimer’s disease, Am J Pathol. 150, 2181–95. [PMC free article] [PubMed] [Google Scholar]
- 43.Falcon B, Cavallini A, Angers R, Glover S, Murray TK, Barnham L, Jackson S, O’Neill MJ, Isaacs AM, Hutton ML, Szekeres PG, Goedert M & Bose S (2015) Conformation determines the seeding potencies of native and recombinant Tau aggregates, J Biol Chem. 290, 1049–65. [DOI] [PMC free article] [PubMed] [Google Scholar]
- 44.Crowe A, James MJ, Lee VM, Smith AB 3rd, Trojanowski JQ, Ballatore C & Brunden KR (2013) Aminothienopyridazines and Methylene Blue Affect Tau Fibrillization via Cysteine Oxidation, J Biol Chem. 288, 11024–37. [DOI] [PMC free article] [PubMed] [Google Scholar]
- 45.Augustinack JC, Schneider A, Mandelkow EM & Hyman BT (2002) Specific tau phosphorylation sites correlate with severity of neuronal cytopathology in Alzheimer’s disease, Acta Neuropathol. 103, 26–35. [DOI] [PubMed] [Google Scholar]
- 46.Barghorn S & Mandelkow E (2002) Toward a unified scheme for the aggregation of tau into Alzheimer paired helical filaments, Biochemistry. 41, 14885–96. [DOI] [PubMed] [Google Scholar]
- 47.Goedert M (2016) The ordered assembly of tau is the gain-of-toxic function that causes human tauopathies, Alzheimers Dement. 12, 1040–1050. [DOI] [PubMed] [Google Scholar]
- 48.Khatoon S, Grundke-Iqbal I & Iqbal K (1994) Levels of normal and abnormally phosphorylated tau in different cellular and regional compartments of Alzheimer disease and control brains, FEBS Lett. 351, 80–4. [DOI] [PubMed] [Google Scholar]
- 49.Kopke E, Tung YC, Shaikh S, Alonso AC, Iqbal K & Grundke-Iqbal I (1993) Microtubule-associated protein tau. Abnormal phosphorylation of a non-paired helical filament pool in Alzheimer disease, J Biol Chem. 268, 24374–84. [PubMed] [Google Scholar]
- 50.Barghorn S, Biernat J & Mandelkow E (2005) Purification of recombinant tau protein and preparation of Alzheimer-paired helical filaments in vitro, Methods Mol Biol. 299, 35–51. [DOI] [PubMed] [Google Scholar]
- 51.Crowe A, Ballatore C, Hyde E, Trojanowski JQ & Lee VM (2007) High throughput screening for small molecule inhibitors of heparin-induced tau fibril formation, Biochem Biophys Res Commun. 358, 1–6. [DOI] [PMC free article] [PubMed] [Google Scholar]
- 52.Soeda Y, Yoshikawa M, Almeida OF, Sumioka A, Maeda S, Osada H, Kondoh Y, Saito A, Miyasaka T, Kimura T, Suzuki M, Koyama H, Yoshiike Y, Sugimoto H, Ihara Y & Takashima A (2015) Toxic tau oligomer formation blocked by capping of cysteine residues with 1,2-dihydroxybenzene groups, Nat Commun. 6, 10216. [DOI] [PMC free article] [PubMed] [Google Scholar]
- 53.Schweers O, Mandelkow EM, Biernat J & Mandelkow E (1995) Oxidation of cysteine-322 in the repeat domain of microtubule-associated protein tau controls the in vitro assembly of paired helical filaments, Proc Natl Acad Sci U S A. 92, 8463–7. [DOI] [PMC free article] [PubMed] [Google Scholar]
- 54.Jicha GA, Bowser R, Kazam IG & Davies P (1997) Alz-50 and MC-1, a new monoclonal antibody raised to paired helical filaments, recognize conformational epitopes on recombinant tau, J Neurosci Res. 48, 128–32. [DOI] [PubMed] [Google Scholar]
- 55.Rankin CA, Sun Q & Gamblin TC (2007) Tau phosphorylation by GSK-3beta promotes tangle-like filament morphology, Mol Neurodegener. 2, 12. [DOI] [PMC free article] [PubMed] [Google Scholar]
- 56.Tepper K, Biernat J, Kumar S, Wegmann S, Timm T, Hubschmann S, Redecke L, Mandelkow EM, Muller DJ & Mandelkow E (2014) Oligomer formation of tau protein hyperphosphorylated in cells, J Biol Chem. 289, 34389–407. [DOI] [PMC free article] [PubMed] [Google Scholar]
- 57.Kuret J, Congdon EE, Li G, Yin H, Yu X & Zhong Q (2005) Evaluating triggers and enhancers of tau fibrillization, Microsc Res Tech. 67, 141–55. [DOI] [PubMed] [Google Scholar]
- 58.Fancy DA & Kodadek T (1999) Chemistry for the analysis of protein-protein interactions: rapid and efficient cross-linking triggered by long wavelength light, Proc Natl Acad Sci U S A. 96, 6020–4. [DOI] [PMC free article] [PubMed] [Google Scholar]
- 59.von Bergen M, Barghorn S, Li L, Marx A, Biernat J, Mandelkow EM & Mandelkow E (2001) Mutations of tau protein in frontotemporal dementia promote aggregation of paired helical filaments by enhancing local beta-structure, J Biol Chem. 276, 48165–74. [DOI] [PubMed] [Google Scholar]
- 60.Li H, Lantz R & Du D (2019) Vibrational Approach to the Dynamics and Structure of Protein Amyloids, Molecules (Basel, Switzerland). 24. [DOI] [PMC free article] [PubMed] [Google Scholar]
- 61.Li B, Chohan MO, Grundke-Iqbal I & Iqbal K (2007) Disruption of microtubule network by Alzheimer abnormally hyperphosphorylated tau, Acta Neuropathol. 113, 501–11. [DOI] [PMC free article] [PubMed] [Google Scholar]
- 62.Alonso AD, Di Clerico J, Li B, Corbo CP, Alaniz ME, Grundke-Iqbal I & Iqbal K (2010) Phosphorylation of tau at Thr212, Thr231, and Ser262 combined causes neurodegeneration, J Biol Chem. 285, 30851–60. [DOI] [PMC free article] [PubMed] [Google Scholar]
- 63.Koopman G, Reutelingsperger CP, Kuijten GA, Keehnen RM, Pals ST & van Oers MH (1994) Annexin V for flow cytometric detection of phosphatidylserine expression on B cells undergoing apoptosis, Blood. 84, 1415–20. [PubMed] [Google Scholar]
- 64.Islam MT (2017) Oxidative stress and mitochondrial dysfunction-linked neurodegenerative disorders, Neurological research. 39, 73–82. [DOI] [PubMed] [Google Scholar]
- 65.Robinson KM, Janes MS, Pehar M, Monette JS, Ross MF, Hagen TM, Murphy MP & Beckman JS (2006) Selective fluorescent imaging of superoxide in vivo using ethidium-based probes, Proc Natl Acad Sci U S A. 103, 15038–43. [DOI] [PMC free article] [PubMed] [Google Scholar]
- 66.Olivieri G, Baysang G, Meier F, Müller-Spahn F, Stähelin HB, Brockhaus M & Brack C (2001) N-acetyl-L-cysteine protects SHSY5Y neuroblastoma cells from oxidative stress and cell cytotoxicity: effects on beta-amyloid secretion and tau phosphorylation, J Neurochem. 76, 224–33. [DOI] [PubMed] [Google Scholar]
- 67.Chonpathompikunlert P, Han J, Toh K, Isoda H & Nagasaki Y (2011) TEMPOL protects human neuroblastoma SH-SY5Y cells against β-amyloid-induced cell toxicity, European journal of pharmacology. 650, 544–9. [DOI] [PubMed] [Google Scholar]
- 68.Martínez MA, Rodríguez JL, Lopez-Torres B, Martínez M, Martínez-Larrañaga MR, Maximiliano JE, Anadón A & Ares I (2020) Use of human neuroblastoma SH-SY5Y cells to evaluate glyphosate-induced effects on oxidative stress, neuronal development and cell death signaling pathways, Environment international. 135, 105414. [DOI] [PubMed] [Google Scholar]
- 69.Yoshida H & Goedert M (2006) Sequential phosphorylation of tau protein by cAMP-dependent protein kinase and SAPK4/p38delta or JNK2 in the presence of heparin generates the AT100 epitope, J Neurochem. 99, 154–64. [DOI] [PubMed] [Google Scholar]
- 70.Russell CL, Koncarevic S & Ward MA (2014) Post-translational modifications in Alzheimer’s disease and the potential for new biomarkers, J Alzheimers Dis. 41, 345–64. [DOI] [PubMed] [Google Scholar]
- 71.Fitzpatrick AWP, Falcon B, He S, Murzin AG, Murshudov G, Garringer HJ, Crowther RA, Ghetti B, Goedert M & Scheres SHW (2017) Cryo-EM structures of tau filaments from Alzheimer’s disease, Nature. 547, 185–190. [DOI] [PMC free article] [PubMed] [Google Scholar]
- 72.Lo Cascio F, Puangmalai N, Ellsworth A, Bucchieri F, Pace A, Palumbo Piccionello A & Kayed R (2019) Toxic Tau Oligomers Modulated by Novel Curcumin Derivatives, Scientific reports. 9, 19011. [DOI] [PMC free article] [PubMed] [Google Scholar]
- 73.DeTure MA & Dickson DW (2019) The neuropathological diagnosis of Alzheimer’s disease, Mol Neurodegener. 14, 32. [DOI] [PMC free article] [PubMed] [Google Scholar]
- 74.Manczak M & Reddy PH (2012) Abnormal interaction of VDAC1 with amyloid beta and phosphorylated tau causes mitochondrial dysfunction in Alzheimer’s disease, Hum Mol Genet. 21, 5131–46. [DOI] [PMC free article] [PubMed] [Google Scholar]
- 75.He Z, McBride JD, Xu H, Changolkar L, Kim SJ, Zhang B, Narasimhan S, Gibbons GS, Guo JL, Kozak M, Schellenberg GD, Trojanowski JQ & Lee VM (2020) Transmission of tauopathy strains is independent of their isoform composition, Nat Commun. 11, 7. [DOI] [PMC free article] [PubMed] [Google Scholar]
- 76.Cook C, Stankowski JN, Carlomagno Y, Stetler C & Petrucelli L (2014) Acetylation: a new key to unlock tau’s role in neurodegeneration, Alzheimer’s research & therapy. 6, 29. [DOI] [PMC free article] [PubMed] [Google Scholar]
- 77.Yuzwa SA & Vocadlo DJ (2014) O-GlcNAc and neurodegeneration: biochemical mechanisms and potential roles in Alzheimer’s disease and beyond, Chem Soc Rev. 43, 6839–58. [DOI] [PubMed] [Google Scholar]
- 78.Wang JZ, Grundke-Iqbal I & Iqbal K (1996) Glycosylation of microtubule-associated protein tau: an abnormal posttranslational modification in Alzheimer’s disease, Nat Med. 2, 871–5. [DOI] [PubMed] [Google Scholar]
- 79.Despres C, Byrne C, Qi H, Cantrelle FX, Huvent I, Chambraud B, Baulieu EE, Jacquot Y, Landrieu I, Lippens G & Smet-Nocca C (2017) Identification of the Tau phosphorylation pattern that drives its aggregation, Proc Natl Acad Sci U S A. 114, 9080–9085. [DOI] [PMC free article] [PubMed] [Google Scholar]
- 80.Wang JZ, Grundke-Iqbal I & Iqbal K (2007) Kinases and phosphatases and tau sites involved in Alzheimer neurofibrillary degeneration, The European journal of neuroscience. 25, 59–68. [DOI] [PMC free article] [PubMed] [Google Scholar]
- 81.Liu NY, Lee HH, Chang ZF & Tsay YG (2015) Examination of segmental average mass spectra from liquid chromatography-tandem mass spectrometric (LC-MS/MS) data enables screening of multiple types of protein modifications, Analytica chimica acta. 892, 115–22. [DOI] [PubMed] [Google Scholar]
- 82.Tyanova S, Temu T & Cox J (2016) The MaxQuant computational platform for mass spectrometry-based shotgun proteomics, Nat Protoc. 11, 2301–2319. [DOI] [PubMed] [Google Scholar]
Associated Data
This section collects any data citations, data availability statements, or supplementary materials included in this article.