

Abstract
The COVID-19 pandemic has become a major worldwide crisis. Although respiratory symptoms are a key feature of the disease, many people who are hospitalized with COVID-19 also suffer acute kidney injury, a condition that exacerbates patient mortality and may have to be treated through renal replacement therapy. Much of the focus on hospital capacity during the pandemic has centered on the availability of ventilators. However, supplies for dialysis treatment, including dialysate, have also run dangerously low in hospitals at the epicenter of the pandemic. Therefore, there is an urgent need to develop materials that can efficiently and rapidly regenerate dialysate, removing toxins and restoring electrolyte concentrations so that this vital resource remains readily available. In this work, Ti3C2Tx, a two-dimensional transition metal carbide (MXene) that is known to efficiently adsorb urea, was used to remove creatinine and uric acid from an aqueous solution and dialysate, with a maximum adsorption capacity of 45.7 and 17.0 mg/g, respectively. We systematically analyzed and modelled the adsorption kinetics, isotherms, and thermodynamics, thus determining the rate-limiting step and adsorption mechanism. A fixed-bed column loaded with Ti3C2Tx was designed to further evaluate the adsorption performance under continuous fluid-flow conditions, mirroring conditions of continuous renal replacement therapy modalities. The maximum capacity and 50% breakthrough volume were calculated to further approach the practical application of Ti3C2Tx for removal of uremic toxins. Our findings suggest that Ti3C2Tx has the potential to be used as an efficient sorbent for the regeneration of dialysate, allowing for accelerated dialysate regeneration by removing filtered toxins and leading to more portable dialysis devices.
Keywords: MXene, adsorption, kinetics, uremic toxins, dialysate
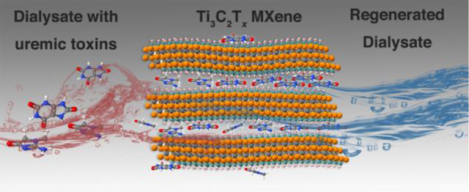
Graphical Abstract
Early studies of patients with COVID-19 have found a high frequency of kidney function abnormalities.1 A study of more than 700 patients in one of Wuhan’s hospitals showed that 43.9% of them had proteinuria and 26.7% had hematuria. The prevalence of elevated serum creatinine, elevated blood urea nitrogen and estimated glomerular filtration were 14.4, 13.1 and 13.1%, respectively. Acute kidney injury was recorded in 5.1% patients in that study and is related to in-hospital mortality.2 These studies show the high frequency of kidney disease in admitted patients and the high rate of development of acute kidney injuries during hospitalization in COVID-19 patients.2 Concerningly, dialysate, the balanced fluid that is required to deliver life-saving dialysis treatments for patients with kidney failure, has been in increasingly short supply in hospitals that have been hard-hit by the COVID-19 pandemic, leading physicians to seek solutions including the rationing of dialysis care.
In a healthy state, human kidneys filter approximately 180 liters of blood every twenty-four hours.3 This constant filtration of human blood is necessary to achieve homeostasis of fluids and electrolytes in the human body, in addition to the removal of toxins. Every year, over 100,000 people in the United States experience kidney failure, and among these individuals, facility-based hemodialysis is the most common treatment modality. Hemodialysis removes uremic toxins, electrolytes, and excess water from the blood using the concentration gradient across a semipermeable membrane to transfer these molecules into a balanced dialysate fluid.4 Unlike physiologic kidney function, conventional hemodialysis treatment filters the blood thrice-weekly in specialized facilities. Although life-saving, facility-based hemodialysis treatments utilize large, cumbersome machines and require hundreds of liters of dialysates per treatment.5 These requirements are likely to limit the ability to provide hemodialysis treatments to large numbers of patients during a pandemic. The risk of contracting COVID-19 is an additional barrier to providing care to patients who currently rely on facility-based hemodialysis, who must have repeated close contact with medical staff and other patients.6 In light of these facts, being able to recycle dialysate instead of discarding it is urgent. Technologies need to be developed to minimize the requirement to deliver dialysis treatment under a variety of conditions, specifically home-based dialysis treatments, such as the Wearable Artificial Kidney (WAK), thereby making out-center treatment widely available.
An ideal dialysate regeneration unit should eliminate uremic toxins from the spent dialysis solution to maintain an optimized concentration gradient to allow the dialyzer to filter uremic toxins continuously.7 In this context, the main substances that need to be removed from the dialysate include urea, creatinine, uric acid, p-cresol, phosphates, and potassium.8 The recent regeneration module, REDY (Recirculating DialYsis) system, combines sorbent and enzyme technology, and is the basis for many contemporary WAK prototypes.9 The REDY regeneration unit consists of multiple sorbent layers: activated carbon, urease, zirconium phosphate, and finally zirconium oxide and zirconium carbonate to remove organic compounds (e. g., creatinine and uric acid), urea, cations (e. g., potassium, ammonium), and phosphates, respectively.10 However, the drawbacks to this method include the indiscriminate adsorption of activated carbon, the complexity of storage and preparation of immobilized urease, as well as the high cost of zirconium phosphate.7 Additionally, an ongoing and major challenge is to make the dialysate regeneration system light enough and compact enough to be portable. To address these problems, a sorbent is required with higher adsorption capacity, in addition to a task-specific internal structure and controllable sorbent surface chemistry. Thus, while wearable and portable dialysis technologies could be critical to the care of COVID-19 patients, it is crucial to their function that efficient sorbents be developed in order for them to properly remove uremic toxins from the patient.
MXenes are a large family of two-dimensional (2D) materials with the general structure Mn+1XnTx, where M is an early transition metal (such as Ti, V, Nb, Mo, etc.), X is C and/or N, Tx represents the surface terminations, and n=1–4.11–13 MXenes are usually produced via selective etching of their parent Mn+1AXn (MAX phase) precursor, where, A is typically Al.14 Ti3C2Tx was the first MXene reported in 2011 and is also the most studied member of the MXene family.15,16 It is synthesized in a scalable manner through topochemical extraction of aluminum from Ti3AlC2 by fluoride-containing solutions,17 resulting in particles of several microns in lateral size made of stacked layers of 1-nm-thick 2D sheets (Figure 1a, b). In a 2D sheet of Ti3C2Tx, three layers of Ti atoms are interleaved with two layers of carbon atoms, and surface terminations, such as −OH, −O− and −F, are bonded to the outer Ti layers (Figure 1c). Furthermore, Ti3C2Tx and several other MXenes have been shown to be biocompatible and have already been used in biosensors, bioimaging probes, photothermal therapy and theranostics.18,19
Figure 1.
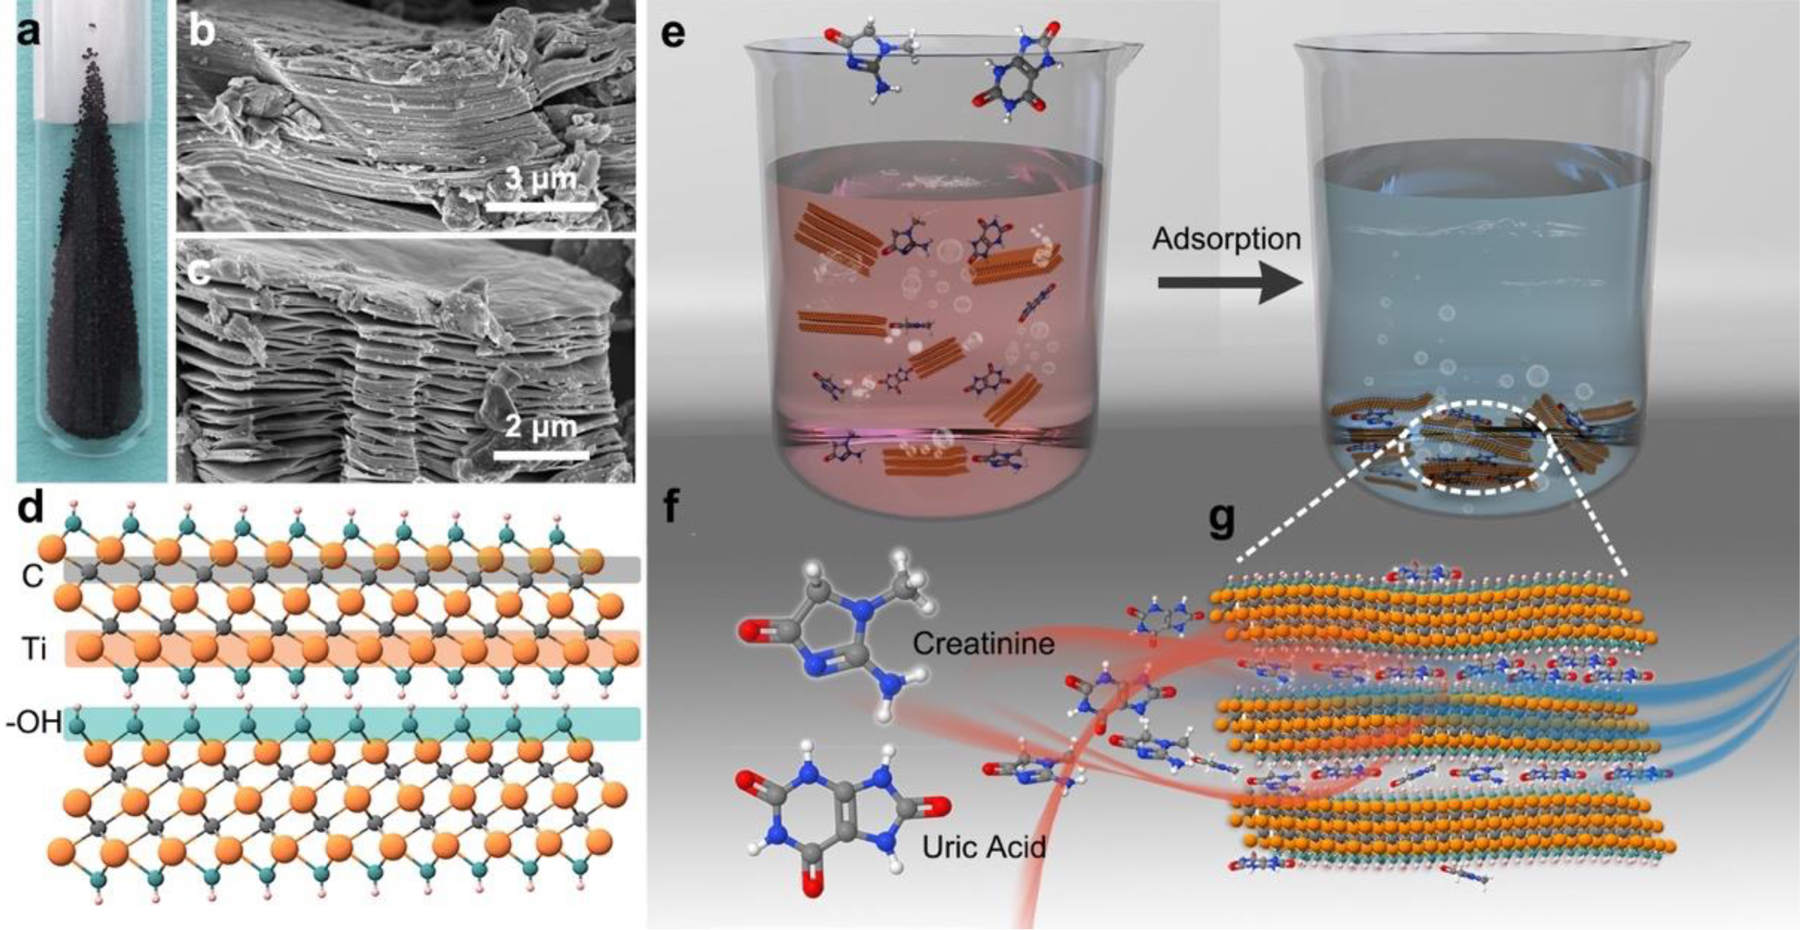
Schematic representation of Ti3C2Tx, creatinine and uric acid and their adsorption process. (a) Digital photograph of Ti3C2Tx-10HF MXene powder. (b) and (c) Scanning electron microscopy image of multilayer Ti3C2Tx-10HF (b) and Ti3C2Tx-30HF (c) powder. (d) Schematic of Ti3C2Tx (Tx = -OH) structure. (e) Schematic showing removal of uremic toxins using Ti3C2Tx as an adsorbent. (f) Molecular structures of the target uremic toxins. (g) Schematic of Ti3C2Tx sheets intercalated with creatinine and/or uric acid molecules.
This structural uniqueness, hydrophilic nature and abundant active sites render MXenes a potentially effective adsorbent. Much like other layered nanomaterials, MXenes can be intercalated with water, organic molecules, or metal ions. Many molecules, such as hydrazine, urea, dimethyl sulfoxide, and a variety of cations including Li+, Na+, K+, and NH4+ can readily and spontaneously intercalate between negatively charged Ti3C2Tx layers in aqueous solutions.20–23 It is known that titanium (Ti) has a high sorption affinity toward many molecular or ionic species.24,25 The Ti=O, Ti−OH and Ti−F bonds formed on MXene basal planes provide active sites for hydrogen bonding various adsorbates.24 Furthermore, the sorption performance can further be tuned by modification of the surface terminations, enabling improved adsorption capacity, and selectivity toward specific uremic toxins.
Recently, we pioneered the efficient removal of urea from an aqueous solution and spent dialysate using MXenes and ensured their safety for blood-contacting applications.26 However, since there are almost 90 solutes that have been identified as uremic toxins,27 a multi-sorbent cartridge is utilized to regenerate the spent dialysate in the current WAK prototype.10 Therefore, it is imperative to investigate the affinity of Ti3C2Tx towards a wider range of uremic toxins in order to determine if it can replace current multiple-adsorbent dialysate regeneration systems. In addition, to understand and optimize the dialysate adsorption process with Ti3C2Tx, it is essential to investigate the fundamental kinetics and thermodynamic mechanisms. More importantly, considering that dialyzers work in a continuous condition, evaluating the adsorption performance under dynamic conditions is crucial to designing an effective sorbent cartridge.
Herein, we present data on the removal of two important uremic solutes, creatinine (C4H7N3O) and uric acid (C5H4N4O3), using Ti3C2Tx (Figure 1d and e). Using two HF concentrations (10 and 30 wt.%) to produce Ti3C2Tx with different surface terminations, the effect of surface groups on their adsorption performance was studied. We calculated the kinetic and thermodynamic parameters to elucidate the adsorption mechanism. Furthermore, we tested the continuous adsorption performance in an aqueous solution and simulated dialysate under dynamic conditions similar to a WAK, and used the Thomas and Yoon-Nelson models to predict the breakthrough adsorption process. We expect that these studies will lead to a sorbent enabling the regeneration of dialysate and WAK for use in the care of COVID-19 patients with kidney failure.
RESULTS AND DISCUSSION
Creatinine batch adsorption.
The adsorbent dose, known as the solid-to-liquid ratio, is one of the most important variables to determine the adsorbent capacity in a given adsorbate solution. The dose-dependent experiments were firstly carried out to determine a reasonable adsorbent dose in the MXene-creatinine system for further study. The effect of adsorbent dose on the removal of creatinine is shown in Figure 2a. For Ti3C2Tx-10HF adsorbents, the removal efficiency of creatinine increased significantly from 27.0% to 99.1% with an increasing dose from 20 to 100 mg; after the critical dose (100 mg), further increasing the concentration had no apparent effect on creatinine removal efficiency. In addition, the characteristic UV-Vis absorption peaks of creatinine at 232 nm gradually decreased as the Ti3C2Tx-10HF adsorbent dose was increased and was not observed when the adsorbent was over 100 mg (Figure 2b), confirming that the creatinine has been removed. By contrast, the removal efficiency of creatinine is lower when using Ti3C2Tx-30HF, which has a larger fluoride coverage on the surface, at the same adsorbent dose, with a removal efficiency ranging from 12.2% to 99.1% by varying the adsorbent between 20 to 200 mg. These results indicate that the Ti3C2Tx-10HF removes creatinine more efficiently than Ti3C2Tx-30HF.
Figure 2.
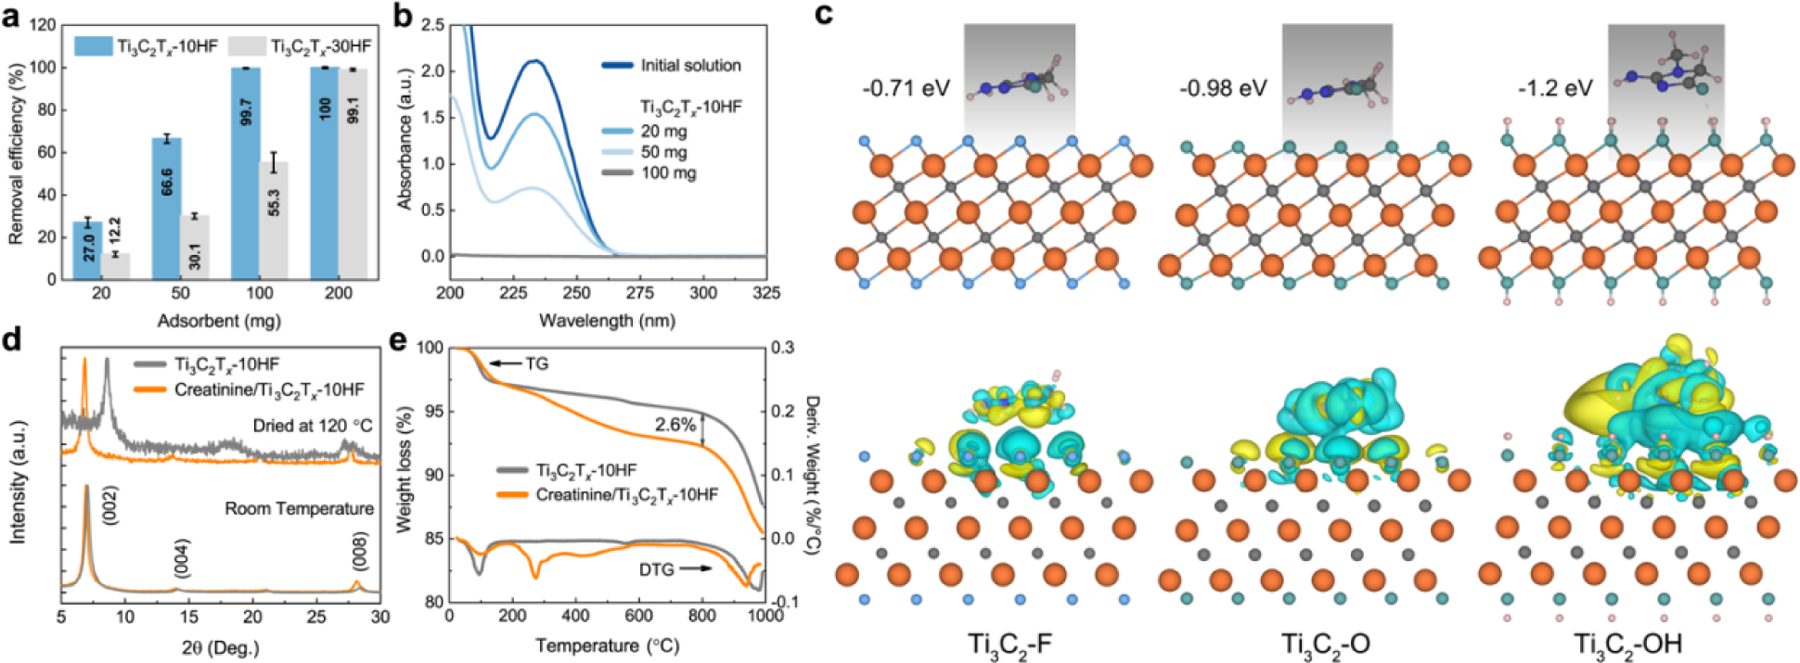
Adsorption mechanism of creatinine by Ti3C2Tx from an aqueous solution and creatinine-Ti3C2Tx interaction computations. (a) Creatinine removal efficiency (%) from aqueous solution with initial concentration 100 mg/L and volume 30 mL using different doses of Ti3C2Tx-10HF and Ti3C2Tx-30HF. (b) Changes in absorbance of creatinine aqueous solution (3 times dilution) after adsorption with different doses of Ti3C2Tx-10HF (initial concentration 100 mg/L and volume 30 mL). (c) Binding energies and charge density for parallel configurations of creatinine on Ti3C2Tx surfaces with −OH, and −F terminations. (d) XRD patterns of pristine Ti3C2Tx-10HF and creatinine-adsorbed Ti3C2Tx vacuum-dried at room temperature (RT) and 120 °C. (e) Thermal gravimetric (TG) curves with weight loss derivative (DTG) for pristine Ti3C2Tx and creatinine-adsorbed Ti3C2Tx at initial creatinine concentration of 500 mg/L.
It is hypothesized that the higher affinity of Ti3C2Tx-10HF to creatinine comes from the surface terminations. MXenes etched by HF-containing solutions have mixed terminations of −OH, -O- and −F, with the general formula Mn+1XnOx(OH)yFz. Previously, it was shown that the surface terminations are highly dependent on the etching conditions. Generally, lower HF concentrations produce more hydroxyl and oxy terminations, with correspondingly less fluoride.11,28,29 For example, the proportion of functional groups was determined to be Ti3C2O0.13(OH)1.04F0.83 and Ti3C2O0.1(OH)0.8F1.1 for samples synthesized using 10 and 48 wt.% HF, respectively, following an atomic pair distribution function analysis.30 To understand the interactions between creatinine and Ti3C2Tx with different terminations, the binding energies (Eb) of creatinine absorption on purely - F terminated (Ti3C2F2) and -OH terminated (Ti3C2(OH)2) MXene were determined and compared by first-principle calculations. The Eb is defined as:
| (1) |
where EMXene+creatinine, EMXene, and Ecreatinine is the total energy of MXene with a creatinine molecule, MXene, and a creatinine molecule, respectively. The most stable adsorption configurations for the parallel orientation and their respective binding energies are shown in Figure 2c. The binding energy of adsorbing on Ti3C2(OH)2 (−1.2 eV) is much lower than that on Ti3C2F2 (−0.71 eV) and Ti3C2O2 (−0.98 eV), suggesting the most stable adsorption state is on the −OH terminated surface. The higher stability of creatinine on the Ti3C2(OH)2 surface is also supported by the enhanced charge transfer between creatinine and the Ti3C2(OH)2 surface (Figure 2c). Therefore, we conclude that Ti3C2Tx-10HF with a larger hydroxyl/oxy to fluoride ratio would have a stronger interaction with adsorbate molecules compared with Ti3C2Tx-30HF, thereby resulting in a higher adsorption capacity. Based on this, the Ti3C2Tx-10HF was selected as the adsorbent in the following studies.
X-ray diffraction (XRD) provides further evidence of the adsorption process/mechanism (Figure 2d). The XRD analysis of the pristine and creatinine-adsorbed Ti3C2Tx-10HF showed very similar patterns at room temperature, with the (002) peaks located at 7.04° and 6.93°, respectively. MXenes typically have co-intercalated water between the layers, therefore it is hard to observe other molecules with the water molecules present in the interlayer spaces of MXenes. To determine if the creatinine has intercalated, the pristine and creatinine-adsorbed samples were dried at 120 °C for 15 h in a vacuum oven to remove all intercalated water. Afterwards, the (002) peak of pristine Ti3C2Tx-10HF shifts to higher 2θ (8.61°), suggesting the intercalated water was removed. By contrast, the XRD pattern of creatinine-adsorbed Ti3C2Tx-10HF did not change substantially (6.87°) after drying. This suggests that the creatinine successfully intercalated between the layers.
We also performed thermal gravimetric (TG) analysis up to 1000 °C under He for pristine and creatinine-adsorbed Ti3C2Tx-10HF with the initial creatinine concentration of 500 mg/L (Figure 2e). Two regions of the weight loss were observed for Ti3C2Tx-10HF, one at around 100°C and the other above 800°C, which are related to thermal desorption of intercalated water and thermal transition of Ti3C2Tx-10HF.28 By contrast, the weight loss at 100°C of creatinine-adsorbed Ti3C2Tx-10HF is lower than that of the pristine MXene, an indication that water molecules between Ti3C2Tx layers were replaced by creatinine molecules. There is an additional weight loss between 250–500°C for the creatinine-adsorbed Ti3C2Tx-10HF, which is related to the thermal decomposition of creatinine. The weight loss of 2.6 wt.% was lower than the measured adsorption capacity (~45 mg/g), probably due to incomplete decomposition of creatinine and the cyclization reactions forming carbon phase on the surface of MXene.
Creatinine adsorption kinetics study.
Calculating the adsorption kinetics provides useful insight into the mass transfer mechanism of the adsorption process and the any rate-limiting steps within it. At the beginning, pseudo-first order and pseudo-second order adsorption reaction models31–34 were used to approximate the adsorption kinetics of creatinine by a Ti3C2Tx adsorbent, as shown in Figure 3a. Both of them originate from chemical reaction kinetics, describing the reaction orders of adsorption systems based on the concentration of the test solution and adsorbent capacity. The values of k and Qe, along with the correlation coefficient (R2) values, were calculated and listed in Table S1. The value of R2 for the pseudo-second order model is closest to 1, suggesting that it better describes the adsorption process of creatinine on Ti3C2Tx. One can tell from the kinetic adsorption curves that the equilibrium can be reached within 10 minutes, indicating a fast adsorption process (Figure 3a). The k constant is the time-scaling factor evaluating how fast the sorption equilibrium can be reached. Thus, the rate constant k extrapolated from the pseudo-second order model was used to evaluate the adsorption rate. The results show that the k value for Ti3C2Tx-10HF is significantly greater than that of Ti3C2Tx-30HF, suggesting that shorter time is required in this system to reach an equilibrium. In addition, the higher calculated equilibrium capacity, Qe value, also implies that Ti3C2Tx-10HF is capable of adsorbing more adsorbate compared to Ti3C2Tx-30HF. This observation emphasizes the role of the interactions between the Ti3C2Tx surface functionalities and creatinine molecules, despite the fact that Ti3C2Tx-30HF has a more open structure compared to Ti3C2Tx-10HF (Figure 1b, c).
Figure 3.
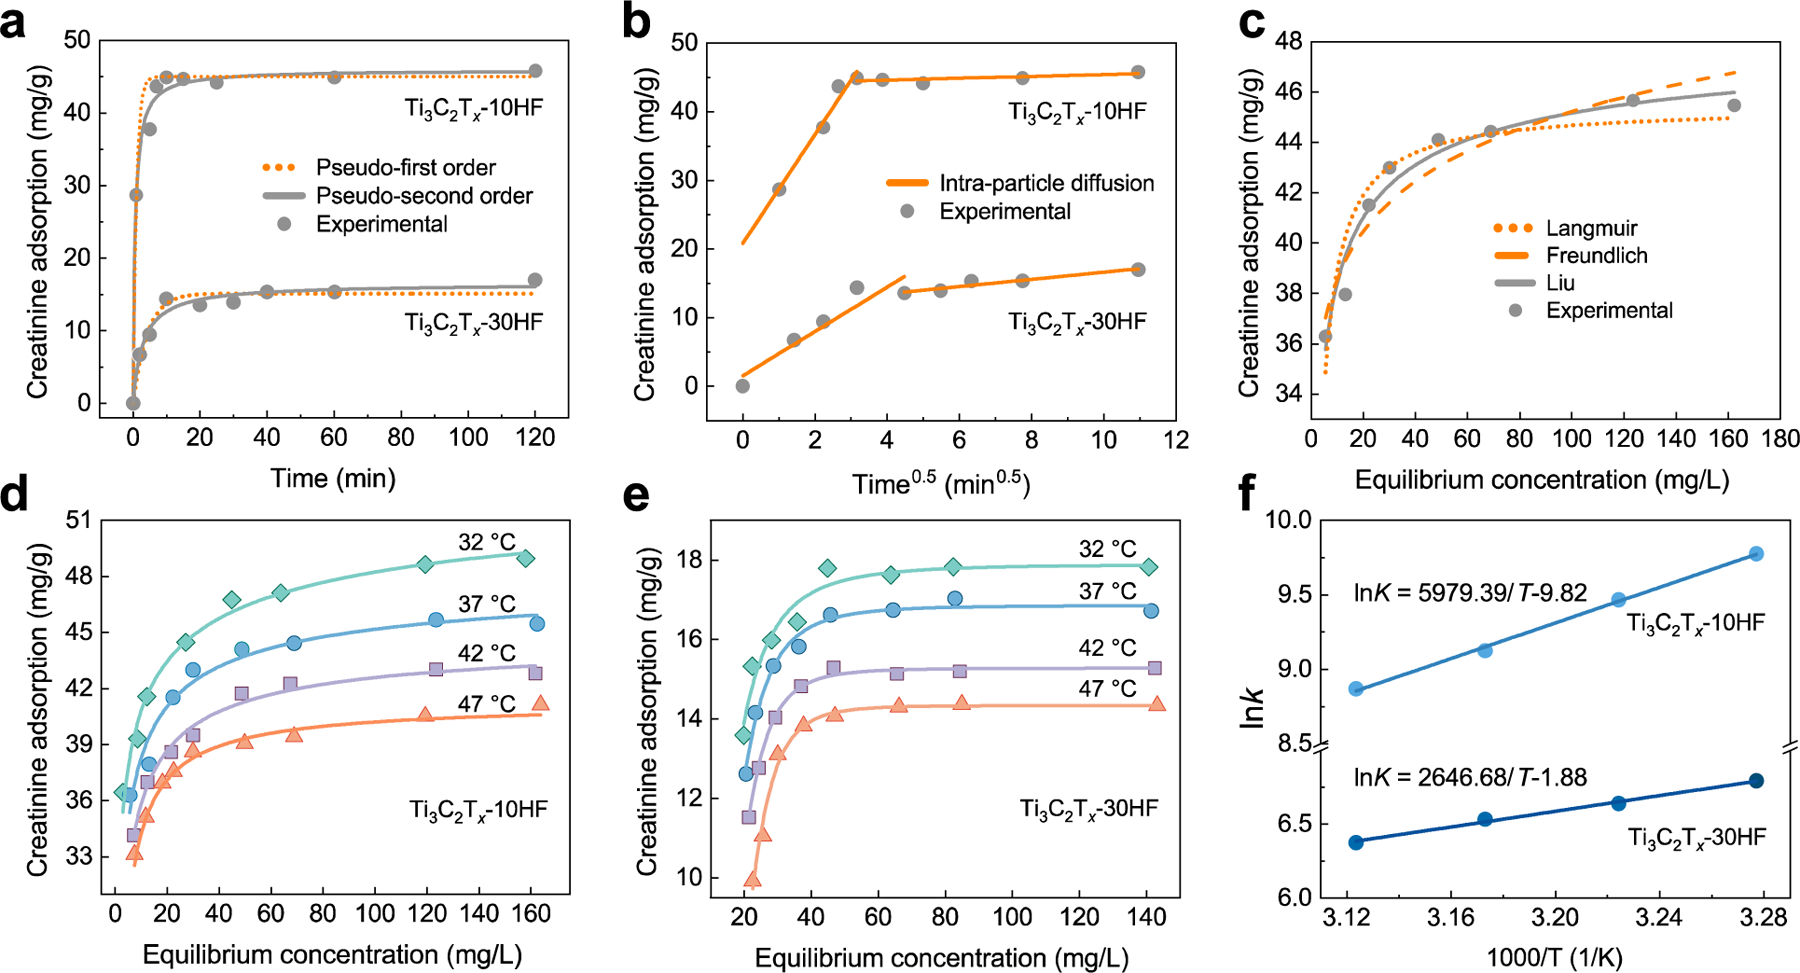
Adsorption of creatinine by Ti3C2Tx from an aqueous solution. (a) Kinetic studies of creatinine adsorption on Ti3C2Tx-10HF and Ti3C2Tx-30HF, and their fitted curves by pseudo-first (dotted line) and pseudo-second models (solid line). (b) Intra-particle diffusion plot for adsorption of creatinine. (c) Creatinine adsorption isotherms from aqueous solution by Ti3C2Tx-10HF at 37 °C and the curve fitted by Langmuir (dotted line), Freundlich (dashed line), and Liu (solid line) models. (d) and (e) Creatinine adsorption isotherms by Ti3C2Tx-10HF (d) and Ti3C2Tx-30HF at different temperatures and their fitted curves by Liu model. (f) Linear plot of ln(K) versus 1/T for adsorbent Ti3C2Tx-10HF and Ti3C2Tx-30HF.
In general, the adsorption mass transfer kinetics includes three steps: external diffusion (the transport of adsorbate from the boundary layer toward the external surface of the adsorbent), internal diffusion (the diffusion of the adsorbate from the exterior surface to the interior structure of the adsorbent), and adsorption on active sites by chemical reaction. The third step occurs rapidly and is not considered as rate-limiting. Our previous study of ions adsorption has shown the presence of both “shallow” and “deep” adsorption sites in the Ti3C2Tx particles.35 The shallow-adsorption sites are near the edges of the multilayer particles, which is corresponding to external diffusion process; and deep-adsorption sites are narrow slits in the particle’s interior, requiring diffusion to reach them (see Figure 1b). Thus, the adsorption of creatinine molecules on Ti3C2Tx may be controlled by the shallow (external) or deep (internal) adsorption.
To gain insight into the adsorption mechanism and rate-controlling steps, the intra-particle diffusion model34,36 was applied to fit the kinetic experimental results. In this model, the plot of Qt versus t0.5 will be linear if internal diffusion is involved in the adsorption process; and the internal diffusion is the only controlling step if the lines passes through the origin. Figure 3b shows the plots of Qt versus t0.5 for creatinine adsorbed on Ti3C2Tx-10HF and Ti3C2Tx-30HF, which consist of two linear portions with different slopes, and the intra-particle diffusion constant kid can be determined from the slope (Table S1). The first portion can be ascribed to the intra-particle diffusion, where the creatinine molecules intercalate (adsorb) between Ti3C2Tx layers. The second portion indicates the final equilibrium stage. The portion related to external diffusion was not observed, hence it is considered to be a rapid process and can be negligible due to the high affinity between creatinine and Ti3C2Tx. Therefore, the intra-particle diffusion was involved in the adsorption process. The linear portions did not pass through the origin for Ti3C2Tx-10HF, suggesting that intra-particle diffusion was not the only rate-limiting step; and the value of the intercept indicated the contribution of the initial surface sorption. By contrast, the plot for Ti3C2Tx-30HF is a straight line passing through the origin, which indicates the adsorption on Ti3C2Tx-30HF was controlled only by intra-particle diffusion. Additionally, the higher diffusion constant kid of Ti3C2Tx-10HF compared to Ti3C2Tx-30HF indicates that the adsorbate diffusion in Ti3C2Tx-10HF is faster, which is consistent with the results from the pseudo-second order model.
Creatinine adsorption isotherms and thermodynamic studies.
An adsorption isotherm describes the relationship between the amount of adsorbate (Qe) taken up by the adsorbent and the adsorbate concentration (Ce) remaining in the solution when equilibrium is reached. The parameters determined by adsorption equilibrium models give insight into the adsorption mechanism, surface properties of the adsorbent, and affinity between adsorbent and adsorbate. The adsorption isotherms of creatinine at the temperatures from 32 to 47 °C were constructed in order to determine the thermodynamic parameters. Figure 3c shows the equilibrium creatinine adsorption isotherms at the body temperature (37 °C) on Ti3C2Tx-10HF and the associated fitting using Langmuir, Freundlich and Liu models.37–39 Based on the curve fittings, the adsorption capacity Q0 along with the corresponding adsorption constant K and n were calculated for each model (Table S2). The Langmuir isotherm model was developed on the assumptions that adsorbates are adsorbed at a fixed number of energetically equivalent sites and each site can hold only one adsorbate species. Thus, a monolayer of the adsorbate is formed over the adsorbent surface when it gets saturated and the maximum adsorption capacity is achieved. The Freundlich isotherm model assumes that increasing amounts of adsorbate can be adsorbed on the adsorbent surface via multiple layers as the adsorbate concentration increases, and it is widely used to describe heterogeneous systems. Theoretically, an infinite amount of adsorption can occur following this model. The Liu isotherm model predicts that the adsorbent active sites cannot have the same energy and that adsorbate molecules prefer to occupy specific sites. It is a combination of the Langmuir and Freundlich isotherm models, but the monolayer assumption of the Langmuir model and the infinite adsorption assumption from the Freundlich model are ruled out.37–39
Because Ti3C2Tx has different surface terminations, as shown above (Figure 2e, f), the adsorbent active sites will not have the same binding energies, implying heterogeneous adsorption of creatinine on Ti3C2Tx. By comparing the regression coefficient (R2) values, the Liu isotherm model fits the obtained data better than either Langmuir or Freundlich model. In addition, Q0 calculated at 37 °C using the Liu models turns out to be 48.1 mg/g, which is similar to the measured adsorption capacity of creatinine by Ti3C2Tx-10HF (45.7 mg/g). The isotherm and curve fitting of Ti3C2Tx-30HF are shown in Figure S1. It is noteworthy that the maximum amount of creatinine adsorbed on Ti3C2Tx-10HF is higher than that on Ti3C2Tx-30HF (16.9 mg/g), which is consistent with the results of the kinetic studies.
To gain more information about the thermodynamic parameters for the Ti3C2Tx/adsorbate system, creatinine adsorption experiments were also conducted at 32, 37, 42, and 47 °C from aqueous solution. In the context of reaction thermodynamics, the Gibb’s free energy change (ΔG, kJ/mol) can be calculated by equation:
| (2) |
where R is the universal gas constant (8.314 J/mol·K), T is the absolute temperature (K), and Ke represents the equilibrium constant. As reported,40,41 the adsorption equilibrium constant K from the Liu isotherm model can be used to estimate the thermodynamic parameters instead of the equilibrium constant Ke. In addition to Gibb’s free energy change, the reaction enthalpy change (ΔH, kJ/mol) and entropy change (ΔS, J/mol·K) can be determined by the following equation:
| (3) |
Combining of equations 2 and 3 gives:
| (4) |
Thus, ΔH and ΔS can be calculated from the slope and intercept of the linear plot of ln(K) versus 1/T. Figure 3d, e shows the creatinine adsorption isotherms and experimental data fitting of the experimental data using Liu model at different temperatures for Ti3C2Tx-10HF and Ti3C2Tx-30HF. The corresponding adsorption capacity Q0 and adsorption constant K were calculated (Table S3). ΔG was estimated based on the adsorption constant K at different temperatures, and ΔH and ΔS were determined from plot of ln(K) to 1/T (Figure 3f). All thermodynamic results are summarized in Table S3. ΔG was negative at all the studied temperatures, indicating that adsorption is spontaneous due to being thermodynamically favorable. The ΔH was estimated to be −49.7 and −22.0 kJ/mol for Ti3C2Tx-10HF and Ti3C2Tx-30HF, and ΔS was 81.7 and 15.6 J/K·mol, respectively. The positive values of ΔS reflects the increased randomness at the adsorbent/adsorbate interface during adsorption. The negative values of ΔH indicate that the adsorption is an exothermic process, which in turn clarifies the reduced creatinine adsorption at higher temperature, as shown in Figure 3d, e. To some extent, the magnitude of enthalpy change may reflect the type of interaction in an adsorption process. Physical adsorption, such as van der Waals interactions and hydrogen bonding, is usually lower than 20 kJ/mol. Electrostatic interactions range from 20–80 kJ/mol and are generally referred to as physisorption. Chemisorption bond strengths generally fall into the range of 80–450 kJ/mol.42,43 A ΔH of −49.7 kJ/mol illustrates the strong interaction between creatinine and Ti3C2Tx-10HF, and electrostatic interaction will be the dominant force in creatinine adsorption.
The open structure of Ti3C2Tx-10HF (Figure 1c) may contribute to surface adsorption and lower ΔH. In addition, the acidic nature of MXene facilitates adsorption of positive creatinine molecules.26 The MXene surface is initially terminated by −OH and −O− groups, and hydroxyl groups on the titanium surface easily ionize H+ to form [Ti−O]−H+. Thus, positively charged creatinine (Cr+) molecules are attached to [Ti−O]− through electrostatic interaction, and H+ was released into solution system. The equation for H+ exchange is expressed as following:
pH measurements of creatinine solutions before and after adsorption show that adsorbate solutions were more acidic after adsorption (Table S4), confirming exchange of intercalated H+ by creatinine. Besides, hydrogen bonding also occurs between the −OH groups on the titanium surface and -N of the creatinine/uric acid by forming −OH⋯N. In this context, with the increase of −OH group in Ti3C2Tx-10HF compared to Ti3C2Tx-30HF, this adsorption role is further strengthening. This is consistent with our experimental and DFT calculation results (Figure 2c).
The pH value might affect the protonation degree of creatinine and the surface charge of Ti3C2Tx-10HF. Figure S2 shows the effect of pH on creatinine adsorption by Ti3C2Tx-10HF from 4–9 pH. The adsorption capacity increased sharply as the solution pH increased from 4 to 7 and then decreased slowly from pH 7 to 9. As discussed above, H+ exchange and electrostatic interaction are responsible for the creatinine adsorption. With the pH decreasing, the adsorption capacity decreased due to the weakness of electrostatic attraction. In a basic solution, the adsorption amount decreased slightly because cations can intercalate into Ti3C2Tx layers and occupy some of adsorption sites.20–23
To compare the adsorption performance of MXene with conventional activated carbon, we conducted dose-dependent experiments and kinetics studies using wood- and coal-based activated carbon under the same conditions. As shown in Figure S3a, b, the removal efficiency and adsorption rate are significantly lower for activated carbon than for Ti3C2Tx-10HF, even though activated carbon has a higher surface area and pore volume (Figure S4 and Table S5). This might be due to the highly polar surface of Ti3C2Tx terminated by −OH, −O− groups. Thermal gravimetric with mass spectrometry (TG-MS) analysis (Figure S5) shows that terminations −OH and −O− are more abundant for Ti3C2Tx compared to coal-based activated carbon. In addition, the higher bulk density of Ti3C2Tx (2–3 g/cm3) compared to activated carbon (~0.5 g/cm3) also decreases the required volume of sorbent (Figure S3c). In sum, the differences we observed between Ti3C2Tx and activated carbon suggest that the use of MXenes in dialysate adsorption might permit a lighter and smaller WAK system.
Adsorption of uric acid.
To explore the applicability of the Ti3C2Tx as an adsorbent for other type of uremic toxins, we carried out experiments to study the adsorption of uric acid by Ti3C2Tx-10HF. At first, the effect of adsorbent dose on removal efficiency was investigated by varying the adsorbent amount from 5 to 100 mg. As shown in Figure 4a, the removal efficiency of uric acid varied from 17.1 to 85.8% by increasing adsorbent doses from 5 to 20 mg, and 100% of the uric acid was removed when the dose exceeded 50 mg. The kinetic studies were conducted by adding Ti3C2Tx-10HF to uric acid solution with different shaking time (Figure 4b).
Figure 4.
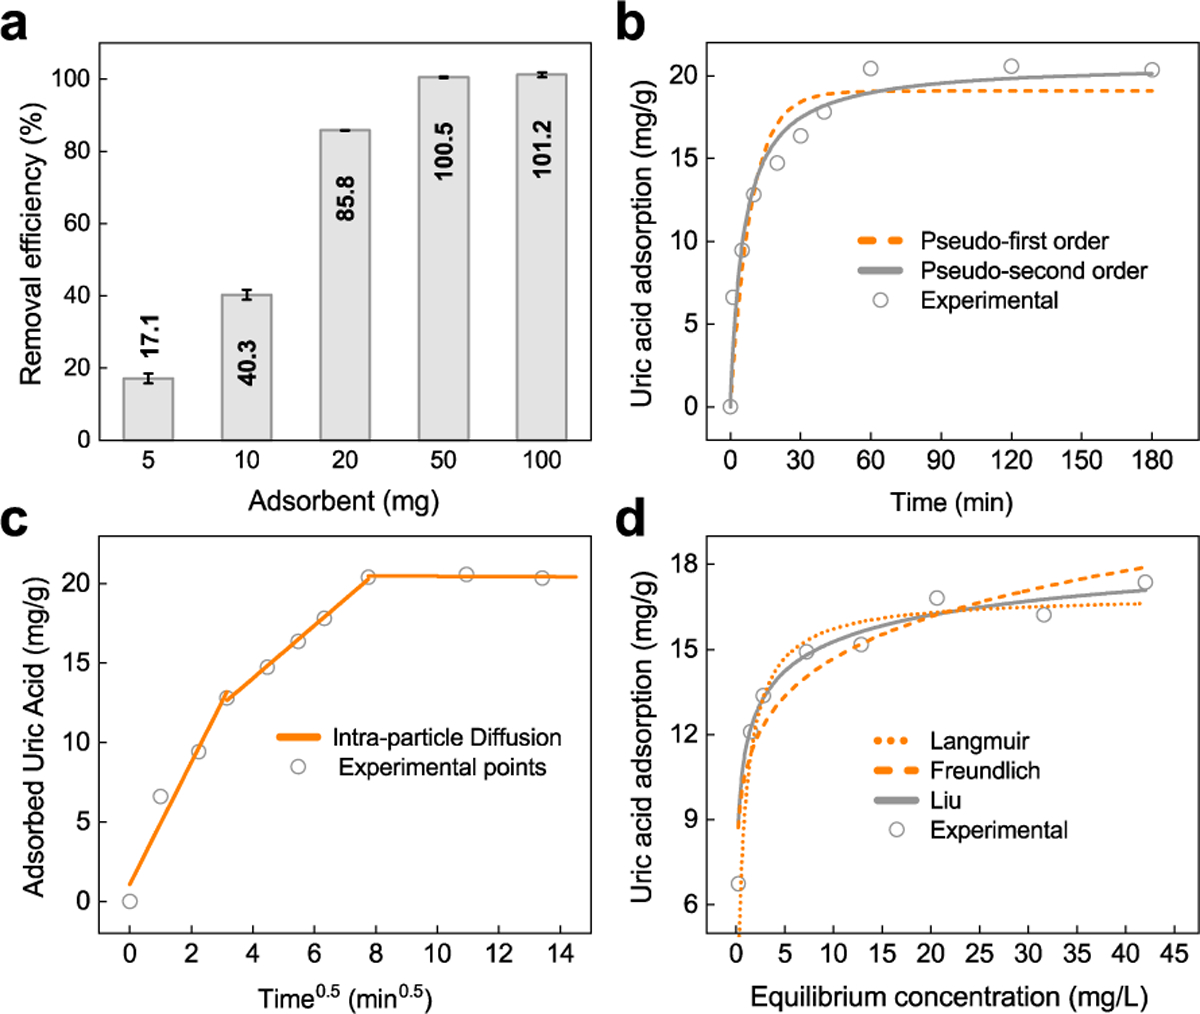
Adsorption of uric acid by Ti3C2Tx from aqueous solution. (a) Uric acid removal efficiency (%) from an aqueous solution with an initial concentration of 50 mg/L and volume 20 mL using different doses of Ti3C2Tx-10HF. (b) Kinetic adsorption studies and the simulated curves by pseudo-first order (dashed line) and pseudo-second order (solid line) models (10 mg Ti3C2Tx-10HF adsorbent, concentration of uric acid aqueous solution 50 mg/L and volume 20 mL). (c) Intra-particle diffusion plot for adsorption of uric acid. (d) Uric acid adsorption isotherm from aqueous solution on Ti3C2Tx-10HF at 37 °C and the curve fits by Langmuir (dotted line), Freundlich (dashed line), and Liu (solid line) models (10 mg Ti3C2Tx-10HF adsorbent and 20 mL of uric acid aqueous solution).
Similar to creatinine adsorption, the pseudo-second order model fits the data better than the pseudo-first order model, from which the adsorption rate constant k and equilibrium adsorption capacity Qe were calculated (Table S1). Using the pseudo-second order model, the adsorption capacity of uric acid was calculated to be 20.8 mg/g, which is close to the measured adsorption capacity (17.0 mg/g). The uric acid removal can also be seen from the decreased UV-Vis absorption peaks with an increase of the contact time between adsorbent/adsorbate (Figure S6). Besides, the intra-particle diffusion model was used to evaluate the adsorption process. The plots of Qt versus t0.5consist of three linear portions with different slopes (Figure 4c), indicating that the adsorption process involves at least three steps. The fast adsorption occurs initially on the exposed surfaces of Ti3C2Tx-10HF sheets, which is corresponding to the first linear portion. The second portion, with a lower kid value, was ascribed to intra-particle diffusion into narrow subnanometer slits between Ti3C2Tx sheets; it was the rate-controlling step. The third stage is the establishment of equilibrium. This is different from the creatinine situation (Figure 3b), where only the linear portion related to intra-particle diffusion was observed. Because the Ti3C2Tx flakes are negatively charged,11 they favor the adsorption of basic molecules. Considering that the acidity (pKa) of creatinine and uric acid is 12.3 and 5.6, respectively, the electrostatic attraction between creatinine and Ti3C2Tx is supposed to be stronger. Thus, it is assumed that the creatinine adsorption on external surface (shallow sites) is quite fast and instantaneous, thereby the portion corresponding to external diffusion was not observed.
Then, equilibrium studies were conducted to yield the adsorption isotherms by adding Ti3C2Tx-10HF to the uric acid aqueous solution with the different initial concentrations (20–200 mg/L). The experimental data was fitted using Freundlich, Langmuir, and Liu models, among which the Liu model presents the better fit in terms of higher regression coefficient (Figure 4d). The adsorption capacity and the corresponding adsorption constant K values for each model were calculated and listed in Table S2. Based on the fitting, the maximum adsorption capacity of Ti3C2Tx-10HF for uric acid was determined to be 18.0 mg/g from Liu model, which agrees with the experimental results (17.0 mg/g). It should be noted that the thermodynamic and kinetic parameters for uric acid (adsorption capacity, Qe, adsorption constant, K, and the rate constant, k) are lower than creatinine, indicating a weaker affinity between uric acid and Ti3C2Tx. Uric acid is overall negatively charged, which results in a weakness of electrostatic interaction. Thus, it can be deduced that hydrogen bonding (Ti−OH⋯N) and van der Waals interactions might be the dominant force in the uric acid adsorption process.
Adsorption of uremic toxins under dynamic conditions.
To further explore the potential use of Ti3C2Tx for the removal of uremic toxins under conditions similar to practical WAKs, we carried out a continuous adsorption study in a fixed-bed column using a homemade device (Figure 5a).44 The performance of a fixed-bed column is usually described by the breakthrough curve, which is expressed by Ct/C0 as a function of time or volume of the effluent for a given adsorbent column.45 The curve shape and volume for breakthrough are key characteristics for evaluating the operation and dynamic response of an adsorption column. In addition, adsorption columns are designed around their specific breakthrough point and the maximum/saturation adsorption capacity. Various kinetic models have been proposed for this purpose.
Figure 5.
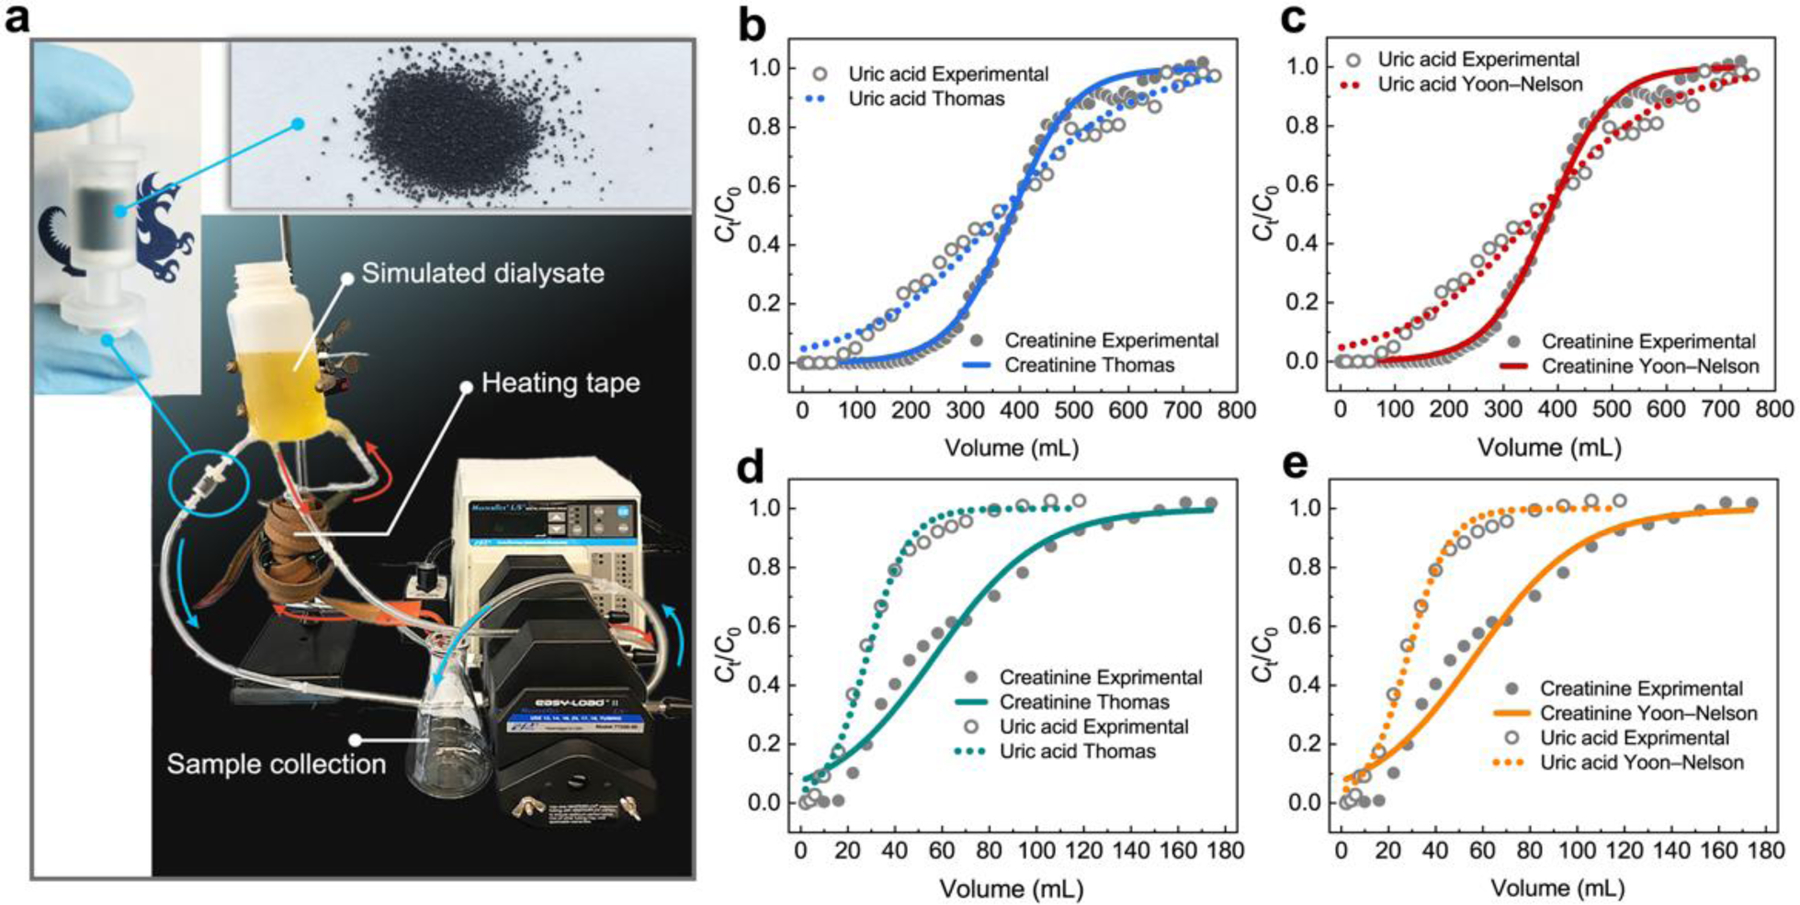
Adsorption of uremic toxin by Ti3C2Tx from aqueous solution and dialysate under dynamic conditions. (a) The in-house built flow system for removal of creatinine and uric acid from aqueous solution and dialysate. The inserts are a 1 mL filtration column packed with 1.0 g of sieved Ti3C2Tx-10HF grains to act as adsorbent. (b) and (c) Experimental and predicted breakthrough curves for creatinine (b) and uric acid (c) on Ti3C2Tx-10HF from aqueous solution according to Thomas and Yoon-Nelson models. (d) and (e) Experimental and predicted breakthrough curves for creatinine (d) and uric acid (e) on Ti3C2Tx-10HF from dialysate according to Thomas and Yoon-Nelson model. The composition of dialysate is included in Table S6.
In our case, the breakthrough curves for the adsorption of creatinine and uric acid were first obtained, as illustrated in Figure 5b and 5c. It can be seen that the uric acid curve is steeper, and its breakthrough volume is lower than creatinine, indicating a lower removal efficiency for uric acid. This is because the affinity between Ti3C2Tx and uric acid molecules is weaker and fewer adsorption sites are available for them, which is consistent with the batch experiments described above. To describe the column adsorption process and predict the concentration-volume profile, Thomas and Yoon-Nelson models46,47 were applied to fit the breakthrough curve.
The Thomas model is used to calculate the maximum adsorption capacity. It is one of the most general and widely used methods in column performance theory because of its reasonable accuracy and simplicity. It assumes that the rate driving force obeys second-order reversible reaction kinetics, where adsorption is usually limited by chemical reaction kinetics.46,47 This is consistent with the situation in our case (see section creatinine and uric acid kinetics studies). The column data for both creatinine and uric acid were well fitted by the Thomas model (Figure 5b), with rate constant KTH and adsorption capacity Qe (38.4 and 20.0 mg/g for creatinine and uric acid, respectively) listed in Table 1. It is noteworthy that the calculated Qe is coincident with the values in batch experiments (45.7 and 17.0 mg/g for creatinine and uric acid, respectively), indicating that adsorption equilibrium has been achieved in the given flow rate and column height. The Yoon-Nelson model is based on the assumption that the rate of decrease in the probability of adsorption for each adsorbate molecule is proportional to the probability of adsorbate adsorption and the probability of adsorbate breakthrough on the adsorbent.46,47 Figure 5c illustrates that the experimental breakthrough curve can be well fitted by the Yoon-Nelson model, with KYN (a rate constant) and v (the volume required for 50% creatinine and uric acid breakthrough) as listed in Table 1. The value of v was determined to be 384.3 and 359.6 mL for creatinine and uric acid, respectively, similar to the experimental results. In agreement with the results of batch experiments, the larger 50% breakthrough volume and higher rate constant value calculated for creatinine indicate a higher adsorption capacity compared to uric acid, similar to static tests. In view of a practical WAK, these breakthrough curves and corresponding mathematical modelling can provide significant information for optimization of the adsorption cartridge for achieving maximum capacity at the required flow rate and satisfactory removal efficiency in a large-scale treatment system.
Table 1.
Thomas and Yoon-Nelson model parameters for the fixed bed adsorption of creatinine and uric acid on Ti3C2Tx-10HF from aqueous solution and simulated dialysatea
| Media | Adsorbate | C0 (mg/mL) | F (mL/min) | Thomas model | Yoon-Nelson model | ||||
|---|---|---|---|---|---|---|---|---|---|
| KTH (mL/mg·min) | Qe (mg/g) | R2 | KYN (× 103) (1/min) | v (mL) | R2 | ||||
| Aqueous solution | Creatinine | 0.1 | 4.0 | 0.71 | 38.4 | 0.996 | 70.5 | 384.3 | 0.996 |
| Uric acid | 0.05 | 4.0 | 0.67 | 18.0 | 0.988 | 33.5 | 359.6 | 0.987 | |
| Simulated dialysate | Creatinine | 0.1 | 2.5 | 1.11 | 5.7 | 0.969 | 124.0 | 55.5 | 0.970 |
| Uric acid | 0.05 | 2.5 | 5.77 | 1.4 | 0.993 | 288.4 | 28.2 | 0.993 | |
C0 is the initial solution concentration, F is the flow rate, KTH is the Thomas rate constant, Qe is the maximum solid-phase concentration of the solute, KYN is the Yoon-Nelson rate constant, v is the volume required for 50% adsorbate breakthrough, R2 is regression coefficient.
Considering that clinical dialysis fluid contains multiple components, including electrolytes, minerals, and bicarbonate ions, a further study under dynamic conditions was performed using simulated dialysate with added creatinine and uric acid to assess the potential of Ti3C2Tx in practical dialysate regeneration. The breakthrough curves are shown in Figure 5d and e and the Thomas and Yoon-Nelson models were used to determine the theoretical maximum adsorption capacity and breakthrough volume (Table 1). Compared to adsorption from aqueous solution, uric acid has a sharper breakthrough curve and lower breakthrough volume than creatinine. The simulated dialysate is a multi-adsorbate system, given the presence of electrolyte cations (K+, Ca2+, Mg2+, etc.), which can also occupy the active sites of Ti3C2Tx. Nevertheless, the experimental data can also be defined by Thomas and Yoon-Nelson models. The adsorption capacity and 50% breakthrough volume calculated by these mathematical models is, however, significantly decreased compared to the values in an aqueous solution. This is probably related to the competitive adsorption of the cations from the dialysate. It is worth noting that the excess K+, Ca2+, Mg2+ and other cations should also be removed from spent dialysate to maintain electrolyte balance. Therefore, further studies are needed to optimize the adsorbent loading and understand the multi-component system to eliminate the toxins from the influent fluid and maintain acid-base balance at the same time.
CONCLUSIONS
We employed 2D Ti3C2Tx MXene to remove creatinine and uric acid from both aqueous solution and simulated dialysate. The batch experiments show rapid adsorption rate with higher adsorption capacity (45.7 and 17.0 mg/g for creatinine and uric acid, respectively) compared to activated carbon, due to the open interlayer structure and hydrophilic surface terminations of Ti3C2Tx, which allow the adsorbates to intercalate and adsorb between MXene sheets. The higher sorbent density compared to activated carbon could decrease the use of dialysate and size/weight of the WAK. The comparison of Ti3C2Tx prepared through two synthesis approaches shows that the Ti3C2Tx etched in 10 wt.% HF, which has more hydroxyl/oxy and less fluoride terminations, has a higher creatinine adsorption capacity and consequently more negative binding energy, which was confirmed by first-principle calculations. Thermodynamic analyses suggest that the adsorption process was exothermic and spontaneous; additionally, the creatinine adsorption has ΔH value approaching 50 kJ/mol - at the upper limit for physisorption. To assess the practical use of Ti3C2Tx adsorbent in a continuous dialysate regeneration system, a fixed-bed column loaded with Ti3C2Tx was dynamically tested with both, an aqueous solution and simulated dialysate. The Thomas and Yoon-Nelson kinetic models were used to predict the breakthrough profile and maximum adsorption capacity. This provide information for designing a larger adsorbent cartridge (determine column height and adsorbent amount) for future animal studies and clinical trials based on the desired flow rate and required removal efficiency. This study provides a deeper understanding of toxin removal by Ti3C2Tx and illustrates the potential of this material to regenerate dialysate fluid. Considering the size and diversity of the MXene family, further studies are warranted to understand how other surface chemistries, synthesis approaches, and post-treatments will further improve adsorption capacity of MXenes.
EXPERIMENTAL SECTION
Reagents.
Creatinine and uric acid were purchased from Millipore-Sigma (>99.9 calculated on dry substance) and corresponding assay kits from BioAssay Systems. The fresh dialysate (Part A: acid concentrate SB-151; Part B: liquid bicarbonate concentrates MB-330-L) was purchased from Medivators, Inc. Parts A and B were mixed thoroughly before using them for adsorption. For every 45 volume parts of dialysate, 1 volume part of acid concentrate, 1.72 volume parts of properly mixed bicarbonate concentrate, and 42.28 volume parts of purified water were mixed. Subsequently, creatinine and uric acid were added to simulate spent dialysate.
Materials.
Ti3C2Tx samples were synthesized from their precursor Ti3AlC2 (MRC, Ukraine, < 37 μm particle size). For Ti3C2Tx-10HF, 1.0 g of Ti3AlC2 (< 37 μm particle size) powder was added into 20 mL of 10 wt.% hydrofluoric acid (50 wt.%, Acros Organics) over 5 min. The etchant solution was stirred for 18 h at 35 °C. For Ti3C2Tx-30HF, 1.0 g Ti3AlC2 was added to 20 mL of 30 wt.% HF and stirred for 3 h at 35 °C. Following etching, the samples were mixed with deionized water, then centrifuged at 3500 rpm for 5 min. This was repeated until the supernatant pH reached ~6. After the final centrifugation, the sediment of each MXene was collected via vacuum-assisted filtration, and the resulting MXene powders were kept under vacuum at room temperature.
Adsorption of creatinine from aqueous solution.
The MXene creatinine adsorption was first tested from aqueous solutions at ambient conditions. The initial concentration of creatinine in aqueous solution was 100 mg/L, which is close to concentration in the discarded spent dialysate from dialysis machines. In the dose-dependent experiments, different mass loadings of MXene (Ti3C2Tx-10HF and Ti3C2Tx-30HF) powder (20, 50, 100, and 200 mg adsorbent dosage) were added to 30 mL of creatinine aqueous solution followed by hand shaking (10 sec) to mix them sufficiently. Then, the vials containing MXene and creatinine aqueous solution were shaken (200 rpm) for 1 h at 37 °C in an incubator (Barnstead Labline MaxQ Mini 4450). Afterwards, the samples were centrifuged for 30 min at 3000 rpm, and the supernatant was collected and centrifuged again (12000 rpm, 15 min) to remove small particles of adsorbent prior to analysis.
For the kinetic studies, 20 mg of MXene (Ti3C2Tx-10HF and Ti3C2Tx-30HF) was added to 30 mL creatinine aqueous solution with the initial concentration of 100 mg/L and the samples were shaken (200 rpm) at 37 °C for different times, ranging from 1 to 120 min. Then the samples were centrifuged and concentrations of creatinine after adsorption were determined using BioAssay Systems assay kit method (Elisa Plate reader, Tecan Infinite 200; peak absorbance at 510 nm). The kinetics of adsorption was evaluated using the following models:
- The pseudo-first and pseudo-second order kinetic models
(5)
where Qe is the adsorption capacity at equilibrium (mg/g), Qt is the amount of adsorbate adsorbed at various times t (mg/g), k1 and k2 is the rate constant of the pseudo-first and pseudo-second order adsorption rate equation (g/mg·min), respectively.(6) - Intra-particle diffusion model proposed by Weber and Morris
where kid is the intra-particle diffusion rate constant of stage i (mg/g·min0.5), Ci is the intercept of stage i giving an idea of the thickness of the boundary layer.(7)
For the equilibrium studies, 20 mg of MXene (Ti3C2Tx-10HF and Ti3C2Tx-30HF) was weighted and added to 30 mL creatinine solutions ranging in concentration from 30 to 200 mg/L. All the samples were shaken (200 rpm) for 2 h at different temperatures (32, 37, 42 and 47 °C). Subsequently, the samples were centrifuged, and supernatants were collected for creatinine concentration analysis. The amount of adsorption at equilibrium, Qe (mg/g), was calculated as:
| (8) |
where C0 and Ce are the creatinine concentrations (mg/L) in the initial solution and at equilibrium, respectively; V is the volume aliquot adsorbate (L), and m is the mass of adsorbent (g).
The Langmuir, Freundlich, and Liu adsorption isotherm equations were employed to fit experimental adsorption data using Equations 9, 10, and 11, respectively:
| (9) |
| (10) |
| (11) |
where Qe is the amount of creatinine adsorbed per gram of adsorbent at equilibrium, Q0 is the maximum value of creatinine adsorption per gram of the adsorbent, K is the Langmuir-type constant defined by the Van’t Hoff equation, and the exponential term n represents the heterogeneity of the site energies.
For the pH-dependent adsorption, 20 mg of Ti3C2Tx-10HF was added to 30 mL creatinine aqueous solution with the initial concentration of 100 mg/L. 0.1 M HCl and NaOH solution were used to adjust the pH value of creatinine solution. The samples were shaken (200 rpm) at 37 °C for 60 min. Then the samples were centrifuged and concentrations of creatinine was determined using BioAssay Systems assay kit method (Elisa Plate reader, Tecan Infinite 200; peak absorbance at 510 nm).
Adsorption of uric acid from aqueous solution.
The uric acid adsorption batch experiments were similar to creatinine. The dosage-dependent experiments were conducted by adding different mass loadings of Ti3C2Tx-10HF powder (5, 10, 20, 50, and 100 mg) into 10 mL of uric acid aqueous solution (50 mg/L), followed by shaking (200 rpm) in an incubator for 1 h at 37 °C. The kinetic studies were performed by adding 10 mg Ti3C2Tx-10HF to 20 mL uric acid aqueous solution with the initial concentration of 50 mg/L and different incubation time ranging from 1 to 180 min while shaking at 200 rpm in an incubator at 37 °C. Then, equilibrium studies were conducted to determine the adsorption isotherms by adding 10 mg Ti3C2Tx-10HF to 20 mL uric acid aqueous solution with different initial concentrations ranging from 2 to 50 mg/L, and all samples were incubated for 2 h at 37 °C while shaking at 200 rpm. After adsorption, all samples were centrifuged at 3000 rpm for 30 min and then 12000 rpm for 15 min, and the supernatants were collected for concentration analysis. The final concentration of uric acid after adsorption were determined using BioAssay Systems assay kit method (Elisa Plate reader, Tecan Infinite 200; peak absorbance at 590 nm).
Adsorption of uremic toxins under dynamic conditions.
Continuous flow adsorption experiments were carried out in a column with an internal diameter of 1 cm length (nonfluorous polypropylene, Sigma-Aldrich, 57608-U) using a home-made setup. The filtration column was loaded with 1 gram of Ti3C2Tx-10HF adsorbent kept in place by two layers of fiberglass pads (polyethylene frit, 20 μm porosity) to prevent leaching and clogging of the adsorbent into drainage. To avoid the erosion or leakage of the material in the filtration column, a room temperature vacuum dried compact Ti3C2Tx was gently broken up into small pieces of multilayer MXene. These “grains” were then sieved by size between 0.25 mm and 0.5 mm to pack into filtration column. The creatinine or uric acid solution were pumped through the filtration column by using a peristaltic pump (Masterflex L/S Digital System with Easy-Load II Pump heads). The initial concentrations of creatinine and uric acid solutions were 100 and 50 mg/L, respectively, and the adsorption process was run at 37 °C. Separately, 800 mL of a creatinine and uric acid aqueous solution was pumped through the adsorption column at a rate of 4 mL/min, and 200 mL was used for simulated dialysate at a rate of 2.5 mL/min. This rate was chosen to avoid liquid jet induced erosion of the MXene grains inside the column. The filtrate was collected at certain time intervals in separate tubes prior analysis.
Breakthrough curves are expressed as adsorbed solute normalized concentration (Ct/Co, defined as the ratio of solute effluent concentration to inlet concentration) versus effluent volume (V) for a given filtration column.
Thomas and Yoon-Nelson models were used to determine the fixed-bed column adsorption process, which are expressed as following equations:
- Thomas model
where KTH is the Thomas rate constant (mL/mg·min), Qe is the maximum solid-phase concentration of the solute (mg/g), X is the amount of adsorbent in the column (g), V is the effluent volume (mL), and F is the flow rate (mL/min). The KTH and Qe can be determined from a plot of Ct/Co against volume for a given flow rate using nonlinear regression analysis.(12) - Yoon-Nelson model
where KYN is the Yoon-Nelson rate constant, V is the effluent volume (mL), and v is the volume required for 50% adsorbate breakthrough.(13)
Supplementary Material
ACKNOWLEDGMENT
Research on uremic toxins adsorption at Drexel University was supported by the U.S. National Science Foundation under Grant No. 2035007 and Coulter-Drexel Translational Research Partnership. MXene development was supported by the Office of the Director of National Intelligence (ODNI), Intelligence Advanced Research Projects Activity (IARPA) (contract number 2018-18071700007). The views and conclusions contained herein are those of the authors and should not be interpreted as necessarily representing the official policies or endorsements, either expressed or implied, of the ODNI, IARPA, or the U.S. Government. The U.S. Government is authorized to reproduce and distribute reprints for Governmental purposes notwithstanding any copyright annotation thereon. Q.Z. was sponsored by the China Scholarship Council (CSC). M.H. is supported by NIH grants K23DK105207 and R01DK124388. We also thank Tyler Mathis for the SEM analysis. The calculations were performed at the Supercomputer Center in Zhengzhou University.
Footnotes
Supporting Information. The Supporting Information is available free of charge on the ACS publications website. Supporting material includes adsorption of creatinine using activated carbons, DFT computational details, kinetics and thermodynamic parameters of the adsorption of uremic toxins, adsorption isotherms for uremic toxins, pH-dependent adsorption, N2 adsorption/desorption isotherms and parameters of the porous structure for activated carbons.
The authors declare no competing financial interests.
REFERENCES
- (1).Naicker S; Yang C-W; Hwang S-J; Liu B-C; Chen J-H; Jha V, The Novel Coronavirus 2019 Epidemic and Kidneys. Kidney Int. 2020, 97, 824–828. [DOI] [PMC free article] [PubMed] [Google Scholar]
- (2).Cheng Y; Luo R; Wang K; Zhang M; Wang Z; Dong L; Li J; Yao Y; Ge S; Xu G, Kidney Disease is Associated with In-Hospital Death of Patients with COVID-19. Kidney Int. 2020, 97, 829–838. [DOI] [PMC free article] [PubMed] [Google Scholar]
- (3).Field MJ; Harris DC; Pollock CA, Body Fluids, Nephron Function and Diuretics The Renal System (Second Edition); Field MJ, Pollock C, Harris DC, Eds. Churchill Livingstone: 2010; 15–31. [Google Scholar]
- (4).Liyanage T; Ninomiya T; Jha V; Neal B; Patrice HM; Okpechi I; Zhao M.-h.; Lv J; Garg AX; Knight J, Worldwide Access to Treatment for End-Stage Kidney Disease: A Systematic Review. Lancet 2015, 385, 1975–1982. [DOI] [PubMed] [Google Scholar]
- (5).Kooman JP; Joles JA; Gerritsen KG, Creating a Wearable Artificial Kidney: Where Are We Now? Expert Rev. Med. Devices 2015, 12, 373–376. [DOI] [PubMed] [Google Scholar]
- (6).Ma Y; Diao B, Lv X; Zhu J; Liang W; Liu L; Bu W; Cheng H; Zhang S; Yang L; Shi M, COVID-19 in Hemodialysis (HD) Patients: Report from One HD Center in Wuhan, China. medRxiv, 2020, 10.1101/2020.02.24.20027201 [DOI] [Google Scholar]
- (7).Bazaev N; Zhilo N; Grinval’d V, Wearable Dialysis: Current State and Perspectives Wearable Technologies, IntechOpen: London, 2018; 91–106. [Google Scholar]
- (8).Cheah WK; Ishikawa K; Othman R; Yeoh FY, Nanoporous Biomaterials for Uremic Toxin Adsorption in Artificial Kidney Systems: A Review. J. Biomed. Mater. Res B 2017, 105, 1232–1240. [DOI] [PubMed] [Google Scholar]
- (9).Murisasco A; Baz M; Boobes Y; Bertocchio P; el Mehdi M; Durand C; Reynier J; Ragon A, A Continuous Hemofiltration System Using Sorbents for Hemofiltrate Regeneration. Clin. Nephrol 1986, 26, S53–S57. [PubMed] [Google Scholar]
- (10).Ash SR Sorbents in Treatment of Uremia: A Short History and a Great Future. Semin. Dial 2009, 22, 615–622 [DOI] [PubMed] [Google Scholar]
- (11).Anasori B; Lukatskaya MR; Gogotsi Y, 2D Metal Carbides and Nitrides (MXenes) for Energy Storage. Nat. Rev. Mater 2017, 2, 16098. [Google Scholar]
- (12).Gogotsi Y; Anasori B, The Rise of MXenes. ACS Nano 2019, 13, 8491–8494. [DOI] [PubMed] [Google Scholar]
- (13).Deysher G; Shuck CE; Hantanasirisakul K; Frey NC; Foucher AC; Maleski K; Sarycheva A; Shenoy VB; Stach EA; Anasori B; Gogotsi Y, Synthesis of Mo4VAlC4 MAX Phase and Two-Dimensional Mo4VC4 MXene with 5 Atomic Layers of Transition Metals. ACS Nano 2020, 14, 204–217. [DOI] [PubMed] [Google Scholar]
- (14).Sokol M; Natu V; Kota S; Barsoum MW, On the Chemical Diversity of the MAX Phases. Trends Chem. 2019, 1, 210–223. [Google Scholar]
- (15).Naguib M; Kurtoglu M; Presser V; Lu J; Niu J; Heon M; Hultman L; Gogotsi Y; Barsoum MW, Two-Dimensional Nanocrystals Produced by Exfoliation of Ti3AlC2. Adv. Mater 2011, 23, 4248–4253. [DOI] [PubMed] [Google Scholar]
- (16).Anasori B; Gogotsi Y, 2D Metal Carbides and Nitrides (MXenes), Springer: Berlin, 2019. [DOI] [PubMed] [Google Scholar]
- (17).Alhabeb M; Maleski K; Anasori B; Lelyukh P; Clark L; Sin S; Gogotsi Y, Guidelines for Synthesis and Processing of Two-Dimensional Titanium Carbide (Ti3C2Tx MXene). Chem. Mater 2017, 29, 7633–7644. [Google Scholar]
- (18).Dai C; Lin H; Xu G; Liu Z; Wu R; Chen Y, Biocompatible 2D Titanium Carbide (MXenes) Composite Nanosheets for pH-Responsive MRI-Guided Tumor Hyperthermia. Chem. Mater 2017, 29, 8637–8652. [Google Scholar]
- (19).Lin H; Wang X; Yu L; Chen Y; Shi J, Two-Dimensional Ultrathin MXene Ceramic Nanosheets for Photothermal Conversion. Nano Lett. 2016, 17, 384–391. [DOI] [PubMed] [Google Scholar]
- (20).Mashtalir O; Naguib M; Mochalin VN; Dall’Agnese Y; Heon M; Barsoum MW; Gogotsi Y, Intercalation and Delamination of Layered Carbides and Carbonitrides. Nat. Commun 2013, 4, 1716. [DOI] [PubMed] [Google Scholar]
- (21).Lukatskaya MR; Mashtalir O; Ren CE; Dall’Agnese Y; Rozier P; Taberna PL; Naguib M; Simon P; Barsoum MW; Gogotsi Y, Cation Intercalation and High Volumetric Capacitance of Two-Dimensional Titanium Carbide. Science 2013, 341, 1502–1505. [DOI] [PubMed] [Google Scholar]
- (22).Ren CE; Hatzell KB; Alhabeb M; Ling Z; Mahmoud KA; Gogotsi Y, Charge- and Size-Selective Ion Sieving through Ti3C2Tx MXene Membranes. J. Phys. Chem. Lett 2015, 6, 4026–4031. [DOI] [PubMed] [Google Scholar]
- (23).Ciou JH; Li S; Lee PS, Ti3C2 MXene Paper for the Effective Adsorption and Controllable Release of Aroma Molecules. Small 2019, 15, 1903281. [DOI] [PubMed] [Google Scholar]
- (24).Peng Q; Guo J; Zhang Q; Xiang J; Liu B; Zhou A; Liu R; Tian Y, Unique Lead Adsorption Behavior of Activated Hydroxyl Group in Two-Dimensional Titanium Carbide. J. Am. Chem. Soc 2014, 136, 4113–4116. [DOI] [PubMed] [Google Scholar]
- (25).Regazzoni AE; Mandelbaum P; Matsuyoshi M; Schiller S; Bilmes SA; Blesa MA, Adsorption and Photooxidation of Salicylic Acid on Titanium Dioxide: A Surface Complexation Description. Langmuir 1998, 14, 868–874. [Google Scholar]
- (26).Meng F; Seredych M; Chen C; Gura V; Mikhalovsky S; Sandeman S; Ingavle G; Ozulumba T; Miao L; Anasori B, MXene Sorbents for Removal of Urea from Dialysate: A Step toward the Wearable Artificial Kidney. ACS Nano 2018, 12, 10518–10528. [DOI] [PubMed] [Google Scholar]
- (27).Vanholder R; De Smet R; Glorieux G; Argilés A; Baurmeister U; Brunet P; Clark W; Cohen G; De Deyn PP; Deppisch R, Review on Uremic Toxins: Classification, Concentration, and Interindividual Variability. Kidney Int. 2003, 63, 1934–1943. [DOI] [PubMed] [Google Scholar]
- (28).Seredych M; Shuck CE; Pinto D; Alhabeb M; Precetti E; Deysher G; Anasori B; Kurra N; Gogotsi Y, High-Temperature Behavior and Surface Chemistry of Carbide MXenes Studied by Thermal Analysis. Chem. Mater 2019, 31, 3324–3332. [Google Scholar]
- (29).Halim J; Cook KM; Naguib M; Eklund P; Gogotsi Y; Rosen J; Barsoum MW, X-ray Photoelectron Spectroscopy of Select Multi-Layered Transition Metal Carbides (MXenes). Appl. Surf. Sci 2016, 362, 406–417. [Google Scholar]
- (30).Wang HW; Naguib M; Page K; Wesolowski DJ; Gogotsi Y, Resolving the Structure of Ti3C2Tx MXenes through Multilevel Structural Modeling of the Atomic Pair Distribution Function. Chem. Mater 2015, 28, 349–359. [Google Scholar]
- (31).Kabbashi NA; Atieh MA; Al-Mamun A; Mirghami ME; Alam M; Yahya N, Kinetic Adsorption of Application of Carbon Nanotubes for Pb (II) Removal from Aqueous Solution. J. Environ. Sci 2009, 21, 539–544. [DOI] [PubMed] [Google Scholar]
- (32).Plazinski W; Rudzinski W; Plazinska A, Theoretical Models of Sorption Kinetics Including a Surface Reaction Mechanism: A Review. Adv. Colloid Interface Sci 2009, 152, 2–13. [DOI] [PubMed] [Google Scholar]
- (33).Ho YS; McKay G, Pseudo-Second Order Model for Sorption Processes. Process Biochem. 1999, 34, 451–465. [Google Scholar]
- (34).Wang J; Guo X, Adsorption Kinetic Models: Physical Meanings, Applications, and Solving Methods. J. Hazard. Mater 2020, 390, 122156. [DOI] [PubMed] [Google Scholar]
- (35).Levi MD; Lukatskaya MR; Sigalov S; Beidaghi M; Shpigel N; Daikhin L; Aurbach D; Barsoum MW; Gogotsi Y, Solving the Capacitive Paradox of 2D MXene Using Electrochemical Quartz-Crystal Admittance and In Situ Electronic Conductance Measurements. Adv. Energy Mater 2015, 5, 1400815. [Google Scholar]
- (36).Weber WJ; Morris JC, Kinetics of Adsorption on Carbon from Solution. J. Sanit. Eng. Div 1963, 89, 31–60. [Google Scholar]
- (37).Lima ÉC; Adebayo MA; Machado FM, Kinetic and Equilibrium Models of Adsorption Carbon Nanomaterials as Adsorbents for Environmental and Biological Applications, Springer: Cham, 2015; 33–69. [Google Scholar]
- (38).Liu Y; Xu H; Yang SF; Tay JH, A General Model for Biosorption of Cd2+, Cu2+ and Zn2+ by Aaerobic Granules. J. Biotechnol 2003, 102, 233–239. [DOI] [PubMed] [Google Scholar]
- (39).Liu Y; Liu YJ, Biosorption Isotherms, Kinetics and Thermodynamics. Sep. Purif. Technol 2008, 61, 229–242. [Google Scholar]
- (40).Machado FM; Bergmann CP; Lima EC; Royer B; de Souza FE; Jauris IM; Calvete T; Fagan S, Adsorption of Reactive Blue 4 dye from Water Solutions by Carbon Nanotubes: Experiment and Theory. Phys. Chem. Chem. Phys 2012, 14, 11139–11153. [DOI] [PubMed] [Google Scholar]
- (41).Liu Y; Xu H, Equilibrium, Thermodynamics and Mechanisms of Ni2+ Biosorption by Aerobic Granules. Biochem. Eng. J 2007, 35, 174–182. [Google Scholar]
- (42).Saǧ Y; Kutsal T, Determination of the Biosorption Heats of Heavy Metal Ions on Zoogloea Ramigera and Rhizopus Arrhizus. Biochem. Eng. J 2000, 6, 145–151. [DOI] [PubMed] [Google Scholar]
- (43).Hayward DO; Trapnell BMW, Chemisorption. Butterworths: London, 1964. [Google Scholar]
- (44).Seredych M; Haines B; Sokolova V; Cheung P; Meng F; Stone L; Mikhalovska L; Mikhalovsky S; Mochalin VN; Gogotsi Y, Graphene-Based Materials for the Fast Removal of Cytokines from Blood Plasma. ACS Appl. Bio Mater 2018, 1, 436–443. [DOI] [PubMed] [Google Scholar]
- (45).Worch E, Fixed-Bed Adsorption in Drinking Water Treatment: A Critical Review on Models and Parameter Estimation. J. Water Supply: Res. Technol 2008, 57, 171–183. [Google Scholar]
- (46).Aksu Z; Gönen F, Biosorption of Phenol by Immobilized Activated Sludge in a Continuous Packed Bed: Prediction of Breakthrough Curves. Process Biochem. 2004, 39, 599–613. [Google Scholar]
- (47).Han R; Wang Y; Zhao X; Wang Y; Xie F; Cheng J; Tang M, Adsorption of Methylene Blue by Phoenix Tree Leaf Powder in a Fixed-Bed Column: Experiments and Prediction of Breakthrough Curves. Desalination 2009, 245, 284–297. [Google Scholar]
Associated Data
This section collects any data citations, data availability statements, or supplementary materials included in this article.