

SUMMARY
The electrocardiogram (ECG) is one of the most useful non-invasive diagnostic tests for a wide array of cardiac disorders. Traditional approaches to analyzing ECGs focus on individual segments. Here, we performed comprehensive deep phenotyping of 77,190 ECGs in the UK Biobank across the complete cycle of cardiac conduction, resulting in 500 spatial-temporal datapoints, across 10 million genetic variants. In addition to characterizing polygenic risk scores for the traditional ECG segments, we identified over 300 genetic loci that are statistically associated with the high-dimensional representation of the ECG. We established the genetic ECG signature for dilated cardiomyopathy, associated the BAG3, HSPB7/CLCNKA, PRKCA, TMEM43, and OBSCN loci with disease risk and confirmed this association in an independent cohort. In total, our work demonstrates that a high-dimensional analysis of the entire ECG provides unique opportunities for studying cardiac biology and disease and furthering drug development.
Graphical Abstract

In Brief
Verweij et al. performed high-dimensional phenotyping of the electrocardiogram followed by a large-scale genome-wide association study. The authors show that genetic variants have unique electrocardiographic signatures and that particular signatures relate to dilated cardiomyopathy and early repolarization, implicating genetic loci including BAG3, TMEM43, PRKCA, OBSCN, DKK1, and KCDN3.
INTRODUCTION
Since its original description in 1893 by Willem van Einthoven, the electrocardiogram (ECG) has been instrumental in the recognition of a wide array of cardiac disorders (AlGhatrif and Lindsay, 2012; Das and Zipes, 2012). The ECG is one of the most useful non-invasive diagnostic tests for many cardiac disorders as it informs about the presence of cardiac structure abnormalities, such as chamber enlargement, conduction disturbances, and arrythmias. It also provides indication of electrolyte imbalance and drug toxicity. So far, genetic studies of the ECG identified more than hundred genetic loci (Arking et al., 2014; van den Berg et al., 2017; Bihlmeyer et al., 2018; Eppinga et al., 2016; van der Harst et al., 2016; Nielsen et al., 2018; Prins et al., 2018; Roselli et al., 2018; van Setten et al., 2018; Verweij et al., 2016) but have focused around specific ECG fragments representing peak characteristics such as the PR interval, QRS duration, and QT interval.
Current genome-wide association studies (GWASs) of cardiac conduction provided insights into cardiac (conduction) biology by pointing out new genetic loci and genes. However, one of the major limitations of this approach is that it ignores the high-dimensional nature of the ECG. It is also challenging to compare findings across different ECG GWASs because the traits themselves are fragmented across the ECG, measured in different populations, using different methods, and disseminated across different publications.
We aimed to overcome these limitations by following the effects of individual genetic variants through the complete cardiac cycle the ECG represents, in order to identify additional insights into cardiac biology and disease. To this end, we downloaded, processed over 70,000 3-lead ECG recordings of the UK Biobank. For each individual, we averaged the ECG recording of multiple heart beats down to 500 data points that represented one normal cardiac conduction cycle in rest, and we refer to it as the “ECG morphology phenotype.” The 500 data points can be seen as 500 traits or timepoints that each represents separate segments of the cardiac cycle. Aggerating these data across all individuals, on a population level, we then studied how the ECG morphology phenotype was influenced by genetics. We show that genetic variants are not bound by classical interpretations of the ECG but have unique association signatures across the ECG, or “genetic ECG signatures.” By exploiting aberrant genetic ECG signatures, we identified genetic loci and endo-phenotypes for cardiac disorders. Our results demonstrate how an integrated approach to analyze high-dimensional data can further our understanding of the ECG, adding to the earlier undertaken snapshot analyses of individual ECG components.
RESULTS
An enhanced understanding of the influence of genetic variants on the complete cardiac cycle represented by the ECG could generate new hypotheses on cardiac physiology, disease, and effects of drugs. To better characterize the impact of genetic variants on the ECG, we obtained all 77, 190 3-lead ECGs of the UK Biobank that contained raw signal data necessary for the analysis. After individual-level and population-level quality control to remove abnormal beats and ECGs (Simson, 1981) (STAR Methods; Figure 1), 63,706 individuals remained for the primary analyses. The primary ECG morphology phenotype was constructed by averaging the cardiac cycle that the ECG represents. We segmented the cardiac cycle into 500 data points representing ECG voltages along a 1,000 ms window, dictated by the 500 hz ECG sampling rate. To study the possible effects of heart rate, we performed additional, secondary, analyses in which we normalized that representation for the individual beat-to-beat variation (the R-R interval) and refer to it as the “R-R adjusted” ECG morphology phenotype.
Figure 1. Overview of the Study Design.
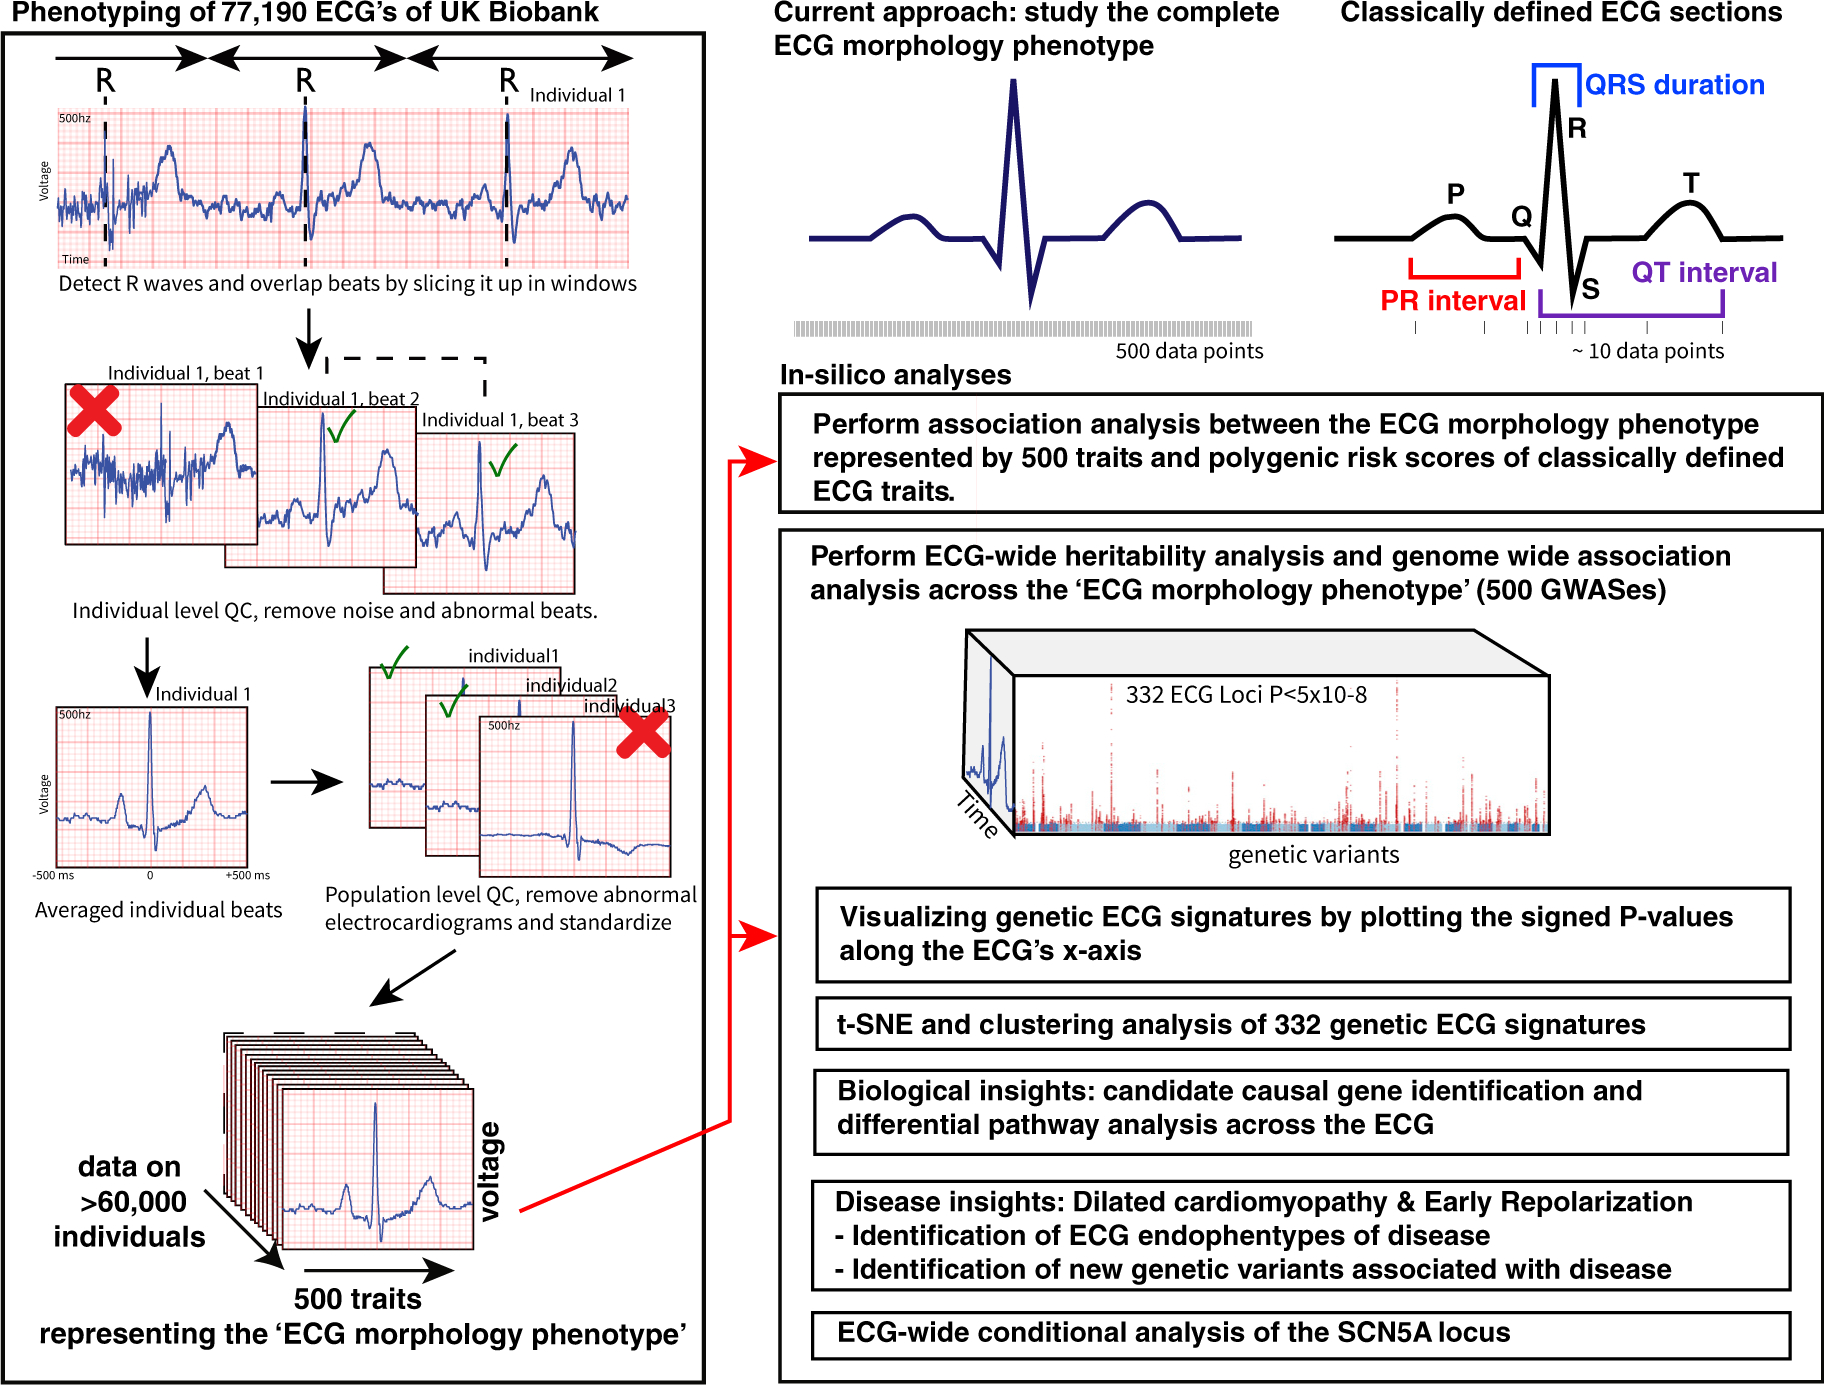
A schematic overview of the phenotyping approach and downstream in silico annotations and analyses.
To demonstrate that this approach also captures the classical ECG traits, we used previously described genetic variants in aggregate and isolation to visualize their morphological effect on the ECG (Arking et al., 2014; van den Berg et al., 2017; Bihlmeyer et al., 2018; Eppinga et al., 2016; van der Harst et al., 2016; Nielsen et al., 2018; Prins et al., 2018; Roselli et al., 2018; van Setten et al., 2018; Verweij et al., 2016). By plotting 500 association signals of each datapoint as −log10 p values along the time axis of one beat (Figure 2), we found that the polygenic risk score of PR interval associated with a shift of the P wave; the polygenetic risk score of QRS duration associated with Q and S wave durations; the polygenic risk score of 12-lead sum area matched the area under the curve of the QRS complex; and the polygenetic risk score of QT-time associated with T wave prolongation. To obtain insights into the potential effects of heart rate on cardiac conduction and ECG amplitudes, we included the R-R-adjusted ECG morphology phenotype as a secondary analysis to show the potential effect of heart rate on the genetic ECG signatures. The classical ECG traits are largely unaffected by heart rate (Data S1, related to Figure 2), but the polygenic score of heart rate shows a very different genetic ECG signature for the R-R-adjusted phenotype, as expected (Figure 2).
Figure 2. Polygenic Risk Scores of ECG Indices Are Associated with the Trait Expected Segments of the ECG.

For each of the classical ECG traits we calculated polygenic scores and associated them with each of the data points that make up the ECG morphology phenotype. The left y axis depicts the micro voltage scale, the y axis on the right indicates the signed −log10(p values). The x axis is time in milliseconds (ms) or percentage (%) from the R-R in the case of the R-R-adjusted ECG morphology phenotype. The blue lines are the average ECG amplitude of the full cohort and the red lines the p value for association with each datapoint of the ECG morphology phenotype (n = 500 time points) on a log10 scale, signed to show direction of association. The dashed vertical black lines mark point of strongest negative and positive association. Additional plots for the R-R-adjusted ECG phenotype and sensitivity analyses can be found in the appendix.
When individual variants of these risk scores were plotted, a plethora of different ECG morphologies was observed, suggesting that they are not bound by classic ECG patterns and indicate differences in the underlying biology (Figures 3A and 3B; Data S2). For atrial fibrillation some interesting examples include the major atrial fibrillation locus PITX2 (paired-like homeodomain transcription factor) and SYNPO2L (synaptopodin 2-like), both showing a genetic ECG signature consistent with the genetic ECG signature of atrial fibrillation. The loci encompassing TTN and PLN, however, show very different genetic ECG signatures not captured by any of the polygenic risk scores in Figure 2. TTN encodes titin, the largest known human protein and major component of the muscle’s sarcomere. PLN encodes phospholamban, which inhibits calcium uptake by the sarco-/endoplasmic reticulum Ca2+-ATPase-2 (SERCA-2) pump, involved in atrial and ventricular relaxation.
Figure 3. Genetic Variants Display Unique Morphological Signatures and the Heritability Is Highest at ECG Segments Showing Greatest Electrical Activity.

(A) A heatmap of the genetic ECG signatures that were previously found to be associated with atrial fibrillation. We normalized the genetic ECG signatures of genetic variants in order to compare the effects across loci. Effects were orientated to the most positively associated allele across all time points and colored in red on the heatmap; a blue color indicates a negative effect while yellow indicates no effect. On the left side is the unadjusted ECG phenotype, on the right side the R-R-adjusted ECG phenotype.
(B) Excerpts of genetic ECG signatures for previously reported genetic variants, plotted in the same way as the polygenic risk scores in Figure 2. The red line indicates the signed −log10(p value) for association across the heartbeat. And the blue line the average ECG amplitudes in the population.
(C) The SNP heritability’s (h2g) are plotted in red for the unadjusted and the R-R interval-adjusted ECG morphology phenotype. The SNP heritability was highest for the ECG morphology phenotype unadjusted for the R-R interval (left plots). The maximum observed heritability was 0.29 (SE = 0.01) at the ST-wave segment. Heritability estimates were high for ECG segments that have high electrical activity, consistent with molecular mechanism of cardiac conduction. The plots on the bottom shows the pairwise Pearson correlation matrix on the phenotype level between each ECG datapoint across the ECG morphology phenotypes. Red indicates a high positive correlation, blue indicates a high negative correlation, yellow indicates no correlation; both the x and y axes depict the ECG in time and match the average ECG amplitudes plotted on the top.
To better understand the contribution of common genetic variation to the ECG morphology phenotype in general, we studied the SNP heritability (h2g). Here, we observed that electrically active (non-isoelectric) ECG points are more heritable than isoelectric points, consistent with what would be expected based on the molecular mechanisms (see Figure 3C). This analysis also suggested that amplitudes between the S and T wave (the ST segment) are highly heritable, suggesting that this part of the ECG may be particularly interesting.
Next, we performed GWAS on the amplitude of each of the 500 temporal data points of the ECG generating 500 association values per genetic variant (STAR Methods). In total 414 independent (r2 < 0.001) genetic variants were identified in 331 2-MB regions at the traditional genome-wide significance threshold (p < 5 × 10⁻⁸) or 203 independent variants in 166 2-MB regions at the stringent Bonferroni-corrected significance level (p < 6.25 × 10⁻¹⁰). These 414 independent genetic variants were assigned to 584 candidate genes (Figure 4A; Tables S1, S2, and S3). Of all 331 ECG-associated regions, 127 were shared (1-MB-region-based) with loci found in prior GWASs of classical ECG traits and 64 regions were shared with the atrial fibrillation phenotype (Tables S1 and S4), at the time of this study. We identified 179 genetic association signals that had not been reported before (Arking et al., 2014; van den Berg et al., 2017; Bihlmeyer et al., 2018; Christophersen et al., 2017; Eppinga et al., 2016; van der Harst et al., 2016; Nielsen et al., 2018; Prins et al., 2018; Roselli et al., 2018; van Setten et al., 2018; Verweij et al., 2014, 2016). The impact of all genome-wide significant genetic variants on ECG morphology is plotted in Data S3, these and all other genetic variants can also be viewed online in our ECG browser (http://www.ecgenetics.org). The three strongest observed association signals were for rs7132327 (p = 4 × 10−140) near TBX3, rs6801957 (p = 3×10−133) near SCN5A, and rs2074238 (p = 2 × 10−129) in KCNQ1. The most significant pathways by DEPICT were “heart development” and “decreased cardiac muscle contractility.” The most significant tissues identified by DEPICT were “heart,” “heart ventricles,” and “heart atria” (Tables S5 and S6).
Figure 4. Unbiased Clustering Maps Main Effects of Genetic Variants on the Electrocardiogram.

(A) Manhattan plot of the ECG morphology phenotype (smallest p value across all traits is shown), variants in red indicate those passing p < 5 × 10⁻⁸, the top loci have been annotated with their nearby genes.
(B) The t-SNE plot was derived from a large matrix that contained all genetic ECG signatures (signed −log(p) values) for all lead genetic variants that were identified in the GWAS. An interactive t-SNE plot is available on www.ecgenetics.org.
(C) Exemplar ECG signatures were annotated with the most likely candidate causal gene, illustrating how each cluster can be linked back to their primary ECG effect.
To group genetic variants with similar main effects on the ECG we performed unbiased clustering of the normalized ECG morphology association profiles. This analysis suggested 5 subsets of genetic effects on the ECG (Figure 4B). Four clusters A, B, D, and E contained variants that associated primarily with differences in ECG’s Q wave, P wave, R-S wave, and T wave morphology, respectively (Figure 4C). The 5th cluster (cluster C) contained a diversity of ECG morphologies affecting the edges of the ECG and influence a component of heart rate. Although genetic variants grouped into a cluster sharing morphological features, many expressed unique features within each cluster, pointing toward differences in underlying biology. Differential pathway analysis on each cluster identified cluster A related to the Q wave to be specifically enriched for 132 pathways related to cardiac muscle function including terms like “dilated cardiomyopathy,” “cardiac muscle contraction,” and “ventricular septal defect” (Table S5).
To exploit the potential for obtaining clinical insights of this resource, we focused on a particular point of the Q-wave cluster that showed strong overlap with dilated cardiopathy risk. rs2234962 in BAG3 was among the most significant loci (p < 5 × 10−54) in our analysis that have not been reported previously in GWASs of the ECG. The genetic ECG signature for this variant concentrated around the Q-R upslope of the ECG at −18 ms from the R wave (Figure 5, http://www.ecgenetics.org). This variant was previously identified in a GWAS of dilated cardiopathy (Meder et al., 2014; Stark et al., 2010; Villard et al., 2011). Another previously unreported ECG locus was rs1763604 near HSPB7/CLCNKA (p < 5 × 10⁻²⁰), this variant has also been identified by the same GWAS of dilated cardiopathy and exhibiting the same ECG pattern as BAG3 (Figure 5), suggesting that this particular genetic ECG signature of the Q-R wave may have something in common with dilated cardiomyopathy. BAG3 is part of the conserved family of cyto-protective co-chaperone proteins. The gene is mainly expressed in striated muscle and the protein colocalizes with the Z disc of the sarcomere. The locus encompassing HSPB7/CLCNKA includes two potential candidate causal genes. CLCNKA encodes a renal ClC-Ka chlo-ride channel; however, HSPB7 may be a more likely candidate gene as it is expressed in cardiomyocytes. HSPB7 is a member of the small heat shock protein family. The protein is located in the intercalated disc adjacent to the Z line of the adult cardiac muscle and is essential for maintaining integrity of myofiber structure and cardiac conduction (Liao et al., 2017). The genetic associations for rs2234962 and rs1763604 persisted in individuals not diagnosed with dilated cardiopathy or other cardiac conditions (Table S7), indicating that dilated cardiomyopathy patients are not driving the associations between these variants and the ECG at −18 ms.
Figure 5. MR of Dilated Cardiomyopathy and Early Repolarization.
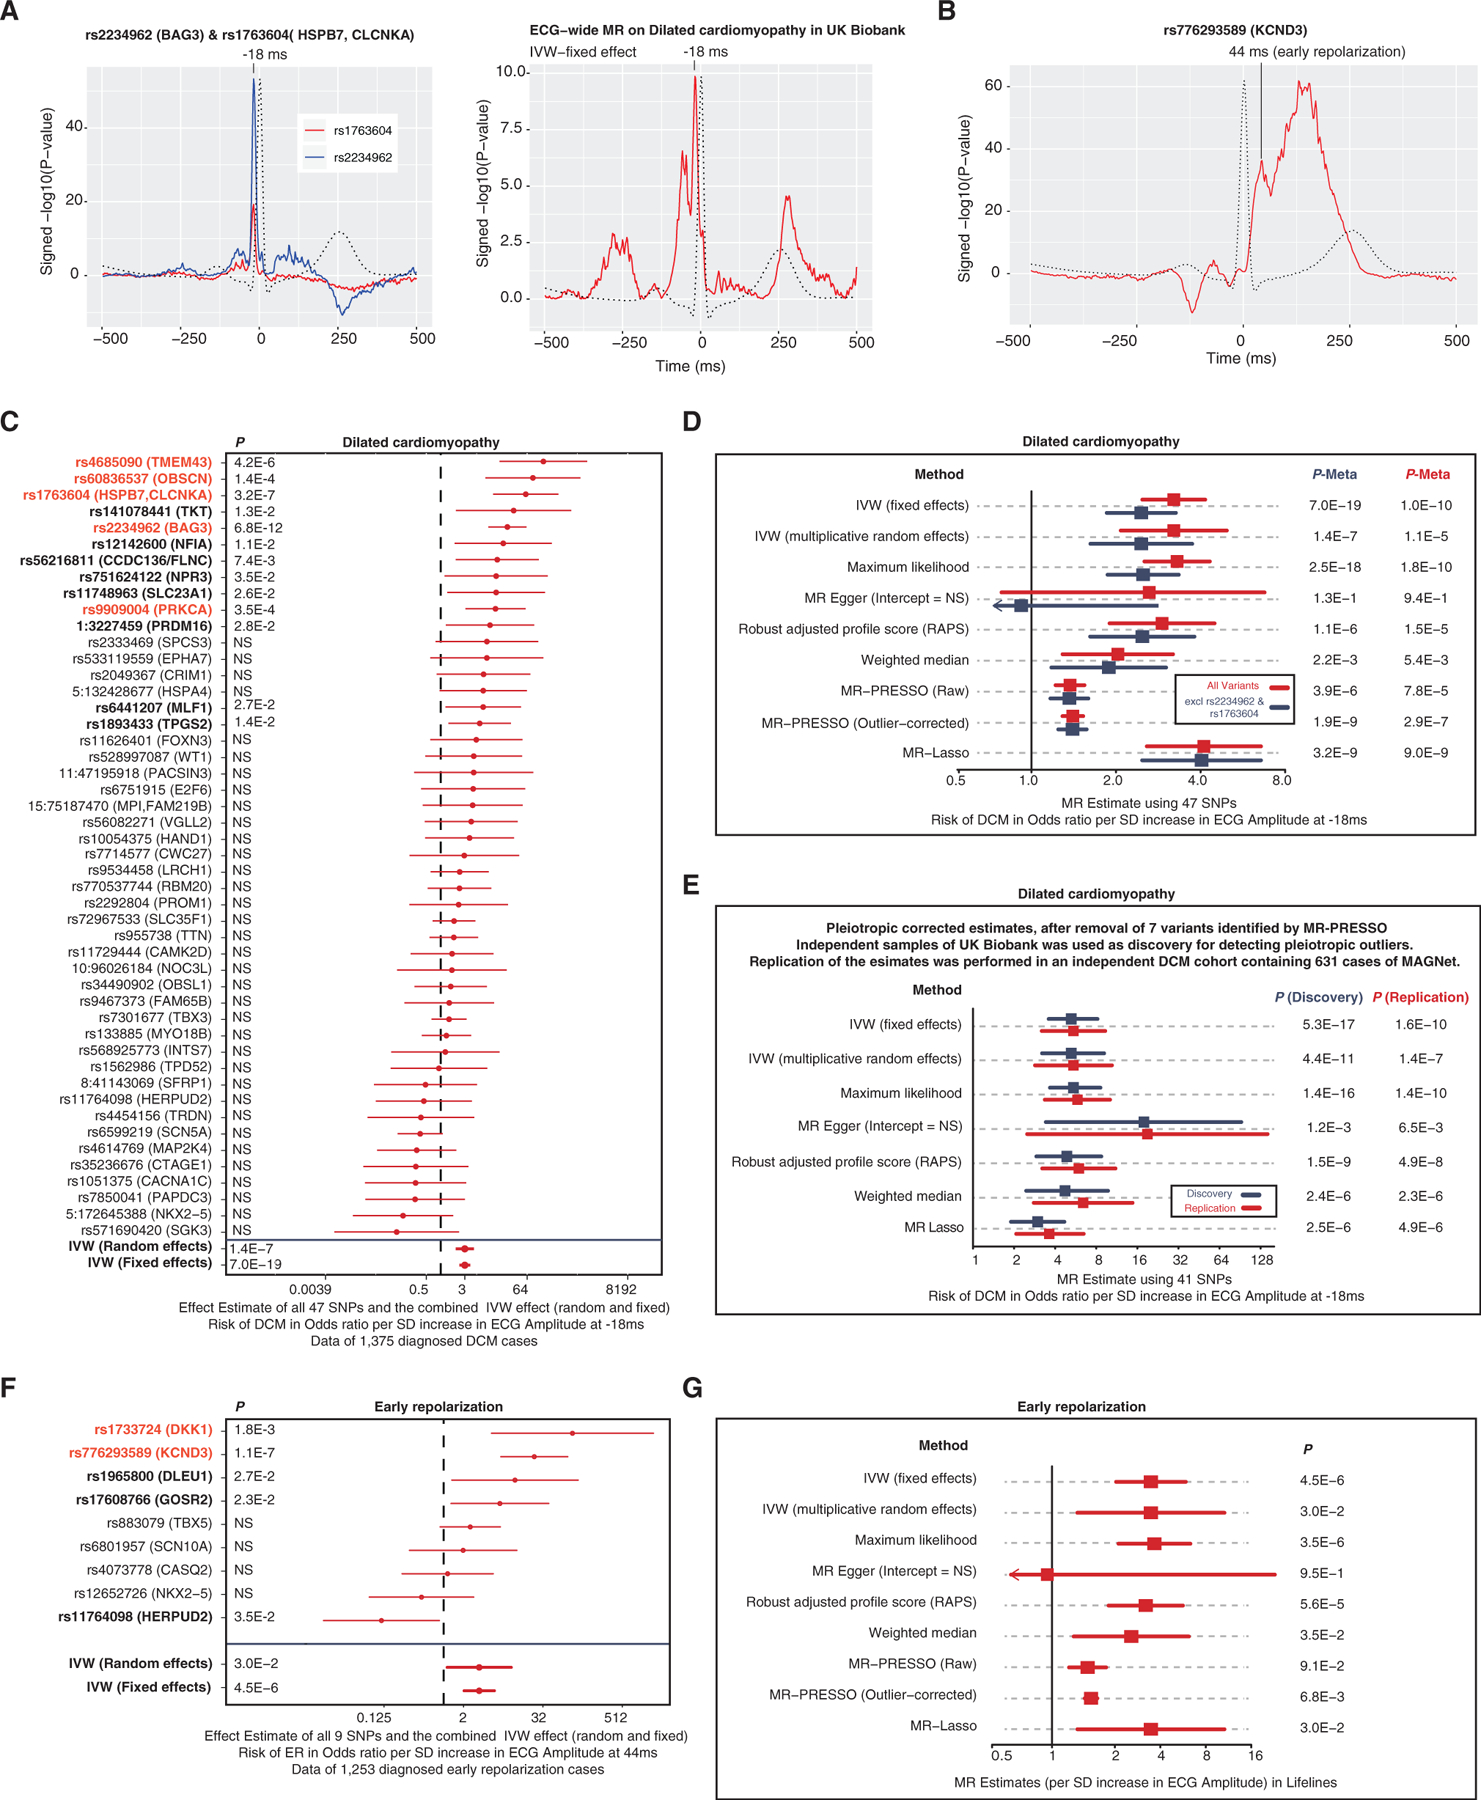
(A) The left plot illustrates the ECG signature of two loci previously identified for dilated cardiomyopathy but never before for the ECG. The right plot illustrates an ECG-wide genetic signature for dilated cardiomyopathy: for this we carried out a fixed effects MR for each time point, including all lead variants p < 5 × 10⁻⁸ per time point of the ECG as instrumental variables and dilated cardiomyopathy as outcome variable. The red lines indicate the p value for association with each datapoint of the ECG morphology phenotype (n = 500 time points) on a log10 scale, signed to show direction of association.
(B) The genetic ECG signature of KCND3 shows an association peak that is consistent with the early repolarization criterion at 44 ms after the R peak.
(C) Forest plot of the MR estimates of the ECG at −18 ms on dilated cardiomyopathy for each variant individually. Variants in red are Bonferroni significant (p < 0.001), variants in bold are p < 0.05 for dilated cardiomyopathy.
(D) MR estimates of the ECG at −18 ms on dilated cardiomyopathy.
(E) MR estimates of the ECG at −18 ms on dilated cardiomyopathy in the discovery (UK Biobank) and replication (MAGNet) cohort controlling for pleiotropic variants identified by MR-PRESSO.
(F) Forest plot of the MR estimates of the ECG at 44 ms on early repolarization for each variant individually. Variants in red are Bonferroni significant (p < 0.001), variants in bold are p < 0.05 for early repolarization.
The observation that the ECG captures information relevant to dilated cardiopathy is important because it shows that genetic-disease associations can be found in healthy individuals using an inexpensive ECG test. Dilated cardiopathy is a severe disease with poor prognosis: the 5-year survival rate after diagnosis is only 50%, yet the disease can be asymptomatic for a long time. One hypothesis is that the Q-R wave marks sub-clinical dilated cardiopathy and reflects the structural integrity of the heart relevant for dilated cardiopathy risk. It is notable that here is no clear single diagnosis criterion of the ECG for dilated cardiopathy (Bozkurt et al., 2016; Japp et al., 2016).
We hypothesized that this Q-R upslope feature represents a biomarker for dilated cardiopathy. To test this, we carried out an ECG-wide Mendelian randomization (MR) (fixed effects inverse variance weighted method) in UK Biobank to reveal the genetic ECG signature for dilated cardiopathy. This analysis confirmed that −18 ms was most associated with dilated cardiopathy but also revealed a secondary effect just before the Q-R wave (Figure 5A).
To further substantiate the hypotheses that the Q-R upslope at −18 ms is associated with dilated cardiopathy, we executed a more detailed MR analyses using up to 47 genetic variants that are associated with amplitudes of −18 ms. Here, we observed that there is a consistent relationship between the genetic ECG signature and increased risk of dilated cardiopathy (Figure 5C; Tables S8 and S9). These findings remained consistent in several sensitivity analyses, across the UK Biobank and the independent MAGNet study cohort. Also, exclusion of the 2 previously known variants did not change our findings (Figure 5E).
In addition to the known BAG3 and CLCNKA loci, we identified 3 other variants for dilated cardiopathy passing the Bonferroni significant threshold (p < 0.001) by using the Q-R slope trait as “bait”: rs9909004 (p = 3.5 × 10⁻⁴) in PRKCA, rs4685090 (p = 4.2 × 10⁻⁶) near TMEM43, and rs60836537 (p = 1.4 × 10⁻⁴) in OBSCN (Figure 5C; Tables S8 and S9). The PRKCA locus encodes the enzyme protein kinase C alpha that has previously been identified to be associated with dilated cardiomyopathy via its role in adverse left ventricular modeling (Hu et al., 2018). PRKCA affects dephosphorylation of cardiac the phospholamban (PLN) involved in inhibiting the SERCA2 pump. Mutations in TMEM43 (transmembrane protein 43) are commonly identified as a cause for right ventricular dysplasia subtype 5 (Calkins et al., 2017). However, the exact molecular function of TMEM43 and its role in cardiac biology is unknown. OBSCN encodes Obscurin, a large 720-kDa multidomain protein that plays a primary role in the formation and stabilization of the sarcomere, it harbors mutations causing hypertrophic and dilated cardiopathy (Marston, 2017). In total 13 of 47 variants were nominally associated (p < 0.05) with dilated cardiopathy, which is considerably more than expected by chance (Pbinomial = 3.4 × 10⁻⁷). These analyses support this new hypothesis that the Q-R slope differences are linked to dilated cardiopathy risk and that it is a powerful tool to study the genetics of this disease. Further functional studies are important to understand the nature of these associations and how this genetic ECG signature can be used in precision medicine approaches (Rosenbaum et al., 2020), used as a biomarker, used for stratification, or used to monitor progression of dilated cardiomyopathy.
Other examples of cardiac diseases in which the ECG is critical for clinical diagnosis include early repolarization. The diagnosis of this condition is based on strict criteria of passing a certain threshold on the ECG. We hypothesized that the biological underpinnings of early repolarization do not adhere to a strict binary phenomenon and that our understanding can be enhanced by studying continuous traits as well. Recently, a GWAS of the strict binary definition of early repolarization identified one locus, rs1545300 in KCND3 (Teumer et al., 2019). When analyzing the full ECG morphology of rs1545300, we observed an association peak at 44 ms after the R wave that coincided with the early repolarization criterion (Figure 5B, http://www.ecgenetics.org). We used this 44-ms data point as “bait” to identify 8 additional loci possibly relevant to early repolarization at p < 5 × 10⁻⁸ (Table S10). We tested these for association with early repolarization in the independent LifeLines cohort (Figures 5F and 5G; Tables S8 and S9). Two loci (1 known and 1 novel) were significant at the Bonferroni level: rs776293589 (KCND3, p = 1.05×10⁻⁷) and rs1733724 (DKK1, p = 1.8 × 10⁻³), and 5 out of 9 variants showed a suggestive association (p < 0.05), more than expected by chance (Pbinomial = 3.3 × 10⁻⁵). KCDN3 encodes Kv4.3 that is responsible for the transient outward potassium current, I(to), and important for the early phase of repolarization. DKK1 encodes the Dickkopf WNT signaling pathway inhibitor 1 and may be involved in regulating Wnt signaling that is responsible for cell fate during formation of the heart.
One of the most prominent genetic loci influencing electrocardiographic traits and diseases is the SCN5A locus. SCN5A encodes the alpha subunit of the main cardiac sodium channel Nav1.5 and has a critical role in regulation of cardiac electrophys- iological function. SCN5A has been found causative for a variety of cardiomyopathies and cardiac arrythmias including atrial fibrillation, long QT syndrome, and the Brugada syndrome. Common variants in or near SCN5A have been associated with almost all ECG traits (Arking et al., 2014; van den Berg et al., 2017; Bihlmeyer et al., 2018; Christophersen et al., 2017; Eppinga et al., 2016; van der Harst et al., 2016; Nielsen et al., 2018; Prins et al., 2018; Roselli et al., 2018; van Setten et al., 2018; Verweij et al., 2014, 2016). Because this is such a prominent locus for cardiac electrophysiology, we aimed to dissect the complex genetic architecture of SCN5A by leveraging the power multiple ECG traits. We performed a comprehensive conditional analysis across the entire ECG morphology phenotype by taking into account all 1,000 ECG traits simultaneously (see STAR Methods). Using this multivariate approach, we identified 10 independent variants in the SCN5A locus with an effect on one or more of the 500 data points of the ECG morphology (at p < 5 × 10⁻⁸). The identified variants all coincide with cardiac enhancer mark, which was more than expected by chance, Phypergeometric = 1 × 10⁻⁷. This finding suggests that the causal common variants at SCN5A are likely to be of regulatory nature and provides support for the hypothesis that the identified variants may be causal. We found that these 10 independent SCN5A variants have different morphological ECG signatures, possibly pointing toward different biological mechanisms and consequences for the cardiac conduction system (Data S4; Table S11).
DISCUSSION
Although genetic influences of the ECG have long been established, these analyses have mainly been based on isolated segments of the ECG (Arking et al., 2014; van den Berg et al., 2017; Bihlmeyer et al., 2018; Eppinga et al., 2016; van der Harst et al., 2016; Nielsen et al., 2018; Prins et al., 2018; Roselli et al., 2018; van Setten et al., 2018; Verweij et al., 2016). In this study, we provide the first high-dimensional analyses of the ECG that is not limited by a definition of classically defined ECG features. Studying the complete ECG in an integrative manner provided a unique opportunity to obtain more meaningful insights into biology compared with studying individual ECG fragments one at a time.
We identified over 300 genome-wide genetic loci, of which the majority have not been reported before in relation to the ECG. These loci showed unique association signatures on the ECG. For example, variants near genes encoding potassium and calcium channels exhibited different signatures, suggesting differences in ion-channel activity during the cardiac cycle. These data provide unique insights into the biological mechanisms of cardiac physiology and could inform in silico models of cardiac conduction (Sadrieh et al., 2014).
We expect that these types of integrative analyses of genome and phenome data, leveraging many correlated traits at the same time, can be applied to other high-dimensional datasets as well, such as lipidomic and metabolomics data. This will be essential to move the GWAS field forward and to provide more useful information compared with studying individual traits in isolation.
Study Limitations
First, we were only able to interrogate common genetic variants in the UK Biobank, future efforts should integrate rare coding variants once the full exome sequencing data become available. This will be particularly relevant considering their prominent role in dilated cardiomyopathy (Rosenbaum et al., 2020) and other cardiac disorders. Second, the ECG device to measure cardiac conduction consisted of only 3 electrodes that were attached to the limbs, these surface ECG parameters are not specific enough to identify the exact anatomical region of the heart. However, there are currently no single large genetic datasets available of more precise measurements, such that they could be derived from more sophisticated surface ECG equipment or intra-cardiac ECG measurements. Third, the individuals that our study is based on are predominantly of European ancestry, it is unclear if conclusions can be extrapolated to other ethnic groups. Fourth, this work is based on statistical analyses and does not provide functional experimental validation; the genetic variants and genes that are prioritized require further experimental validation.
Key Changes Prompted by Reviewer Comments
In response to reviewer comments we lightly modified our main text and figures to better highlight the main findings contained in them. Although the reviewers did not ask for more work, we added the genetic ECG signature of dilated cardiomyopathy as part of Figure 5. We also added additional information about the genes in the results section. For context, the complete transparent peer review record is included within the Supplemental Information.
STAR★METHODS
RESOURCE AVAILABILITY
Lead Contact
Further information and data requests should be directed to Niek Verweij (mail@niekverweij.com).
Data and Code Availability
Individual level data are available to researchers on successful application to the UK Biobank. Genome-wide summary statistics can be queried and downloaded from www.ecgenetics.org. Code to parse the data is available here at https://github.com/niekverw/ecgenetics. Supplementary data Figures S1–S4 are also available on Mendeley (https://doi.org/10.17632/rfnxmcb73c.1). Any additional information required to reproduce this work is available from the Lead Contact.
Materials Availability
This study did not generate new unique reagents.
METHOD DETAILS
UK Biobank Individuals
Participants were recruited with an age range of 40–69 that registered with a general practitioner of the UK National Health Service (NHS). Between 2006–2010, a total of 503,325 individuals were recruited to participate. All study participants provided informed consent and the study was approved by the North West Multi-center Research Ethics Committee. Detailed methods used by UK Biobank have been described elsewhere(Bycroft et al., 2018). The prevalence and incidence of cardiac conditions and events were captured by data collected at the Assessment Centre in-patient Health Episode Statistics (HES) download on September 10, 2017.
Genotyping and Imputation
The Wellcome Trust Centre for Human Genetics performed quality control before imputation, and imputed the genotypes to the HRC v1.1 reference panel that was released on March 7th 2018. For the current analysis, individual sample outliers excluded based on heterozygosity and missingness were excluded, as well as those with gender discrepancies between the reported and inferred gender using X-chromosome heterozygosity test. A detailed description of the quality control and imputation, is available elsewhere(Bycroft et al., 2018).
ECG Morphology Phenotypes and Quality Control
Three-lead exercise ECG data were provided by the UK Biobank as bulk in separate xml-files. To isolate R-waves, we employed the gQRS algorithm by George Moody, the construe algorithm was used to further refine the localization of R-waves (Teijeiro et al., 2018). Individual ECG beats were processed and averaged (Simson, 1981), which we refer to as the ‘ECG morphology’ phenotype.
Two entities of ECG morphology were constructed: The primary morphology trait was defined as the classical signal averaged electrocardiographic beat (Simson, 1981) that consisted of an averaged 1,000 ms window surrounding the R wave at a resolution of 500hz resulting in 500 averaged data points or ECG traits for each individual. As such, these beats were unadjusted for individual R-R intervals. The secondary ‘ECG morphology’ trait consisted of R-R intervals made of equal length (500 data points) so that the resulting averaged ECG beat was adjusted for each individual R-R interval.
Only information of the rest phase was used, as defined by the first 15 seconds of ECG assessment. From all 99,539 3-lead ECGs recorded in 96,567 participants, 77,190 ECGs contained full disclosure data necessary to detect R wave. The R-wave is traditionally used as a reference point to detect all other points on the ECG, hence this should be sufficient to identify major changes ECG beat, while also easy to understand and visualize.
Before signal averaging, ECG beats were quality controlled on the individual level. First, the 3-leads were averaged to create a single ECG signal vector. Then, individual beats containing excess noise were removed as described previously(van de Vegte et al., 2018; Verweij et al., 2018), this was based on a moving standard deviation using a window-size of 3 data points under the assumption that ECG signals without noise have a moving standard deviation close to 0. Thirdly, individual beats were matched on a template and discarded if they were dissimilar based on a Pearson correlation function between each beat; beats with mean negative correlations and those that fell outside the standard 1.5 interquartile range rule were removed. This procedure was repeated until no outlier beats were left to exclude. At least 6 beats were required at any stage of the averaging process; otherwise the entire electrocardiogram was excluded from the analysis. We explored whether the averaging process was improved when accounting for the lag at which the cross-correlation function between each ECG beats shows its maximum, but this did not make a difference; suggesting that the R-wave detection was already sufficient. In total 67,440 ECGs of 66,240 individuals passed the individual level quality control.
Finally, to further detect and exclude abnormal ECGs on the population level, we calculated the standard deviation of the difference between each averaged ECG beat of an individual and the population-mean averaged ECG beat; outliers were discarded according to the standard 1.5 interquartile range rule per ECG-phenotype. Observations of the second follow-up visits were used when no baseline observation was available. This resulted in the inclusion of 63,706 individuals in the primary analysis (unadjusted R-R intervals). The 2,534 excluded individuals based on population level QC were much more likely to be diagnosed with a history of bundle branch block (OR=16.8, se= 3.1, z=15.41), cardiomyopathy (OR=8.8 se=2.3, z=8.58), myocardial infarction (OR=2.9, se=0.27, z=12.2), atrial fibrillation (OR=2.0, se=0.25, z=5.6), and heart failure (OR=7.3, se=1.2,z=12.55). For the secondary morphology phenotype (where we adjusted for R-R intervals), 65,183 individuals remained.
Another 3,750 individuals with a history of myocardial infarction, atrial fibrillation, heart failure, cardiomyopathy, bundle-branch-block or pacemaker implantation were excluded in sensitivity analyses and Mendelian randomization analyses of dilated cardiomyopathy.
Diagnoses in UK Biobank were defined as follows: myocardial infarction (ICD10: I21, I22, I23, I252; ICD9: 410, 412 or self-reported myocardial infarction), atrial fibrillation (ICD10:I48; ICD9: 4273, OPCS-4: K621, K622, K623 or self-reported atrial fibrillation or flutter), heart failure (ICD10: I50, I110, I130, I132; ICD9: 428 or self-reported heart failure), cardiomyopathy (ICD10: I42, I43, O903, I255, O944; ICD9: 425 or self-reported cardiomyopathy or hypertrophic cardiomyopathy), dilated cardiomyopathy (ICD10:I42.0 or ICD9: 4254), bundle-branch-block (ICD10: I447, I451 or ICD9: 4263, 4264) or pacemaker implantation (OPCS-4: K59, K60, K61 or self-reported pacemaker or defibrillator insertion). Diagnoses in UK Biobank were extracted using https://github.com/niekverw/ukpheno.
Polygenic Scores of ECG-Traits and Known Genetic Variants
Polygenic risk scores were created following an additive model for atrial fibrillation, QT-interval, QRS duration, PR-interval, QRS-voltage traits (12-lead sum area, cornel area and Sokolow-Lyon area) and heart rate separately (Table S13), as previously described (Verweij et al., 2017). In short, the number of alleles for each individual (0, 1 or 2) was summed after multiplying the alleles with the previously reported effect size of the variant-trait association. Effect sizes estimated in UK Biobank data were avoided to reduce potential overestimation. If multiple effect sizes were available, those estimated in the largest sample size were used (e.g., the combined replication and discovery phase). Single-nucleotide polymorphisms were excluded if they were missing in UK Biobank data. In instances where multiple correlated variants in the same locus were reported for the same trait, we used only independent variants that were selected by the linkage disequilibrium clumping procedure (at r2 < 0.01) implemented in PLINK version 1.9.
Pathway Analyses and Candidate Genes
DEPICT was employed to discover pathways, tissues and genes underlying GWAS-loci of the electrocardiographic morphology phenotype. Please see Pers et al. for a detailed description of the method(Pers et al., 2015). All independently associated variants (r2>0.005) passing a traditional genome wide significance threshold P < 5 × 10⁻⁸ were used as input to the DEPICT framework. DEPICT was run using default settings. Because DEPICT uses 1000 Genomes as a reference panel which does not include certain UK Biobank specific variants, we also included all variants in LD (r2>0.8) with the input-variants to ensure 100% coverage of the signal. Pairwise correlations across all significantly enriched pathways (false discovery rate > 0.5%) were computed and visualized using the Gephi software (www.gephi.org) after filtering out edges with correlations lower than 0.5.
For the differential pathway analysis, we repeated the DEPICT pathway analysis but excluded variants that were of interest (variants-of-interest). We calculated the reduction in pathway enrichment by subtracting the −log10(P) for enrichment before and after excluding variants-of-interest. A null distribution was created by repeating the DEPICT run 100 times on the same set of variants but each time excluding a matched number of random variants not belonging to the variants-of-interest. If all 100 null runs indicated that the reduction in significance for a given pathway was more using the variants-of-interest than for the null runs (indicating Pdifferential<0.01), the pathway was considered to be differentially enriched for the variants-of-interest. Particularly, we were interested whether different biological pathways were active at different ECG intervals. To test this, we used the clusters of variants that were identified in the unbiased clustering approach by t-sne and k-means as ‘variants-of-interest’ (see Genetics and association testing); which grouped variants by their primary effect on the different ECG wave intervals in an unbiased manner.
Nearest gene or any gene within 10kb of the lead variants were used to annotate candidate causal genes. We also searched for coding variants in LD with the identified variants (r2>0.8) to further prioritize candidate causal genes. Variants were also annotated by proximity (250kb) to known rare genetic cardiac disease genes in Orphanet, code ORPHA:97929. An additional line of evidence for candidate causal genes was performed by DEPICT, taking into account gene-gene similarities across loci(Pers et al., 2015). We specifically did not incorporate annotations from datasets such as Hi-C and eQTL, as we strongly believe these may not be informative for cardiac conduction biology and need targeted experiments on a per locus basis to interpret them (Stacey et al., 2019; Wang and Goldstein, 2020).
Dilated Cardiomyopathy
The association between genetic variants and risk of dilated cardiomyopathy was tested in case-control GWASes of UK Biobank and MAGNet (Myocardial Applied Genomics Network) and combined via inverse-variance weighted meta-analysis to increase power totaling 1,375 cases and 241,325 controls.
In the UK Biobank cohort individuals with and without dilated cardiomyopathy were selected to be independent of those taking part in the ECG measurements. 744 dilated cardiomyopathy cases were identified according to ICD10 and ICD9 codes (I42.0 and 4254), 239,729 control individuals were not diagnosed with dilated cardiomyopathy and had no family history of heart disease. Association testing was performed as described under ‘Genetic and association testing’, coefficients were re-scaled to log odds.
For the MAGNet study, 631 subjects with dilated cardiomyopathy were recruited; patients were included in the study if they were diagnosed with heart failure with reduced ejection fraction (< 40%) in the absence of hypertension, primary valvular disease, or coronary artery disease from the University of Pennsylvania Health System; 1,596 controls were recruited from the same center who had no history of heart disease. All subjects provided written informed consent. Genotyping was performed on the Illumina OmniExpressExome Array and imputed using the 1000 Genomes Project with Minimac. Genotypes between cases and controls were compared using an additive genetic model adjusting for gender and two principal components of race using SNPtest; there was no genomic inflation (1.0335).
Early Repolarization
To assess the clinical relevance of the ECG morphology phenotypes in early repolarization, we diagnosed individuals 1,253 with and 11,463 without early repolarization of the Lifelines cohort. For this, 12-lead ECGs were manually curated by trained cardiologists for the presence of early repolarization according to the established definition by Haisaguerre and Macfarlane(Haïssaguerre et al., 2008; Macfarlane et al., 2015). The criteria for early repolarization were defined as an elevation of the J-point (R0.1 mV) in at least two corresponding leads above the level of QRS onset. Leads V1 to V3 were excluded from scoring to avoid confusion or overlap with Brugada syndrome or arrhythmogenic right ventricular dysplasia. The morphology of early repolarization was assessed as either notching, slurring or both. The ST segment was defined according to Tikkanen et al. as either rapidly ascending (concave) or horizontal descending(Tikkanen et al., 2011). ECGs with QRS duration > 120 ms or non-sinus rhythm (for example atrial fibrillation or pacemaker rhythm) were excluded from the analysis. Inter-observer correlations have been described previously(Bastiaenen et al., 2019).
Exhaustive Joint Conditional Analysis of the SCN5A Locus
The SCN5A locus has been reported in almost all cardiac conduction GWAS with various independent lead SNPs, it harbors many mutations causing different types of arrhythmias, and it encodes an essential sodium channel Nav1.5 that is a common target of anti-arrhythmic drugs. To further increase our understanding of complex genetics at SCN5A, we performed an exhaustive joint conditional analysis across all ECG datapoints. Finemapping this locus and understanding the consequences of the multiple genetic variants at play may improve our understanding of this gene and cardiac disease pathophysiology.
We performed an in-depth conditional analysis of this locus using information of the entire ECG using a deterministic approach. For this, a stepwise conditional analysis was conducted followed by the full model containing all of the identified SNPs P< × 10−8; after this the stepwise conditional analysis was redone with as starting point the SNPs that were also the lead SNP in the full model. This was repeated until all SNPs in the model were the lead associated SNP in the full model.
The first stepwise model including all 1309 variants between 38500000 and 38900000bp on chromosome 3 identified 11 genetic variants. After 3 iterations, a final model was constructed of 10 genetic variants that were independently associated and also the top-associated variants across all ECG association analyses. Please see Table S11 for more information on the exact configurations that were tested and Supplementary Data Figure S4 for the conditional regional association plots and impact on ECG morphology for both the univariate and joint (including all 10 variants) model.
Notably, all of the 10 genetic variants were located in a cardiac enhancer (https://pubs.broadinstitute.org/mammals/haploreg). When summarizing the overlap of all variants in the SCN5A region, only 21% overlapped with a cardiac enhancer. The fact that we find all (10 out of 10) genetic variants to overlap a cardiac enhancer represents a considerable enrichment (P=1×10⁻⁷, hypergeometric test) on the single locus level.
Previously identified genetic variants for Brugada syndrome at rs10428132 and rs11708996 were also found back as independent signals in this analysis. Rs10428132 was the genetic variant with the lowest P values overall and was fine-mapped to rs6801957; rs11708996 was in perfect LD with rs41312411, highlighting that this approach is able to capture disease relevant genetic variants. Both variants had a strong effect on the P-wave interval, whereas Brugada is characterized by ST abnormalities, the syndrome is also known to present a concealed abnormal atrial, P-wave, phenotype (Conte et al., 2018). Rs41312411 also has a specific effect on the beginning of the QRS-complex, which seems to affect Q-R duration and/or Q amplitude.
QUANTIFICATION AND STATISTICAL ANALYSIS
Genetics and Regression Analyses
All of the genetic analyses in UK Biobank that are reported in this manuscript have been adjusted for age, gender, BMI, height and the first 30 principal components (PCAs) to account for population stratification, and genotyping array (Affymetrix UK Biobank Axiom® array or Affymetrix UK BiLEVE Axiom array). The ECG variables were inverse rank normalized prior to association analyses
Genome wide association analyses in UK Biobank were performed using BOLT-LMM v2.3beta2. BOLT-LMM fits a mixed linear model that accounts for the population structure and cryptic relatedness.(Loh et al., 2015) For this, directly genotyped variants were used that passed quality control, and which were extracted from the imputed dataset to ensure 100% call rate, and pruned on linkage disequilibrium (first r2 < 0.05 and a second round of r2<0.045) to obtain roughly 400k variants across the genome. The genomic control lambda’s, heritability by BOLT-LMM, LD-Score intercepts and the attenuation ratio statistics are listed in Table S12, these suggested no inflation due to non-polygenic signals (Loh et al., 2018). Regression analyses of genetic risk scores and individual genetic variant associations across the ECG-morphologies were performed with sandwich robust standard errors that were clustered by family to account for relatedness in STATA-MP v15. Families were inferred from the kinship matrix, clustering all 3rd degree relatives or higher together (kinship coefficient > 0.0442).
For the GWAS we focused on the ECG morphology unadjusted for R-R interval as it was more powerful compared to the R-R adjusted morphology phenotype; higher heritability, captured the large majority of previously identified genetic variants of the ECG and was easiest to interpret. We performed 500 GWASes, one for each time-point. Using an eigenvalue-based measure(Galwey, 2009), we estimated that testing the 500 ECG data points resulted in effectively 79.9 independent tests and therefore used an alpha of 5×10⁻⁸/80 = 6.25×10⁻¹⁰ to indicate Bonferroni corrected genome wide significance.
Normalized association profiles of variants were plotted as heatmaps where red colors indicate the most strongly associated effect at a time point and the blue color the most strongly associated effect in the opposite direction. To visualize the similarities further on a 2-d plot, we used dimensionality reduction by t-sne on these normalized association profiles for all genome-wide variants, and k-means for clustering. This method only provides a global overview of the primary effects among variants.
Mendelian Randomization
Lead variants associated at P < 5 × 10⁻⁸ were used as instrumental variables in the MR. Enrichment of low P values (P < 0.05) among variants was calculated using a binomial distribution. Mendelian randomization analyses included the inverse-variance-weighted fixed-effects, random-effects metaanalyses and weighted median. Heterogeneity was assessed through I2 index and Cochran’s Q. Pleiotropy analyses included the MR-Egger intercept, MR-RAPS and MR-LASSO estimates(Slob and Burgess, 2019). MR pleiotropy residual sum and outlier (MR-PRESSO)(Verbanck et al., 2018) was used as MR analysis to detect and remove pleiotropic variants. MR-PRESSO accounts for pleiotropic effects of the genetic variants comparing the observed distance of all the variants to the regression line (residual sum of squares) to the expected distance under the null hypothesis of no horizontal pleiotropy. MR-PRESSO is based on the assumption that at least 50% of the variants are valid instruments.
For the Mendelian randomization of dilated cardiomyopathy, variant effects on the ECG morphology at −18 ms were estimated using only individuals without a history of cardiac disease. We performed an additional analysis to explore the impact of pleiotropic signals by conducting a 2-stage Mendelian randomization using a discovery and replication stage. First, we assessed the causal relationship in UK Biobank and identified pleiotropic outliers by MR-PRESSO. Secondly, we replicated this analysis by repeating the MR in an independent cohort of 631 dilated cardiomyopathy patients from MAGNet. In this second stage, we excluded the variants identified by MR-PRESSO in the first stage, hence correcting for pleiotropic effects in an unbiased manner.
Supplementary Material
KEY RESOURCE TABLE
Highlights.
Spatiotemporal analysis of the electrocardiogram identifies over 300 genetic loci
Individual genetic variants exhibit unique electrocardiographic signatures
A particular genetic ECG signature is associated with dilated cardiomyopathy
Disease-associated variants can be found using the electrocardiogram
ACKNOWLEDGMENTS
This research has been conducted using the UK Biobank Resource under application number 12010. We thank Ruben N. Eppinga, Tom Hendriks, M. Yldau van der Ende, Yanick Hagemeijer, Hilde Groot, Jan-Walter Benjamins, and Ming W. Yeung; University of Groningen, University Medical Center Groningen, and Department of Cardiology, for their contributions to the extraction and processing of data in the UK Biobank. None of the mentioned contributors received compensation, except for their employment at the University Medical Center Groningen.
We thank the Center for Information Technology of the University of Groningen for their support and for providing access to the Peregrine high-performance computing cluster. In addition, we thank the “Medische en Informatie Technologie Systeembeheer” of the University Medical Center of Groningen for their support and maintenance of our own computing cluster.
The work of N.V. was supported by NWO VENI grant 016.186.125. The work of M.P.M. and T.P.C. was supported by NIH grants HL105993 and HL088577. The work of A.T., T.T., and W.R. was supported by the German Center for Cardiovascular Research (DZHK Shared Expertise SE081 - STATS). The funders had no role in the design and conduct of the study; collection, management, analysis, and interpretation of the data; preparation, review, or approval of the manuscript; or decision to submit the manuscript for publication.
Footnotes
DECLARATION OF INTERESTS
N.V. is a paid consultant for Regeneron Pharmaceuticals. The other authors declare no competing interests.
SUPPLEMENTAL INFORMATION
Supplemental Information can be found online at https://doi.org/10.1016/j.cels.2020.08.005.
A record of this paper’s transparent peer review process is included in the Supplemental Information.
REFERENCES
- AlGhatrif M, and Lindsay J (2012). A brief review: history to understand fundamentals of electrocardiography. J. Community Hosp. Intern. Med. Perspect 2. [DOI] [PMC free article] [PubMed] [Google Scholar]
- Arking DE, Pulit SL, Crotti L, Van Der Harst P, Munroe PB, Koopmann TT, Sotoodehnia N, Rossin EJ, Morley M, Wang X, et al. (2014). Genetic association study of QT interval highlights role for calcium signaling pathways in myocardial repolarization. Nat. Genet 46, 826–836. [DOI] [PMC free article] [PubMed] [Google Scholar]
- Bastiaenen R, Nolte IM, Munroe PB, Riese H, Nelson C, O’Connor H, Gang Y, Warren HR, Cabrera C, Reinhard W, et al. (2019). The narrow-sense and common single nucleotide polymorphism heritability of early repolarization. Int. J. Cardiol 279, 135–140. [DOI] [PubMed] [Google Scholar]
- Bihlmeyer NA, Brody JA, Smith AV, Warren HR, Lin H, Isaacs A, Liu CT, Marten J, Radmanesh F, Hall LM, et al. (2018). ExomeChip-wide analysis of 95 626 individuals identifies 10 novel loci associated with QT and JT intervals. Circ. Genom. Precis. Med 11, e001758. [DOI] [PMC free article] [PubMed] [Google Scholar]
- Bozkurt B, Colvin M, Cook J, Cooper LT, Deswal A, Fonarow GC, Francis GS, Lenihan D, Lewis EF, McNamara DM, et al. (2016). Current diagnostic and treatment strategies for specific dilated cardiomyopathies: a scientific statement from the American Heart Association. Circulation 134, e579–e646. [DOI] [PubMed] [Google Scholar]
- Bycroft C, Freeman C, Petkova D, Band G, Elliott LT, Sharp K, Motyer A, Vukcevic D, Delaneau O, O’Connell J, et al. (2018). The UK Biobank resource with deep phenotyping and genomic data. Nature 562, 203–209. [DOI] [PMC free article] [PubMed] [Google Scholar]
- Christophersen IE, Magnani JW, Yin X, Barnard J, Weng LC, Arking DE, Niemeijer MN, Lubitz SA, Avery CL, Duan Q, et al. (2017). Fifteen genetic loci associated with the electrocardiographic P wave. Circ. Cardiovasc. Genet 10. [DOI] [PMC free article] [PubMed] [Google Scholar]
- Calkins H, Corrado D, and Marcus F (2017). Risk stratification in arrhythmogenic right ventricular cardiomyopathy. Circulation 136, 2068–2082. [DOI] [PMC free article] [PubMed] [Google Scholar]
- Conte G, Caputo ML, Volders PGA, Luca A, Mainardi L, Schotten U, Corino VDA, Regoli F, Zeemering S, Zink M, et al. (2018). Concealed abnormal atrial phenotype in patients with Brugada syndrome and no history of atrial fibrillation. Int. J. Cardiol 253, 66–70. [DOI] [PubMed] [Google Scholar]
- Das MK, and Zipes DP (2012). Electrocardiography of Arrhythmias: A Comprehensive Review: A Companion to Cardiac Electrophysiology: From Cell to Bedside (Elsevier/Saunders; ). [Google Scholar]
- Eppinga RN, Hagemeijer Y, Burgess S, Hinds DA, Stefansson K, Gudbjartsson DF, Van Veldhuisen DJ, Munroe PB, Verweij N, and Van Der Harst P (2016). Identification of genomic loci associated with resting heart rate and shared genetic predictors with all-cause mortality. Nat. Genet 48, 1557–1563. [DOI] [PubMed] [Google Scholar]
- Galwey NW (2009). A new measure of the effective number of tests, a practical tool for comparing families of non-independent significance tests. Genet. Epidemiol 33, 559–568. [DOI] [PubMed] [Google Scholar]
- Haïssaguerre M, Derval N, Sacher F, Jesel L, Deisenhofer I, de Roy L, Pasquié JL, Nogami A, Babuty D, Yli-Mayry S, et al. (2008). Sudden cardiac arrest associated with early repolarization. N. Engl. J. Med 358, 2016–2023. [DOI] [PubMed] [Google Scholar]
- Hu R, Morley MP, Brandimarto J, Tucker NR, Parsons VA, Zhao SD, Meder B, Katus HA, Rühle F, Stoll M, et al. (2018). Genetic reduction in left ventricular protein kinase C-α and adverse ventricular remodeling in human subjects. Circ. Genom. Precis. Med 11, e001901. [DOI] [PMC free article] [PubMed] [Google Scholar]
- Japp AG, Gulati A, Cook SA, Cowie MR, and Prasad SK (2016). The diagnosis and evaluation of dilated cardiomyopathy. J. Am. Coll. Cardiol 67, 2996–3010. [DOI] [PubMed] [Google Scholar]
- Liao WC, Juo LY, Shih YL, Chen YH, and Yan YT (2017). HSPB7 prevents cardiac conduction system defect through maintaining intercalated disc integrity. PLoS Genet. 13, e1006984. [DOI] [PMC free article] [PubMed] [Google Scholar]
- Loh PR, Kichaev G, Gazal S, Schoech AP, and Price AL (2018). Mixed-model association for biobank-scale datasets. Nat. Genet 50, 906–908. [DOI] [PMC free article] [PubMed] [Google Scholar]
- Loh PR, Tucker G, Bulik-Sullivan BK, Vilhjálmsson BJ, Finucane HK, Salem RM, Chasman DI, Ridker PM, Neale BM, Berger B, et al. (2015). Efficient Bayesian mixed-model analysis increases association power in large cohorts. Nat. Genet 47, 284–290. [DOI] [PMC free article] [PubMed] [Google Scholar]
- Macfarlane PW, Antzelevitch C, Haissaguerre M, Huikuri HV, Potse M, Rosso R, Sacher F, Tikkanen JT, Wellens H, and Yan GX (2015). The early repolarization pattern: a consensus paper. J. Am. Coll. Cardiol 66, 470–477. [DOI] [PubMed] [Google Scholar]
- Marston S (2017). Obscurin variants and inherited cardiomyopathies. Biophys. Rev 9, 239–243. [DOI] [PMC free article] [PubMed] [Google Scholar]
- Meder B, Rühle F, Weis T, Homuth G, Keller A, Franke J, Peil B, Lorenzo Bermejo J, Frese K, Huge A, et al. (2014). A genome-wide association study identifies 6p21 as novel risk locus for dilated cardiomyopathy. Eur. Heart J 35, 1069–1077. [DOI] [PubMed] [Google Scholar]
- Nielsen JB, Thorolfsdottir RB, Fritsche LG, Zhou W, Skov MW, Graham SE, Herron TJ, McCarthy S, Schmidt EM, Sveinbjornsson G, et al. (2018). Biobank-driven genomic discovery yields new insight into atrial fibrillation biology. Nat. Genet 50, 1234–1239. [DOI] [PMC free article] [PubMed] [Google Scholar]
- Pers TH, Karjalainen JM, Chan Y, Westra HJ, Wood AR, Yang J, Lui JC, Vedantam S, Gustafsson S, Esko T, et al. (2015). Biological interpretation of genome-wide association studies using predicted gene functions. Nat. Commun 6, 5890. [DOI] [PMC free article] [PubMed] [Google Scholar]
- Prins BP, Mead TJ, Brody JA, Sveinbjornsson G, Ntalla I, Bihlmeyer NA, van den Berg M, Bork-Jensen J, Cappellani S, Van Duijvenboden S, et al. (2018). Exome-chip meta-analysis identifies novel loci associated with cardiac conduction, including ADAMTS6. Genome Biol. 19, 87. [DOI] [PMC free article] [PubMed] [Google Scholar]
- Roselli C, Chaffin MD, Weng LC, Aeschbacher S, Ahlberg G, Albert CM, Almgren P, Alonso A, Anderson CD, Aragam KG, et al. (2018). Multi-ethnic genome-wide association study for atrial fibrillation. Nat. Genet 50, 1225–1233. [DOI] [PMC free article] [PubMed] [Google Scholar]
- Rosenbaum AN, Agre KE, and Pereira NL (2020). Genetics of dilated cardiomyopathy: practical implications for heart failure management. Nat. Rev. Cardiol 17, 286–297. [DOI] [PubMed] [Google Scholar]
- Sadrieh A, Domanski L, Pitt-Francis J, Mann SA, Hodkinson EC, Ng CA, Perry MD, Taylor JA, Gavaghan D, Subbiah RN, et al. (2014). Multiscale cardiac modelling reveals the origins of notched T waves in long QT syndrome type 2. Nat. Commun 5, 5069. [DOI] [PubMed] [Google Scholar]
- Simson MB (1981). Use of signals in the terminal QRS complex to identify patients with ventricular tachycardia after myocardial infarction. Circulation 64, 235–242. [DOI] [PubMed] [Google Scholar]
- Slob EAW, and Burgess S (2019). A comparison of robust Mendelian randomization methods using summary data. bioRxiv https://www.biorxiv.org/content/10.1101/577940v1. [DOI] [PMC free article] [PubMed] [Google Scholar]
- Stacey D, Fauman EB, Ziemek D, Sun BB, Harshfield EL, Wood AM, Butterworth AS, Suhre K, and Paul DS (2019). ProGeM: a framework for the prioritization of candidate causal genes at molecular quantitative trait loci. Nucleic Acids Res. 47, e3. [DOI] [PMC free article] [PubMed] [Google Scholar]
- Stark K, Esslinger UB, Reinhard W, Petrov G, Winkler T, Komajda M, Isnard R, Charron P, Villard E, Cambien F, et al. (2010). Genetic association study identifies HSPB7 as a risk gene for idiopathic dilated cardiomyopathy. PLoS Genet. 6, e1001167. [DOI] [PMC free article] [PubMed] [Google Scholar]
- Teijeiro T, Felix P, Presedo J, and Castro D (2018). Heartbeat classification using abstract features from the abductive interpretation of the ECG. IEEEJ. Biomed. Heal. Inform 22, 409–420. [DOI] [PubMed] [Google Scholar]
- Teumer A, Trenkwalder T, Kessler T, Jamshidi Y, van den Berg ME, Kaess B, Nelson CP, Bastiaenen R, de Bortoli M, Rossini A, et al. (2019). KCND3 potassium channel gene variant confers susceptibility to electrocardiographic early repolarization pattern. JCI Insight 4, e131156. [DOI] [PMC free article] [PubMed] [Google Scholar]
- Tikkanen JT, Junttila MJ, Anttonen O, Aro AL, Luttinen S, Kerola T, Sager SJ, Rissanen HA, Myerburg RJ, Reunanen A, and Huikuri HV (2011). Early repolarization: electrocardiographic phenotypes associated with favorable long-term outcome. Circulation 123, 2666–2673. [DOI] [PubMed] [Google Scholar]
- van de Vegte YJ, van der Harst P, and Verweij N (2018). Heart rate recovery 10 seconds after cessation of exercise predicts death. J. Am. Heart Assoc 7, e008341. [DOI] [PMC free article] [PubMed] [Google Scholar]
- van den Berg ME, Warren HR, Cabrera CP, Verweij N, Mifsud B, Haessler J, Bihlmeyer NA, Fu Y-P, Weiss S, Lin HJ, et al. (2017). Discovery of novel heart rate-associated loci using the exome Chip. Hum. Mol. Genet 26, 2346–2363. [DOI] [PMC free article] [PubMed] [Google Scholar]
- van der Harst P, van Setten J, Verweij N, Vogler G, Franke L, Maurano MT, Wang X, Mateo Leach I, Eijgelsheim M, Sotoodehnia N, et al. (2016). 52 Genetic loci influencing myocardial mass. J. Am. Coll. Cardiol 68, 1435–1448. [DOI] [PMC free article] [PubMed] [Google Scholar]
- van Setten J, Brody JA, Jamshidi Y, Swenson BR, Butler AM, Campbell H, Del Greco FM, Evans DS, Gibson Q, Gudbjartsson DF, et al. (2018). PR interval genome-wide association meta-analysis identifies 50 loci associated with atrial and atrioventricular electrical activity. Nat. Commun 9, 2904. [DOI] [PMC free article] [PubMed] [Google Scholar]
- Verbanck M, Chen CY, Neale B, and Do R (2018). Detection of widespread horizontal pleiotropy in causal relationships inferred from Mendelian randomization between complex traits and diseases. Nat. Genet 50, 693–698. [DOI] [PMC free article] [PubMed] [Google Scholar]
- Verweij N, Eppinga RN, Hagemeijer Y, and Van Der Harst P (2017). Identification of 15 novel risk loci for coronary artery disease and genetic risk of recurrent events, atrial fibrillation and heart failure. Sci. Rep 7, 2761. [DOI] [PMC free article] [PubMed] [Google Scholar]
- Verweij N, Mateo Leach IM, Isaacs A, Arking DE, Bis JC, Pers TH, Van Den Berg ME, Lyytikäinen LP, Barnett P, Wang X, et al. (2016). Twenty-eight genetic loci associated with ST-T-wave amplitudes of the electrocardiogram. Hum. Mol. Genet 25, 2093–2103. [DOI] [PMC free article] [PubMed] [Google Scholar]
- Verweij N, Van De Vegte YJ, and Van Der Harst P (2018). Genetic study links components of the autonomous nervous system to heart-rate profile during exercise. Nat. Commun 9, 898. [DOI] [PMC free article] [PubMed] [Google Scholar]
- Verweij N, Mateo Leach I, van den Boogaard M, van Veldhuisen DJ, Christoffels VM, LifeLines Cohort Study, Hillege HL, van Gilst WH, Barnett P, de Boer RA, and van der Harst P (2014). Genetic determinants of P wave duration and PR segment. Circ. Cardiovasc. Genet 7, 475–481. [DOI] [PMC free article] [PubMed] [Google Scholar]
- Villard E, Perret C, Gary F, Proust C, Dilanian G, Hengstenberg C, Ruppert V, Arbustini E, Wichter T, Germain M, et al. (2011). A genome-wide association study identifies two loci associated with heart failure due to dilated cardiomyopathy. Eur. Heart J 32, 1065–1076. [DOI] [PMC free article] [PubMed] [Google Scholar]
- Wang X, and Goldstein DB (2020). Enhancer domains predict gene pathogenicity and inform gene discovery in complex disease. Am. J. Hum. Genet 106, 215–233. [DOI] [PMC free article] [PubMed] [Google Scholar]
- Ward LD, and Kellis M (2016). HaploReg v4: systematic mining of putative causal variants, cell types, regulators and target genes for human complex traits and disease. Nucleic Acids Res. 44, D877–D881. [DOI] [PMC free article] [PubMed] [Google Scholar]
Associated Data
This section collects any data citations, data availability statements, or supplementary materials included in this article.
Supplementary Materials
Data Availability Statement
Individual level data are available to researchers on successful application to the UK Biobank. Genome-wide summary statistics can be queried and downloaded from www.ecgenetics.org. Code to parse the data is available here at https://github.com/niekverw/ecgenetics. Supplementary data Figures S1–S4 are also available on Mendeley (https://doi.org/10.17632/rfnxmcb73c.1). Any additional information required to reproduce this work is available from the Lead Contact.