Abstract
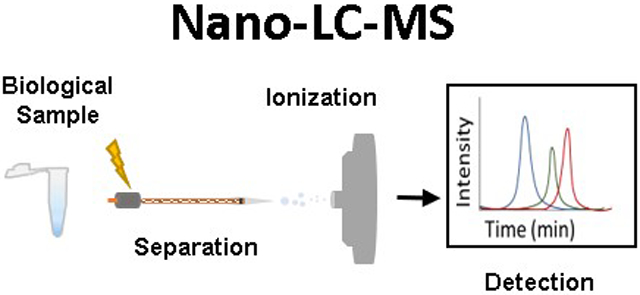
Liquid chromatography coupled to mass spectrometry (LC-MS) is one of the most powerful tools in identifying and quantitating molecular species. Decreasing column diameter from the millimeter to micrometer scale is now a well-developed method which allows for sample limited analysis. Specific fabrication of capillary columns is required for proper implementation and optimization when working in the nanoflow regime. Coupling the capillary column to the mass spectrometer for electrospray ionization (ESI) requires reduction of the subsequent emitter tip. Reduction of column diameter to capillary scale can produce improved chromatographic efficiency and the reduction of emitter tip size increased sensitivity of the electrospray process. This improved sensitivity and ionization efficiency is valuable in analysis of precious biological samples where analytes vary in size, ion affinity, and concentration. In this review we will discuss common approaches and challenges in implementing nLC-MS methods and how the advantages can be leveraged to investigate a wide range of biomolecules.
Graphical Abstract
Introduction
Investigations into the broad scope of systems biology drives the need to improve sensitivity for analytical platforms amenable to small samples. Liquid chromatography-mass spectrometry (LC-MS) has been critical in identifying and quantitating biomolecules for both targeted and untargeted analysis of proteins, lipids, and metabolites. The benefit of reducing column internal diameter (i.d.) in capillary/nano Liquid Chromatography-Mass Spectrometry (nLC-MS) improves analytical figures of merit and is beneficial for sample limited cases. This review will examine advantages and difficulties in capillary liquid chromatography, common fabrication techniques, and recent applications in metabolomics, lipidomic, proteomics, and glycomics.
The development of nano-LC or nLC, offers the benefit of low sample and solvent demands, as well as enhanced sensitivity with MS. This has allowed work with smaller volume and less concentrated samples. Capillary dimensions defined here are columns <0.5 mm i.d. and lengths usually less than 30cm. Coupling nLC to MS can be achieved using commercially available interfaces, though some interfaces are made in-house. Reducing the i.d. of the column to capillary dimensions inherently reduces the volumetric flow rates when maintaining similar linear velocities. The small dimensions and low flow rates required for nLC are well suited to produce improved electrospray ionization (ESI) leading to lower limits of detection.
LC is a mainstay for bioanalytical separations given its high sample loading capacity and ability to resolve a wide range of biomolecules.1, 2 Chromatographic resolution arises from multiple factors including how narrow the eluting band is maintained over how far it travels down the column or capillary. Column separation efficiency is defined by the number (N) and height (H) of theoretical plates. This plate height can be defined by the van Deemter equation (Equation 1). Three main column factors affect performance in LC including Eddy-diffusion (A), longitudinal diffusion (B), and resistance to mass transfer (C). Reducing the contributions of these parameters reduces the plate height, improving the column’s separation capabilities. For more in-depth analysis of the van Deemter equation, the review by Gritti and Guiochon is recommended.3
| (1) |
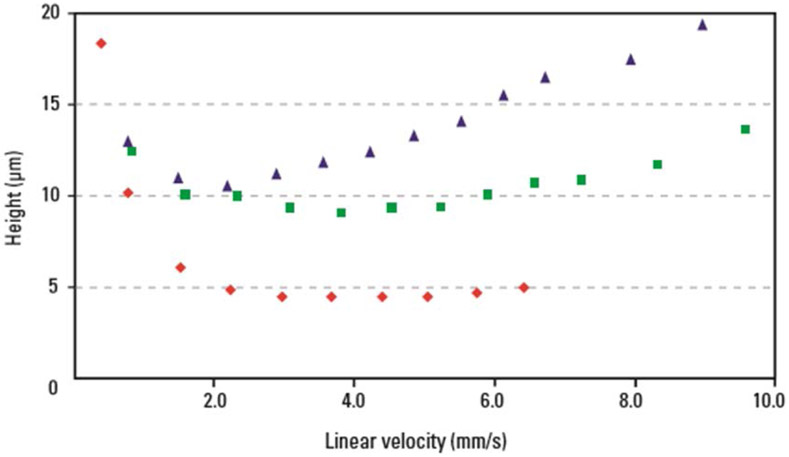
The desire for smaller plate heights led to the development and use of smaller diameter particles as both the A and C terms are reduced with decreased particle size.4-6 The smaller particles reduce band broadening via eddy-diffusion producing more uniform packed columns reducing the plate height at optimum velocity shown in Figure 1. The limitation with these smaller particles is the increased pressure associated with flowing through a system.6 For example, a 150 mm x 2.1 mm column packed with 3μm particles produces a back pressure of about 140 bar at 200 μL/min aqueous solvent while the same column packed with 1 μm particles at the same linear velocity experiences a back pressure around 1250 bar. The 400 bar pressure limitation of most traditional HPLC pumps restricted the use of these smaller particles to shorter columns to reduce the pressure drop and ultimately leading to the development of superficially porous particles.7
Figure 1.
Van Deemter curves generated for hexylbenzene on particles that are 1.7 μm (red diamonds), 3.5 μm (green squares), and 5.0 μm (blue triangles) in diameter. The column dimensions were 2.1 × 50 mm operated at 25°C with mobile phase 7:3 acetonitirile: water. Reprinted with permission from: U. D. N. Jeffrey R. Mazzeo, Marianna Kele, and Robert S. Plumb, Analytical Chemistry, 2005, 77, 460 A-467 A.
nLC holds distinct benefits with regards to column efficiency and subsequent resolution. Separation efficiency is affected by both the particle size and uniformity of the packed bed. A more uniform bed means the path length traveled by all analytes is more similar reducing the plate height even further (reducing multipath term).8 The smaller the column i.d. the more uniform packing is produced. Fused silica tubing like that used in gas chromatography can be filled with stationary phase, producing capillary/nano columns. These columns provide reduced cost in stationary phase, solvent, and sample consumption making them ideal for separations requiring expensive solvents and packing material or limited sample volume. In addition, capillary columns dissipate heat generation from higher flow rates making them most suited for applications in ultra-high-pressure liquid chromatography (UHPLC) where separations are developed with small particles with optimization for time with faster flow rates or efficiency with longer columns.
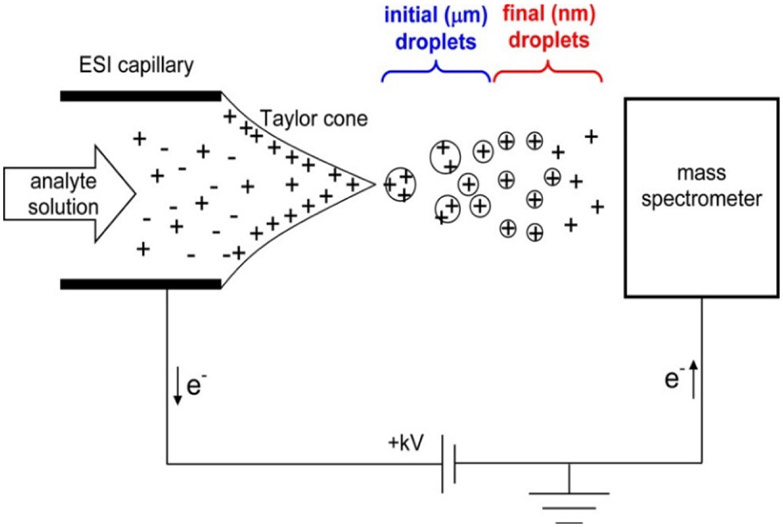
Capillary columns pose sensitivity challenges for pathlength dependent UV-Vis detection, but provide increased sensitivity for ESI based MS. ESI-MS is improved with lower flow rates.9, 10 In addition to reduced flow rates, silica capillary can be used to produce emitter tips with micrometer9, 11, 12 to nanometer13-16 dimensions (nano-ESI) which produces smaller initial droplets improving desolvation for the electrospray process depicted in Figure 2.17, 18 The reduced droplet size also means less analytes per droplet, thought to reduce clustering and competing ionization.9, 11, 19 These improvements result in an increased ionization efficiency compared to conventional ESI.
Figure 2.
Mechanism of electrospray ionization operating in positive ion mode. The applied voltage results in the formation of a Taylor cone followed by coulombic explosion resulting in the desolvation and ionization. Reprinted with permission from: L. Konermann, E. Ahadi, A. D. Rodriguez and S. Vahidi, Analytical Chemistry, 2013, 85, 2-9.
Performing nLC-MS on biomolecules requires multiple considerations and adaptations from conventional bore LC-MS, including sample injection, fritting of the column, manufacturing the capillary column, and interfacing with the MS.
Sample Injection Methods
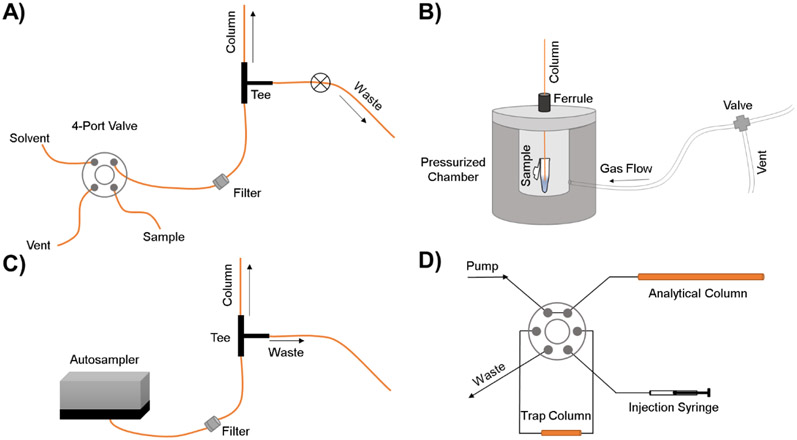
Capillary columns are advantageous for small volume injections. Capillary columns require non-standard methods of injection to prevent over-loading the mass capacity of the column as well as maintaining high efficiency zones/peaks. Conventional volume injection methods generally mismatch with capillary columns and results in large amount of band broadening. Major problems with injection volumes in the nanoliter regime come from issues with reproducibility and band broadening from dead volume between connections.20 To overcome these issues, common methods of injection using gas pressure driven injections, continuous split flow and static21 injections, and trap columns are used shown in Figure 3.
Figure 3.
Schematic illustrating common nano-injection methods (A) four-port injector method. (B) Gas pressure driven injection. (C) Split flow injection method. (D) trap column injection method.
Static injection systems are comprised of a four-port, tee, and waste control valve. The injection is performed by opening the waste control valve, actuating the four port and loading the tee with sample, actuating the four-port back to the flow system to flush excess sample out of the tee, and then closing the waste control valve to perform the separation (Figure 3A). This injection results in the majority of sample being wasted but has been shown to produce reproducible results for open-tubular column separations. The injection volume is calculated using the time the sample was injected before the waste control valve was opened instead of split ratios.
Gas pressure driven injections introduce the lowest band broadening and use the least amount of sample but require manual removal and replacement of the capillary column from the set-up increasing the time between injections. The general set-up is depicted in Figure 3B. The capillary column is threaded through a ferrule and placed inside a sample reservoir. The ferrule is then tightened to keep the column in place prior to pressurizing the sample reservoir using a gas cylinder. The injection volume can be calculated using constant gas pressure and variable time. The pressurized system forces nanoliter sample volumes onto the column. This manual injection can lead to reproducibility issues between injections between researchers but consumes the smallest sample volume. This makes it ideal for limited sample analysis. The re-attachment of the column to the system post injection requires the cessation of flow. The sudden re-pressurization of the LC system can be problematic for separations leading researchers to utilize a six-port to sequester the system from the column until proper positioning and adjustments are made.
Split flow injections enable a capillary column to be used with a traditional HPLC system. This set-up uses a cross or T-connection where most of the solvent from the HPLC system is flowing to waste via the split, and only a small fraction is being diverted to the column for separation (Figure 3C). It is important to note that the split determines pressure for the solvent flow on the column, not the capillary column. A large portion of the initial flow is sent through the split and a small fraction through the column (usually 1:100 or 1:1,000 split ratio). The split ratio is determined by the ratio of flow resistance of the column to flow resistance of the split. The set-up is best for large sample number analysis as it allows for easy disassembly for troubleshooting, column replacement and modification, and delivers nanoliter injection volumes to the column preventing column overloading and fouling. It is important to note that because the system is split, the injection volume even with an autosampler is between 1–10 μL with the majority of sample and solvent being sent to waste.
Trap columns were introduced as a solution to the column overloading and clogging observed in split-less systems. Under nano-flow conditions with flow rates on the order of 100 nL/min, a standard 1 μL autosampler injection loop would take 10 minutes to flush. In addition, injecting 1 μL of sample onto a 15 cm column with 50 μm diameter would result in an injection volume almost 10 times the column volume. This over-injection leads to poor chromatographic performance and increases the likelihood of clogging or fouling the column. Trap columns are traditionally larger in column diameter than the subsequent separation capillary and use larger particle size stationary phase which allows samples to be loaded more quickly. Trap columns need to be complementary to the separation of the analytical column commonly achieved by using a C18 stationary phase and isocratic solvent.
The elution of the sample from the trap column can be done via forward elution or reverse elution depicted in Figure 3D. Forward elution uses one pump with a linear solvent delivery through the trap column onto the analytical column. Reverse elution uses two pumps where the first pump is used to push the sample onto the trap column, and then a second pump is used to apply flow in the reverse direction onto the analytical column. The reverse elution is often used when forward elution results in band broadening as the sample travels across the trap column. The introduction of a trap column prior to the analytical separation column works to reduce loading time, clean-up complex samples, and keeps mass on column high without over-loading leading to lower detection limits but increases cost and separation complexity.
Commercial injectors are available for small volume injections from companies such as VICI where there is an internal sample groove that is filled. These have high pressure limits and are reproducible but require the dedication of resources to only one injection volume and require manual fill. Multi-ports have been used to avoid the one-purpose system of nano-injectors. The groove injection22 method is described as a system that allows the sample to be continuously recycled through a sample groove of a 12-port and can inject depending on resistor configuration anywhere from 30 nL to over 2000 nL seen in Figure 4. The major factor in the success of this injection method is the resistor added in position 2. This is because the more resistance placed at position 2, the more sample from the mixer volume is injected onto the column and dilution of the sample increases plate height. This method is advantageous that any lab with an 8 or 12-port valve can be used but still requires more sample than needed for an injection to maintain the continuous flow into the injector groove. More recently, a three-valve system has been created that incorporates two six ports and a nanoliter valve to provide the flexibility of both microliter and nanoliter injection volumes but has not been tested on a nLC system for suitability.23
Figure 4.
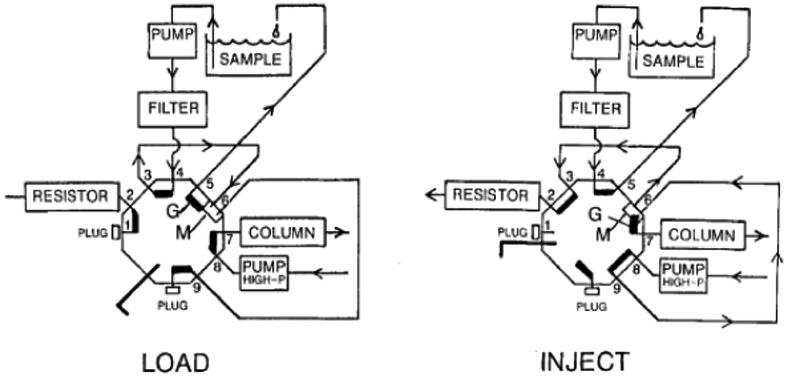
Groove injection method using a 12-port system in the load (left) and inject (right) position. Reprinted with permission from : V. Berry and K. Lawson, Journal of High Resolution Chromatography, 1988, 11, 121-123.
Types of frits
All columns packed with particles require a way to hold the packing material in place i.e. prevent the particles from escaping through the column exit. Frits are porous material placed at the exit of the column which traps the stationary phase particles in place and allow the stationary phase to pack behind it while solvent flows through. Frits are also used at the back of capillary columns to prevent loss of stationary phase under sudden depressurization. The small column volume necessitates reducing dead volume wherever possible, and so frits are often fabricated within the column to prevent additional connections. Frits can be made in a variety of ways, and the type of frit used is often related to the pressure requirements of the system and the need for precision in placement.24 Conventional columns have frits held in place at the end of the stainless steel column by a mechanically held steel cap. Capillary columns need to have frits that can withstand high pressure and be placed in specific locations within the capillary.
UV initiated monoliths are common capillary frits as the irradiation is easily controlled providing a tunable system for both size and permeability. The formation of a monolith requires a mixture of a crosslinker, monomer, porogen, and an initiator. UV initiated monolith preparation requires either the removal of the polyimide coating in the desired section, or the use of UV permeable silica capillary equipped with a masking sleeve. Removing the polyimide coating can be accomplished via application of flame, electrical resistance, or manual scraping with a razor. Recent work with UV initiated monoliths used UV-light emitting diodes reducing fabrication costs.25 Photopolymerizations offers the benefit of exact placement with the drawbacks of pressure limit and preparation time. These frits are best used in applications where pressure limits and column fragility at the frit are not concerns. These frits are not recommended for ultrahigh pressure analysis.
Thermal initiation can also be used to form monolith frits but has traditionally been used as inlet frits due to less spatial control and longer polymerization. Recent work with thermal initiation has reported fast polymerization (<2 minutes) with spatial control producing a functioning frit of approximately 1 cm These monolith frits offer advantages in low resistance, integrity at pressures up to 400 bar, and fast polymerization times. A specific type of monolith frit called a sol-gel frit is made using a silica gel reaction and can be polymerized using either heat or photoinitiation creating reproducible and mechanically strong frits using either techniques.
Fabrication methods using metal26, silica27, or stationary phase28, 29 have also been used to produce on column frits. Sintering is a method of frit fabrication where loose particles of steel, silica, or stationary phase are fused together to form the frit. Sintering is achieved quickly with heat generated from an oven, electrical resistance, heated probes, or most commonly flame. The frits generated from sintering have shown high mechanical resistance with both silica and stainless steel; with silica sintered frits being used in UHPLC at pressures greater than 1200 bar.
Unconventional frits include those made from magnetic fritting, single particles, and microstructured photonic fibers. Magnetic frits are created by using a magnetic field to isolate magnetic particles in the desired position within the silica capillary.30, 31 Columns with magnetic frits showed comparable performance to those with sintered frits and were able to sustain pressures up to 211 bar.30 Single particle frits are created using one single highly permeable silica particle that is slightly larger than the column or tapered tip diameter.32-34 This single particle reduces void volume and is placed using a capillary with an outer diameter smaller than the inner diameter of the desired capillary column. The particle stays in place due to small particulate that surrounds the particle (fines) creating a keystone effect. Single particle frits are reported to have high reproducibility and mechanical stability at pressures up to 6,000 psi (413 bar).32 Commercially available microstructured photonic fibers (MPFs) can be inserted and sealed into wide-bore capillary (150 μm) using a solvent compatible Sylgard 184 PDM glue.35 The inserted MPFs produce an integrated frit and emitter tip with comparable performance to monolith prepared frits robust up to 300 bar with reduced production time.
Types of Capillary Columns
Samples can be separated on a wide variety of capillary columns including commercially available stationary phase particles, monoliths, and porous layers. Commercially available capillary columns reduce fabrication time and improve reproducibility, but are not offered in every length, i.d., or stationary phase. As a result, in-house packing of columns is often undertaken. This is often accomplished by preparing a slurry of the desired stationary phase and loading it into a gas or liquid pressurized device to induce flow into the capillary until the stationary phase is the desired length shown similar to the depiction seen in Figure 3B.36 Capillary columns packed under sonicated slurry conditions show improvements in homogeneity with reduced gap volumes ultimately improving performance with reduced plate height.37
Monolith columns offer higher mass permeability making them most suitable for certain protein separation and analysis that is not amenable to nLC due to macromolecule interactions (such as in-tact proteins) that can block stationary phase.38 Monoliths can be functionalized for high selectivity with mixed-mode, affinity based, reverse phase, and exchange-based chromatography. Commercially available monolith columns come in a wide range of sizes from 20 μm to 8 mm with the capillary-based monolith columns achieving a maximum peak capacity of 680 with a 2-hour runtime.39 Monoliths have not been widely adopted into industrial use, but have found success in academic research where low back pressure and modifications to the stationary phase are advantageous. Monoliths have shown useful in separation of in-tact proteins, glycans40, peptides41-43, and neurotransmitter44. In addition to separations, monoliths have been used for antibiotic analysis45, peptide enrichment46, 47, solid phase extractions48, and manifolds for bioreactors49.
Porous layer open tubular (PLOT) columns maintain an open void throughout the center of the capillary with stationary phase only coating the inner diameter. The stationary phase coated inside the capillary can be a photo-initiated porous polymer, thermally initiated porous polymer, or porous silica. These columns are ideal for lower pressure systems and reduced solvent consumptions proving useful in protein analysis50. PLOT columns can achieve high efficiency and peak capacity by increasing length, but subsequently increase analysis and pressure requirements. Recent use with PLOT columns has found success with solid-phase-extractions48, 51 and picoflow liquid chromatography using trimethoxy(octadecyl) silane modification for protein analysis.52
Ultra-High Pressure Technology and Commercialization
Ultra-high-pressure liquid chromatography (UHPLC) is an established technology that uses small diameter particles (<2 mm) and high pressure (400–1300 bar) for improved separation or faster analysis time. The higher pressures enable researchers to use smaller particles and column diameters improving the A and C terms (eddy diffusion and mass transfer) of the van Deemter equation. The smaller i.d. columns showed greater packing homogeneity and resulted in higher performing columns supported by confocal laser microscopy studies. An in-depth explanation of UHPLC theory has been detailed by Jorgenson53 and Moore.54
Since the commercialization of nanoUHPLC technology, many different systems now exist for research and industry shown in Table 1. UHPLC has been adopted in industries where the need for improved analysis time is critical to improving workflow and optimizing efficiency. (e.g. food, environmental, clinical, pharmaceutical). The use of capillary UHPLC has improved upon this technique as commercially available capillary UHPLC columns are available from many major column manufacturers providing increased efficiency and in most cases sensitivity.54 This improved efficiency comes from increased heat dissipation with smaller dimensions. Heat is generated by pumping solvent through a column building both radial and axial gradients where temperature increases from inlet to outlet and decreases from the center of the column to the outer diameter. Non-uniform heating is problematic as the center of the column will experience both faster flow and decreased retention compared to the outer diameter.
Table 1.
List of current vendors and commercially available nLC systems with pressure limits above 400 bar. This list does not include previous models or non-advertised models that are available through special ordering.
| Vendor | Product name | Flow Rates | Pressure Limit |
|---|---|---|---|
| Waters | Acquity M-Class | 200 nL/min-100 μL/min | 1030 bar |
| Waters | nanoACQUITY UPLC | 200 nL/min-100 μL/min | 690 bar |
| SCIEX | nanoLC 400 Series (can be combined with cHiPLC® System) | 100 nL/min-1000 nL/min | 690 bar |
| Bruker | nanoElute® | 50 nL/min-2000 nL/min | 1000 bar |
| ThermoFisher | UltiMate™ NCS- 3500RS Binary Rapid Separation Nano/Capillary Pumps | 50 nL/min-50 μL/min | 860 bar |
| ThermoFisher | EASY-nLC™ 1200 System | 100 nL/min-1000 nL/min | 1200 bar |
| Eldex | μPro™ Pumping System | 10 nL/min-2 mL/min | 690 bar |
Special considerations for high-pressure systems need to be made with respect to fittings, column configuration, and injection methods. The current standard HPLC fittings are often not manufactured to withstand up to the 1000bar associated with cutting edge UHPLC systems. This has led to the development of multiple fittings and tubing combinations some of which are even finger-tight compatible making connections easy and convenient. This pressure requirement also dictates what type of outlet frits can be used on capillary columns limiting the options to sintered silica. Sample injection is complicated at higher pressures requiring in-house designed set-ups55 or more commonly sample trapping for loading onto a column.
The development of high-pressure flow systems also made the use of meter or longer columns possible. Similar to standard capillary columns, the suitability of non-porous, porous, and superficially porous particles for capillary UHPLC has been investigated along with non-traditional stationary phases such as: monoliths, open-tubular liquid chromatography, and nano-diamond decorated spheres. Capillary UHPLC is not only used for fast separations, but also long gradients where the separation efficiency is being optimized often seen in proteomic analysis where samples are complex with limited volumes. Innovative work improving proteome identification has been achieved using MudPIT and GELFreEE illustrating both bottom-up (peptide analysis of enzymatically cleaved proteins) and top-down (analysis of in-tact proteins) investigation suitability. Recently, capillary UHPLC has been used for wastewater drug analysis, zebrafrish drug uptake, lipid separation, and glycopeptide analysis demonstrating the variety of applications for this technique.
Interfacing with Mass Spectrometry
The most common form of interfacing capillary LC with mass spectrometry is through ESI.18 This is commonly achieved by applying the electrospray voltage to the back of the capillary column via metal union or cross if using split flow. The ESI is improved when the column has a tapered tip providing a reduction in the droplet size and improved ionization efficiency.9, 56 Columns can also be connected to an emitter tip, which is a specifically fabricated piece of small i.d. capillary that provides an often-narrower taper (starting i.d. 10 μm) than the column itself. The use of an emitter tip requires a near-zero dead volume connection between the column and the tip to prevent band broadening. Fabricating an emitter tip within a column is also done. This method requires the silica capillary to be heated, physically pulled to a narrow peak, and etched with HF to produce micrometer57 to nanometer58, 59 wide tips depending on the pulling parameters shown in Figure 5. This method is also used to taper the capillary for packing stationary phase with or without the use of a frit.59
Figure 5.
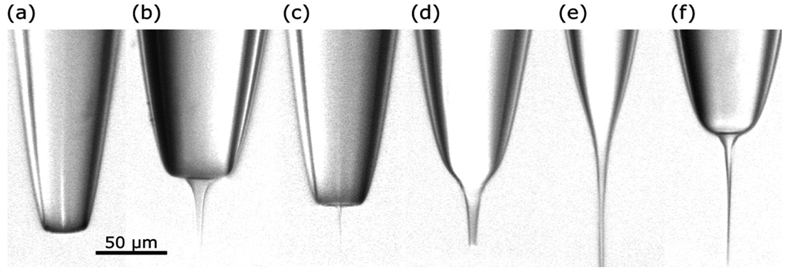
Examples of different shapes of needles obtained by pulling a 170/100 μm (OD/ID) fused silica capillary. The needles were generated using (a) low plasma intensity and high pulling speed; (b) low plasma intensity and medium pulling speed; (c) medium plasma intensity and high pulling speed; (d) medium plasma intensity and medium pulling speed; (e) high plasma intensity and medium pulling speed; (f) high plasma intensity and high pulling speed. Reprinted with permission from: P. Ek and J. Roeraade, Analytical Chemistry, 2011, 83, 7771-7777.
A major hurdle in more widespread capillary LC adoption is the dedication of resources to the column production process. The commercial production of fabricated emitter tips and both unpacked and packed columns from companies such as New Objective have helped to eliminate the need for researchers to become experts in column fabrication while still providing column customization and quality electrospray. These commercial columns reduce column to column variability and combined with improved zero-dead-volume connections produce a robust separation system.
Positioning of the emitter tip or capillary column is critical for optimum electrospray efficiency. Many mass spectrometry manufacturers offer nanospray-ESI sources that make positioning the column or emitter tip in the x, y, and z-axis easier and more reproducible. These interfaces take advantage of the existing voltage application on the MS instead of requiring an external power source providing more hands-free control of the system. In addition to these commercially fabricated columns, interfaces have also been developed by embedding the column to form a compact nLC chip such as the Waters ionKey and New Objective PicoChip.60-68 These ESI-chip embedded columns come in a variety of stationary phases and can be equipped with enrichment columns to increase separation capabilities. These interfaces reduce the need for hands-on positioning, but lack universal transferability between instrument manufacturers limiting widespread adaption.
Applications
Capillary LC-MS is ideal for biological applications where small injection volumes are needed due to sample limitations and have shown useful in -omics investigations (metabolomics, lipidomics, proteomics, and glycomics). These investigations have benefits in both untargeted and targeted analysis using capillary LC-MS as lower detection limits help identify subtle disease state changes and the discovery of distinct features.
Metabolomics
Metabolomics is often referred to as the snapshot of cellular activity, where small molecule analysis gives insight into cell function or disease state. Metabolites are a diverse group of molecules varying greatly in size and functionality increasing the difficulty related to complete profiling compared to proteomics or genomics.69 The C18 capillary column is still the most used column chemistry for capillary metabolomic analysis despite the growing variety of capillary column availability. The use of nLC in metabolomics has focused on elucidating biological changes in small volume samples ranging from sex related metabolites from drug70 and wastewater71 exposure in different invertebrates; untargeted and targeted metabolism from cell lysates72-75, single cell analysis76, human feces77 and plasma73; xenobiotic metabolites in mouse hepatic microsomes78 and biofluids79, amines in mouse urine80, polyphenols in yeast81, and endocannabinoids in cerebrospinal fluid82. This large-scale identification has led to the development of different software tools and databases for the analysis of metabolomic data such as Metandem83, XCMSOnline84, and MetaboAnalyst85. Method transferability and reproducibility has also been a focus showing that even with highly reproducible nLC-MS methods there is large variability in the sample analysis when different platforms are used.73
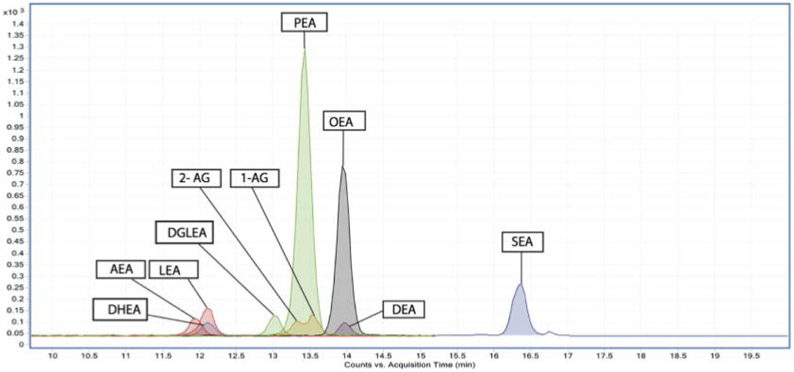
The advantage of increased sensitivity from the nLC-MS nano-ESI is illustrated in the analysis of endocannabinoids and N-acylethanolamines (NAEs) in cerebrospinal fluid (CSF) seen in Figure 6.82 The role of endocannabinoids and NAEs in regulating central nervous system communication was studied in relation to age, sex, and neurological disorders. Investigating these metabolic species poses a challenge as they are present in CSF at nano to femtomolar concentrations. In addition to having low analyte concentrations, samples of CSF from patients are limited in volume and availability. The use of the commercially available Agilent Polaris-HR-Chip 3C18 enabled the enrichment, separation, and ionization of the sample leading to the quantitation of endocannabinoids and NAEs and identified an additional eight putative NAEs that had not been detected under conventional LC-MS analysis. The benefits of using nLC-MS with nano-ESI produced reproducible and sensitive (LODs within pM and fM range) analysis of a reduced sample volume (200μL) leading to the identification of increased levels of N-docosahexaenoylethanolamid (DHEA) in human males as age increased. The increased sensitivity and detection limits indicate this method is suitable for the investigation of these metabolites under different brain affecting disorders.
Figure 6.
Chromatograms of endocannabinoids and N-acylethanolamine MS/MS fragmentations overlaid on each other from a representative standard mix. Reprinted with permission from: V. Kantae, S. Ogino, M. Noga, A. C. Harms, R. M. van Dongen, G. L. J. Onderwater, A. M. J. M. van den Maagdenberg, G. M. Terwindt, M. van der Stelt, M. D. Ferrari and T. Hankemeier, Journal of Lipid Research, 2017, 58, 615-624.
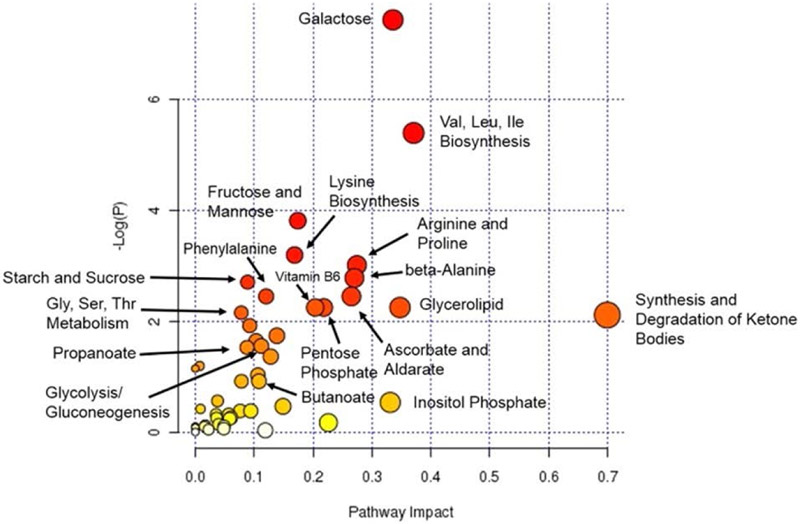
The increased sensitivity and reduced sample requirements are well suited for multi-analysis of the same sample as well. The investigation of diabetic complications from mouse aorta extractions was achieved revealing modifications in vitamin B6, propanoate, and butanoate in the aorta of diabetic mice compared to control mice.86 The analysis was performed by splitting each aorta extraction sample into three different analyses. The analyses were split to provide increased metabolic coverage using untargeted unlabeled analysis as well as isotopic labels for amine (DiART87-90) and carbonyl (CILAT91, 92) analysis. All three sample regimes were separated using the same nLC column by simply changing separation conditions. Pathway analysis of these results is shown in Figure 7. The use of nLC-MS in this study illustrates the sensitivity with reduced sample concentration and analysis versatility. Understanding the role of diabetic complications in mice is a starting point to applying these methods into human analysis and expanding the understanding of disease and potential therapeutics.
Figure 7.
MetPA analysis pathways. Node size and color indicate the degree of importance. Large red nodes are pathways with the highest level of change in diabetes. Orange, yellow, and white nodes represent moderate, slight, and zero importance, respectively. Reprinted with permission from: L. A. Filla, W. Yuan, E. L. Feldman, S. Li and J. L. Edwards, Journal of Proteome Research, 2014, 13, 6121-6134.
Lipidomics
Lipidomics aims to both identify and quantify the entire lipid profile in different biological systems to uncover functions and pathway identification. Lipids are classified based on structure including fatty acids, glycerolipids, glycerophospholipids, sphingolipids, sterol lipids, prenol lipids, saccarolipids, and polyketides. Lipid functional group variety requires a more universal detection approach such as MS or NMR. nLC-MS provides greater sensitivity and lower detection limits compared to the “shotgun-MS”93 approach which provides fast analysis time and quantitation but is unable to separate regional and geometrical isomers.94
nLC-MS for lipid analysis has been evaluated for different stationary phases95 but is often achieved using a C18 stationary phase to separate different classes of lipids with good coverage. The Moon group has also reported success in using a 2D-strong cation exchange (SAX)96 and C18 system for good class coverage. nLC-MS has been used to profile and investigate many different sample types including human plasma96, skeletal mouse muscle97, bovine brain and liver tissue98, mouse liver99, 100, lung99, 101, and kidney99 samples, mouse brain100, 102-105, rat brain106, rat liver107, cancer cells108, 109, yeast cells110, mussels111, 112, and human urine.113 These analyses indicate that generating lipid profiles is an important step in understanding the changes induced under diseased states.
The development of nLC has been instrumental in the profiling of lipidomics. Recent advancements using both a nLC extraction system and analytical column separation showed that conventional drying of human urine samples resulted in higher levels of oxidized phospholipids.113 The small dimensions of nLC enabled fast extraction and analysis times reducing the number of oxidized phospholipids by more than 30%. The validity of -omics profiling relies on improving the integrity of sample analysis and this method’s improvement in reduced sample modification and low sample need shows high potential for other biological sample analysis.
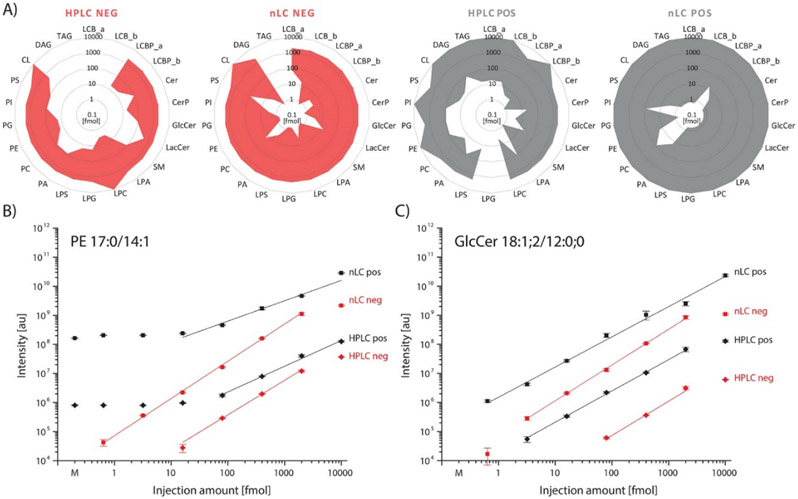
The global profiling of an organisms lipidome should aid in identifying modifications or perturbations. The wide variety of lipid structures and concentrations is a major challenge in one-method lipid profiling. NLC-MS was analytically compared to standard LC-MS conditions for global profiling of the yeast lipidome.110 Figure 8 illustrates the results of this investigation where increased coverage and limits of detection were found using nLC methods in both positive and negative mode compared to traditional HPLC (A). Smaller injection volumes (B) and (C) could also be used operating under nLC conditions without loss of linearity. The results showed an increase in sensitivity and coverage using nLC-MS methods as the linear dynamic range increased by “1 to 2 orders of magnitude” and the number of identified molecular lipid species increased by over 100% illustrating that the benefits of nLC-MS are not just theoretical.
Figure 8.
(A) The sensitivity and the linear dynamic range of the nLC-MS method were benchmarked against a corresponding narrow-bore HPLC method in both positive- and negative-ionization mode for different lipid standards that were supplemented to a yeast lipid extract. The dynamic ranges of the respective classes were extrapolated using following standards: LCB_a from LCB 17:1;2 LCB_b from LCB 17:0;2, LCBP_a from LCBP 17:0;2; LCBP _b from LCBP 17:1;2; Cer and CerP from 18:1;2/12:0;0; LPS, LPG and LPA from their 17:1 species, LPC from LPC 13:0; PA, PC, PE, PG, PI and PS from their 17:0/14:1 species; CL from CL 15:0(3)/16:1; DAG from DAG 17:0/17:0 d5; TAG from TAG 17:0–17:1–17:0 d5. (B) and (C) Show the MS response (peak area) of the standards GlcCer 18:1;2/12:0;0 and PE 17:0/14:1 in dependency of the injection amount. Reprinted with permission from N. Danne-Rasche, C. Coman and R. Ahrends, Analytical Chemistry, 2018, 90, 8093-8101.
Proteomics
Proteomics, the global study of proteins, aims to identify and quantify protein expression from different samples. Identifying differential levels of protein expression can lead to a better understanding of diseased states and give researchers valuable insights to develop treatments. Proteomics analysis via nLC is often used and has shown the most recent variety in column chemistry and separation.114 The use of trap columns is more prevalent with proteomics as they aid in sample focusing and desalting. In addition, the types of column chemistries include commercially available C18 columns, in-house developed zwitterionic monoliths44, and new larger pore stationary phases. In addition to improving methods for denatured or digested protein analysis, nLC has also been used for intact protein analysis115-117, ribosomal DNA sequencing118, E. Coli investigations119, exomere function120, single cell analysis121-123, oxytocin in human and rat plasmas124, and single cell analyses125-130. Proteomic analysis is being used to study a wide variety of diseased states131-134 including juvenile enthesitis-related arthritis (ERA)118, brain cancer135, and Alzheimer’s disease.136
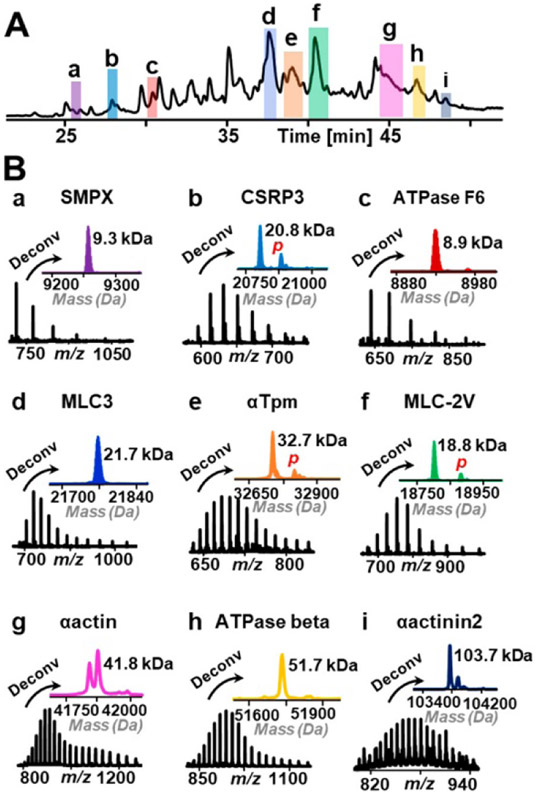
The development of unique high-permeability hybrid monoliths shows promise for top-down proteomics as seen in Figure 9.116 The monolith column was able to successfully separate and identify proteins from swine heart tissue. In-addition to the new column and separation method, a novel proteoform αactin2 was detected. This work shows promising results for extrapolating these low backpressure columns with high reproducibility protein separation for complex biological samples.
Figure 9.
(A) TIC of proteins extracted from swine heart tissue separated by C8@BTSEY column. (B) Top-down mass spectra and deconvoluted mass spectra of selected proteins with different masses. Italic “p” in red refers to phosphorylation. In panel g, the two peaks in the deconvoluted mass spectrum of αactin are two different isoforms, α-cardiac actin (41 813.82 Da) and α-skeletal actin (41 845.77 Da). Reprinted with permission from: Y. Liang, Y. Jin, Z. Wu, T. Tucholski, K. A. Brown, L. Zhang, Y. Zhang and Y. Ge, Analytical Chemistry, 2019, 91, 1743-1747.
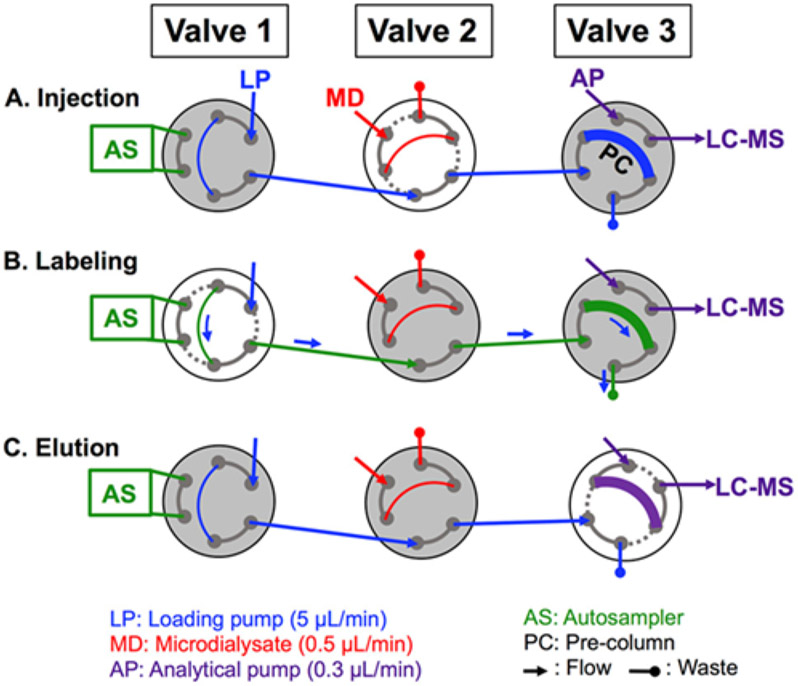
Neuropeptide analysis requires high sensitivity due to their low concentrations in microdialysate. The sensitivity of these species is improved with methylation and separation using capillary columns. A unique method involving the loading of neuropeptides followed by a sequential introduction of labeling reagents results to analyze the neuropeptides met-enkephaline and leu-enkephalin with isotopically labeled internal standards for quantitation has been developed.137 The method shown in Figure 10 illustrates a three-valve set-up where sample is loaded and methylated onto a pre-column followed by analytical separation. This method was successfully used to quantify the selected neuropeptides under stimulated and basal hippocampus conditions of the rat hippocampus showing the potential to be used in more extended or disease relevant investigations.
Figure 10.
Schematic for two-column labeling setup. Valve 1 is housed on the autosampler, Valve 2 is housed in the LC column oven, and Valve 3 is an external valve housed on the MS stage. Valve 2 is a 10-port valve but is depicted with 6-ports for clarity. White indicates a valve that is switching. Labeling is performed in the following way: (A) A 5 μL sample loop on Valve 2 is filled with microdialysate (MD), and upon switching, the sample is directed onto the precolumn (PC) by the loading pump (LP). (B) A series of five autosampler (AS) injections delivers reagents from vials (In sequential order: light labeling reagent, formic acid, 100 pM peptide aqueous standards, heavy labeling reagent, and formic acid) onto the PC, which react with peptides that have adsorbed onto the PC. (C) Valve 3 switches, directing flow from the analytical pump (AP) through the PC and eluting peptides off the PC and onto the analytical column-mass spectrometer (LC-MS) by gradient elution. Reprinted with permission from R. E. Wilson, A. Jaquins-Gerstl and S. G. Weber, Analytical Chemistry, 2018, 90, 4561-4568.
Glycomics
Glycomics is an area of study investigating free, bound, or modified sugars and the role they play in biological systems.138, 139 The most common form of glycomics looks at more complex oligosaccharides known as glycans. Glycans are known to play an important role in protein modification through a process known as glycosylation often leading to overlap between glycomics and proteomics.140 Evaluating the glycan profile in a diseased or dysfunctional state can be used to characterize diseased states making them useful biomarkers. Glycans and other sugars cannot be easily separated from isomers, and so enantiomeric and specific stationary phases such as porous graphitized carbon141, 142 are sometimes used to separate and analyze them. Recently post-column make-up flow with ion promoting solvent (organic solvent) has been shown to enhance the sensitivity of smaller glycans that elute under lower percentages of organic solvent.143, 144 The reduced volume of capillary columns is ideal for separations requiring expensive stationary phase or solvents.
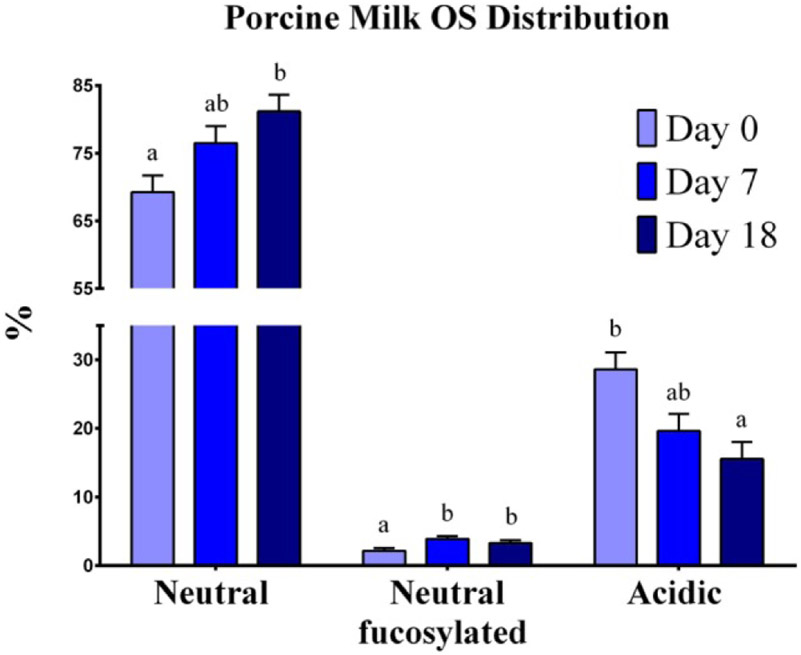
The profiling of sugars in milk145 and the role they play in different stages of offspring development is of interest related to investigations of growth and nutrition. The oligosaccharide profile of porcine milk over lactation stage was investigated and showed unique profiles that are believed to have developmental importance shown in Figure 11.146 The identification and separation of these sugars was achieved using a nLC Chip with an enrichment and analytical column. The specific nLC Chip was packed with porous-graphitized carbon that has been shown to aid in the separation of isomers. The porcine milk profile was compared to both human and cow milk profiles showing closer similarity to humans indicating the porcine model is ideal for nutritional studies.
Figure 11.
Oligosaccharide distribution in porcine milk. Results are expressed as the average of the relative abundance (%) of OS found in porcine milk from seven sows throughout the lactation period. Neutral, neutral-fucosylated, and acidic OS distributions exhibited changes by day (P < 0.05) throughout lactation. a,b Indicate statistical differences among time of milk collection during the lactation period, where means that do not share a common superscript letter differ (P < 0.05, HSD-Tukey Test). Reprinted with permission from A. T. Mudd, J. Salcedo, L. S. Alexander, S. K. Johnson, C. M. Getty, M. Chichlowski, B. M. Berg, D. Barile and R. N. Dilger, Frontiers in Nutrition, 2016, 3.
Conclusions
Multi-omic investigations aim to investigate various biomolecules from the same diseased state. These studies provide insight on how the different biological systems of an organism are being affected without losing the sensitivity that comes from single -omic analysis. The increased sensitivity and low sample volume requirements of capillary systems are ideal for multi-omic analysis as less sample is required for each analysis. Different sample preparations can also be analyzed on the same column by modifying gradient conditions such as a C18 providing metabolomic, lipidomic, and glycomic coverage. Multi-omic analysis is likely to elucidate in full diseased state profiling leading researchers and clinicians to better understandings and treatments. As more robust and commercially available systems are developed the implementation of nLC-MS methods should lead to increased characterization and more in depth understanding of biological and environmental conditions.
Acknowledgements
This work is supported by the National Institutes of Health (USA): 1R01GM134081 (JLE).
Footnotes
Conflicts of interest
There are no conflicts of interest to declare.
Notes and references
- 1.Chen Z, Gao Y and Zhong D, Biomedical Chromatography, 2020, 34, e4798. [DOI] [PubMed] [Google Scholar]
- 2.Hopfgartner G, Bean K, Henion J and Henry R, Journal of Chromatography A, 1993, 647, 51–61. [Google Scholar]
- 3.Gritti F and Guiochon G, Journal of Chromatography A, 2013, 1302, 1–13. [DOI] [PubMed] [Google Scholar]
- 4.Jerkovich AD, Mellors S and Jorgenson JW, LC-GC North America, 2003, 21, 600, 604, 608, 610. [Google Scholar]
- 5.Majors RE, LCGC North America, 2006, 24. [Google Scholar]
- 6.U. D. N. Mazzeo Jeffrey R., Kele Marianna, and Plumb Robert S., Analytical Chemistry, 2005, 77, 460 A–467 A. [Google Scholar]
- 7.Gritti F and Guiochon G, Journal of Chromatography A, 2014, 1333, 60–69. [DOI] [PubMed] [Google Scholar]
- 8.Kennedy RT and Jorgenson JW, Analytical Chemistry, 1989, 61, 1128–1135. [DOI] [PubMed] [Google Scholar]
- 9.Schmidt A, Karas M and Dülcks T, Journal of the American Society for Mass Spectrometry, 2003, 14, 492–500. [DOI] [PubMed] [Google Scholar]
- 10.Saz JM and Marina ML, Journal of Separation Science, 2008, 31, 446–458. [DOI] [PubMed] [Google Scholar]
- 11.Wilm M and Mann M, Analytical Chemistry, 1996, 68, 1–8. [DOI] [PubMed] [Google Scholar]
- 12.Steyer DJ and Kennedy RT, Analytical Chemistry, 2019, 91, 6645–6651. [DOI] [PMC free article] [PubMed] [Google Scholar]
- 13.Nguyen GTH, Tran TN, Podgorski MN, Bell SG, Supuran CT and Donald WA, ACS Central Science, 2019, 5, 308–318. [DOI] [PMC free article] [PubMed] [Google Scholar]
- 14.Yuill EM, Sa N, Ray SJ, Hieftje GM and Baker LA, Analytical Chemistry, 2013, 85, 8498–8502. [DOI] [PubMed] [Google Scholar]
- 15.Yuill EM and Baker LA, Analytical and Bioanalytical Chemistry, 2018, 410, 3639–3648. [DOI] [PubMed] [Google Scholar]
- 16.Kenderdine T, Xia Z, Williams ER and Fabris D, Analytical Chemistry, 2018, 90, 13541–13548. [DOI] [PMC free article] [PubMed] [Google Scholar]
- 17.Banerjee S and Mazumdar S, Int J Anal Chem, 2012, 2012, 282574–282574. [DOI] [PMC free article] [PubMed] [Google Scholar]
- 18.Gibson GTT, Mugo SM and Oleschuk RD, Mass Spectrometry Reviews, 2009, 28, 918–936. [DOI] [PubMed] [Google Scholar]
- 19.Juraschek R, Dülcks T and Karas M, Journal of the American Society for Mass Spectrometry, 1999, 10, 300–308. [DOI] [PubMed] [Google Scholar]
- 20.Berry V and Lawson K, Journal of Liquid Chromatography, 1987, 10, 3257–3278. [Google Scholar]
- 21.Jorgenson JW and Guthrie EJ, Journal of Chromatography A, 1983, 255, 335–348. [Google Scholar]
- 22.Berry V and Lawson K, Journal of High Resolution Chromatography, 1988, 11, 121–123. [Google Scholar]
- 23.Lubin A, Sheng S, Cabooter D, Augustijns P and Cuyckens F, Journal of Chromatography A, 2017, 1524, 101–107. [DOI] [PubMed] [Google Scholar]
- 24.Cheong WJ, Journal of Separation Science, 2014, 37, 603–617. [DOI] [PubMed] [Google Scholar]
- 25.D’Orazio G and Fanali S, Journal of Chromatography A, 2012, 1232, 176–182. [DOI] [PubMed] [Google Scholar]
- 26.Hong SH and Cheong WJ, Journal of Separation Science, 2016, 39, 243–246. [DOI] [PubMed] [Google Scholar]
- 27.Colón LA, Maloney TD and Fermier AM, Journal of Chromatography A, 2000, 887, 43–53. [DOI] [PubMed] [Google Scholar]
- 28.Saevels J, Wuyts M, Van Schepdael A, Roets E and Hoogmartens J, Journal of Pharmaceutical and Biomedical Analysis, 1999, 20, 513–520. [DOI] [PubMed] [Google Scholar]
- 29.Qi M, Li X-F, Stathakis C and Dovichi NJ, Journal of Chromatography A, 1999, 853, 131–140. [DOI] [PubMed] [Google Scholar]
- 30.Oguri S, Oga C and Takeda H, Journal of Chromatography A, 2007, 1157, 304–308. [DOI] [PubMed] [Google Scholar]
- 31.Wang H, Cao J, Bi Y, Chen L and Wan Q-H, Journal of Chromatography A, 2009, 1216, 5882–5887. [DOI] [PubMed] [Google Scholar]
- 32.Zhang B, Liu Q, Yang L and Wang Q, Journal of Chromatography A, 2013, 1272, 136–140. [DOI] [PubMed] [Google Scholar]
- 33.Zhang B, Bergström ET, Goodall DM and Myers P, Analytical Chemistry, 2007, 79, 9229–9233. [DOI] [PubMed] [Google Scholar]
- 34.Parkin MC, Longmoore AM, Turfus SC, Braithwaite RA, Cowan DA, Elliott S and Kicman AT, Journal of Chromatography A, 2013, 1277, 1–6. [DOI] [PubMed] [Google Scholar]
- 35.Ma S, Wang Y, Zhang N, Lyu J, Ma C, Xu J, Li X, Ou J and Ye M, Analytical Chemistry, 2020, 92, 2274–2282. [DOI] [PubMed] [Google Scholar]
- 36.Wahab MF, Patel DC, Wimalasinghe RM and Armstrong DW, Analytical Chemistry, 2017, 89, 8177–8191. [DOI] [PubMed] [Google Scholar]
- 37.Godinho JM, Reising AE, Tallarek U and Jorgenson JW, Journal of Chromatography A, 2016, 1462, 165–169. [DOI] [PMC free article] [PubMed] [Google Scholar]
- 38.Lynch KB, Ren J, Beckner MA, He C and Liu S, Analytica Chimica Acta, 2019, 1046, 48–68. [DOI] [PubMed] [Google Scholar]
- 39.Eeltink S, Wouters B, Desmet G, Ursem M, Blinco D, Kemp GD and Treumann A, Journal of Chromatography A, 2011, 1218, 5504–5511. [DOI] [PubMed] [Google Scholar]
- 40.Luo Q, Rejtar T, Wu S-L and Karger BL, Journal of Chromatography A, 2009, 1216, 1223–1231. [DOI] [PMC free article] [PubMed] [Google Scholar]
- 41.Jin D-Q, Zhu Y and Fang Q, Rapid Communications in Mass Spectrometry, 2016, 30, 62–67. [DOI] [PubMed] [Google Scholar]
- 42.Horie K, Kamakura T, Ikegami T, Wakabayashi M, Kato T, Tanaka N and Ishihama Y, Analytical Chemistry, 2014, 86, 3817–3824. [DOI] [PubMed] [Google Scholar]
- 43.Ivanov AR, Zang L and Karger BL, Analytical Chemistry, 2003, 75, 5306–5316. [DOI] [PubMed] [Google Scholar]
- 44.Li F, Qiu D, He J and Kang J, Chromatographia, 2019, DOI: 10.1007/s10337-019-03823-9. [DOI] [Google Scholar]
- 45.Liu H-Y, Lin S-L and Fuh M-R, Talanta, 2016, 150, 233–239. [DOI] [PubMed] [Google Scholar]
- 46.Yao Y, Bian Y, Dong M, Wang Y, Lv J, Chen L, Wang H, Mao J, Dong J and Ye M, Journal of Proteome Research, 2018, 17, 243–251. [DOI] [PubMed] [Google Scholar]
- 47.Wohlgemuth J, Karas M, Jiang W, Hendriks R and Andrecht S, Journal of Separation Science, 2010, 33, 880–890. [DOI] [PubMed] [Google Scholar]
- 48.Jiang H-P, Chu J-M, Lan M-D, Liu P, Yang N, Zheng F, Yuan B-F and Feng Y-Q, Journal of Chromatography A, 2016, 1462, 90–99. [DOI] [PubMed] [Google Scholar]
- 49.Yin J, Xu T, Zhang N and Wang H, Analytical Chemistry, 2016, 88, 7730–7737. [DOI] [PubMed] [Google Scholar]
- 50.Luo Q, Yue G, Valaskovic GA, Gu Y, Wu S-L and Karger BL, Analytical Chemistry, 2007, 79, 6174–6181. [DOI] [PMC free article] [PubMed] [Google Scholar]
- 51.Collins DA, Nesterenko EP and Paull B, Analyst, 2014, 139, 1292–1302. [DOI] [PubMed] [Google Scholar]
- 52.Xiang P, Zhu Y, Yang Y, Zhao Z, Williams SM, Moore RJ, Kelly RT, Smith RD and Liu S, Analytical Chemistry, 2020, 92, 4711–4715. [DOI] [PMC free article] [PubMed] [Google Scholar]
- 53.Jorgenson JW, Annual Review of Analytical Chemistry, 2010, 3, 129–150. [DOI] [PubMed] [Google Scholar]
- 54.Blue LE, Franklin EG, Godinho JM, Grinias JP, Grinias KM, Lunn DB and Moore SM, Journal of Chromatography A, 2017, 1523, 17–39. [DOI] [PubMed] [Google Scholar]
- 55.Treadway JW, Wyndham KD and Jorgenson JW, Journal of Chromatography A, 2015, 1422, 345–349. [DOI] [PubMed] [Google Scholar]
- 56.Reschke BR and Timperman AT, Journal of The American Society for Mass Spectrometry, 2011, 22, 2115–2124. [DOI] [PubMed] [Google Scholar]
- 57.Valaskovic GA, Kelleher NL, Little DP, Aaserud DJ and McLafferty FW, Analytical Chemistry, 1995, 67, 3802–3805. [DOI] [PubMed] [Google Scholar]
- 58.Susa AC, Lippens JL, Xia Z, Loo JA, Campuzano IDG and Williams ER, Journal of the American Society for Mass Spectrometry, 2018, 29, 203–206. [DOI] [PMC free article] [PubMed] [Google Scholar]
- 59.Ek P and Roeraade J, Analytical Chemistry, 2011, 83, 7771–7777. [DOI] [PubMed] [Google Scholar]
- 60.Houbart V, Servais A-C, Charlier TD, Pawluski JL, Abts F and Fillet M, ELECTROPHORESIS, 2012, 33, 3370–3379. [DOI] [PubMed] [Google Scholar]
- 61.Yin H, Killeen K, Brennen R, Sobek D, Werlich M and van de Goor T, Analytical Chemistry, 2005, 77, 527–533. [DOI] [PubMed] [Google Scholar]
- 62.Houbart V, Cobraiville G, Lecomte F, Debrus B, Hubert P and Fillet M, Journal of Chromatography A, 2011, 1218, 9046–9054. [DOI] [PubMed] [Google Scholar]
- 63.Zhu KY, Leung KW, Ting AKL, Wong ZCF, Fu Q, Ng WYY, Choi RCY, Dong TTX, Wang T, Lau DTW and Tsim KWK, Forensic Science International, 2011, 208, 53–58. [DOI] [PubMed] [Google Scholar]
- 64.Bai H-Y, Lin S-L, Chan S-A and Fuh M-R, Analyst, 2010, 135, 2737–2742. [DOI] [PubMed] [Google Scholar]
- 65.Flamini R, De Rosso M, Smaniotto A, Panighel A, Vedova AD, Seraglia R and Traldi P, Rapid Communications in Mass Spectrometry, 2009, 23, 2891–2896. [DOI] [PubMed] [Google Scholar]
- 66.Staes A, Timmerman E, Van Damme J, Helsens K, Vandekerckhove J, Vollmer M and Gevaert K, Journal of Separation Science, 2007, 30, 1468–1476. [DOI] [PubMed] [Google Scholar]
- 67.Zhang Y, Li Y, Qiu F and Qiu Z, Journal of Chromatography B, 2010, 878, 3395–3401. [DOI] [PubMed] [Google Scholar]
- 68.Zhao C, Wu Z, Xue G, Wang J, Zhao Y, Xu Z, Lin D, Herbert G, Chang Y, Cai K and Xu G, Journal of Chromatography A, 2011, 1218, 3669–3674. [DOI] [PubMed] [Google Scholar]
- 69.Chetwynd AJ and David A, Talanta, 2018, 182, 380–390. [DOI] [PubMed] [Google Scholar]
- 70.Bonnefoy C, Fildier A, Buleté A, Bordes C, Garric J and Vulliet E, Talanta, 2019, 202, 221–229. [DOI] [PubMed] [Google Scholar]
- 71.Chemosphere, 2018, 196, 347–353. [DOI] [PubMed] [Google Scholar]
- 72.Filla LA, Sanders KL, Coulton JB, Filla RT and Edwards JL, Analytical and Bioanalytical Chemistry, 2019, 411, 6399–6407. [DOI] [PubMed] [Google Scholar]
- 73.Telu KH, Yan X, Wallace WE, Stein SE and Simón-Manso Y, Rapid Communications in Mass Spectrometry, 2016, 30, 581–593. [DOI] [PMC free article] [PubMed] [Google Scholar]
- 74.Luo X and Li L, Analytical Chemistry, 2017, 89, 11664–11671. [DOI] [PubMed] [Google Scholar]
- 75.Yuan W, Li S and Edwards JL, Analytical Chemistry, 2015, 87, 7660–7666. [DOI] [PubMed] [Google Scholar]
- 76.Nakatani K, Izumi Y, Hata K and Bamba T, Mass Spectrometry, 2020, 9, A0080–A0080. [DOI] [PMC free article] [PubMed] [Google Scholar]
- 77.Chetwynd AJ, Ogilvie LA, Nzakizwanayo J, Pazdirek F, Hoch J, Dedi C, Gilbert D, Abdul-Sada A, Jones BV and Hill EM, Journal of Chromatography A, 2019, 1600, 127–136. [DOI] [PubMed] [Google Scholar]
- 78.Wang X, Wang D, Wang Y, Zhang P, Zhou Z and Zhu W, Environmental Pollution, 2016, 212, 358–365. [DOI] [PubMed] [Google Scholar]
- 79.Chetwynd AJ, David A, Hill EM and Abdul-Sada A, Journal of Mass Spectrometry, 2014, 49, 1063–1069. [DOI] [PubMed] [Google Scholar]
- 80.Hao L, Zhong X, Greer T, Ye H and Li L, Analyst, 2015, 140, 467–475. [DOI] [PMC free article] [PubMed] [Google Scholar]
- 81.Gómez-Mejía E, Rosales-Conrado N, León-González ME and Madrid Y, Journal of Chromatography A, 2019, 1601, 255–265. [DOI] [PubMed] [Google Scholar]
- 82.Kantae V, Ogino S, Noga M, Harms AC, van Dongen RM, Onderwater GLJ, van den Maagdenberg AMJM, Terwindt GM, van der Stelt M, Ferrari MD and Hankemeier T, Journal of Lipid Research, 2017, 58, 615–624. [DOI] [PMC free article] [PubMed] [Google Scholar]
- 83.Hao L, Zhu Y, Wei P, Johnson J, Buchberger A, Frost D, Kao WJ and Li L, Analytica Chimica Acta, 2019, 1088, 99–106. [DOI] [PMC free article] [PubMed] [Google Scholar]
- 84.Gowda H, Ivanisevic J, Johnson CH, Kurczy ME, Benton HP, Rinehart D, Nguyen T, Ray J, Kuehl J, Arevalo B, Westenskow PD, Wang J, Arkin AP, Deutschbauer AM, Patti GJ and Siuzdak G, Analytical Chemistry, 2014, 86, 6931–6939. [DOI] [PMC free article] [PubMed] [Google Scholar]
- 85.Chong J, Wishart DS and Xia J, Current Protocols in Bioinformatics, 2019, 68, e86. [DOI] [PubMed] [Google Scholar]
- 86.Filla LA, Yuan W, Feldman EL, Li S and Edwards JL, Journal of Proteome Research, 2014, 13, 6121–6134. [DOI] [PMC free article] [PubMed] [Google Scholar]
- 87.Chen Z, Wang Q, Lin L, Tang Q, Edwards JL, Li S and Liu S, Analytical Chemistry, 2012, 84, 2908–2915. [DOI] [PubMed] [Google Scholar]
- 88.Zhang J, Wang Y and Li S, Analytical Chemistry, 2010, 82, 7588–7595. [DOI] [PubMed] [Google Scholar]
- 89.Yuan W, Zhang J§, Li S and Edwards JL, Journal of Proteome Research, 2011, 10, 5242–5250. [DOI] [PubMed] [Google Scholar]
- 90.Ramsubramaniam N, Tao F, Li S and Marten MR, Journal of Mass Spectrometry, 2013, 48, 1032–1041. [DOI] [PubMed] [Google Scholar]
- 91.Li S and Zeng D, Chemical Communications, 2007, DOI: 10.1039/B700109F, 2181–2183. [DOI] [PubMed] [Google Scholar]
- 92.Zeng D and Li S, Bioorganic & Medicinal Chemistry Letters, 2009, 19, 2059–2061. [DOI] [PubMed] [Google Scholar]
- 93.Hofmann T and Schmidt C, Chemistry and Physics of Lipids, 2019, 223, 104782. [DOI] [PubMed] [Google Scholar]
- 94.Sorensen MJ, Miller KE, Jorgenson JW and Kennedy RT, Journal of Chromatography A, 2019, DOI: 10.1016/j.chroma.2019.460575, 460575. [DOI] [PMC free article] [PubMed] [Google Scholar]
- 95.Gao X, Zhang Q, Meng D, Isaac G, Zhao R, Fillmore TL, Chu RK, Zhou J, Tang K, Hu Z, Moore RJ, Smith RD, Katze MG and Metz TO, Analytical and Bioanalytical Chemistry, 2012, 402, 2923–2933. [DOI] [PMC free article] [PubMed] [Google Scholar]
- 96.Bang DY and Moon MH, Journal of Chromatography A, 2013, 1310, 82–90. [DOI] [PubMed] [Google Scholar]
- 97.Park SM, Byeon SK, Lee H, Sung H, Kim IY, Seong JK and Moon MH, Scientific Reports, 2017, 7, 3302. [DOI] [PMC free article] [PubMed] [Google Scholar]
- 98.Bang DY, Kang D and Moon MH, Journal of Chromatography A, 2006, 1104, 222–229. [DOI] [PubMed] [Google Scholar]
- 99.Park SM, Byeon SK, Sung H, Cho SY, Seong JK and Moon MH, Journal of Proteome Research, 2016, 15, 3763–3772. [DOI] [PubMed] [Google Scholar]
- 100.Bang DY, Ahn E. j. and Moon MH, Journal of Chromatography B, 2007, 852, 268–277. [DOI] [PubMed] [Google Scholar]
- 101.Dautel SE, Kyle JE, Clair G, Sontag RL, Weitz KK, Shukla AK, Nguyen SN, Kim Y-M, Zink EM, Luders T, Frevert CW, Gharib SA, Laskin J, Carson JP, Metz TO, Corley RA and Ansong C, Scientific Reports, 2017, 7, 40555. [DOI] [PMC free article] [PubMed] [Google Scholar]
- 102.You M, Miao Z, Pan Y and Hu F, European Journal of Pharmacology, 2019, 865, 172736. [DOI] [PubMed] [Google Scholar]
- 103.Lee ST, Lee JC, Kim JW, Cho SY, Seong JK and Moon MH, Scientific Reports, 2016, 6, 36510. [DOI] [PMC free article] [PubMed] [Google Scholar]
- 104.Thomas D, Eberle M, Schiffmann S, Zhang DD, Geisslinger G and Ferreirós N, Talanta, 2013, 116, 912–918. [DOI] [PubMed] [Google Scholar]
- 105.Lee H, Lerno LA, Choe Y, Chu CS, Gillies LA, Grimm R, Lebrilla CB and German JB, Analytical Chemistry, 2012, 84, 5905–5912. [DOI] [PMC free article] [PubMed] [Google Scholar]
- 106.Ando A and Satomi Y, Analytical Sciences, 2018, 34, 177–182. [DOI] [PubMed] [Google Scholar]
- 107.Ahn EJ, Kim H, Chung BC and Moon MH, Journal of Separation Science, 2007, 30, 2598–2604. [DOI] [PubMed] [Google Scholar]
- 108.Roberg-Larsen H, Lund K, Vehus T, Solberg N, Vesterdal C, Misaghian D, Olsen PA, Krauss S, Wilson SR and Lundanes E, Journal of Lipid Research, 2014, 55, 1531–1536. [DOI] [PMC free article] [PubMed] [Google Scholar]
- 109.He H, Conrad CA, Nilsson CL, Ji Y, Schaub TM, Marshall AG and Emmett MR, Analytical Chemistry, 2007, 79, 8423–8430. [DOI] [PMC free article] [PubMed] [Google Scholar]
- 110.Danne-Rasche N, Coman C and Ahrends R, Analytical Chemistry, 2018, 90, 8093–8101. [DOI] [PubMed] [Google Scholar]
- 111.Albergamo A, Rigano F, Purcaro G, Mauceri A, Fasulo S and Mondello L, Science of The Total Environment, 2016, 571, 955–962. [DOI] [PubMed] [Google Scholar]
- 112.Rigano F, Albergamo A, Sciarrone D, Beccaria M, Purcaro G and Mondello L, Analytical Chemistry, 2016, 88, 4021–4028. [DOI] [PubMed] [Google Scholar]
- 113.Lee JY, Yang JS, Park SM, Byeon SK and Moon MH, Journal of Chromatography A, 2016, 1464, 12–20. [DOI] [PubMed] [Google Scholar]
- 114.Wilson SR, Vehus T, Berg HS and Lundanes E, Bioanalysis, 2015, 7, 1799–1815. [DOI] [PubMed] [Google Scholar]
- 115.Wu Z, Wei B, Zhang X and Wirth MJ, Analytical Chemistry, 2014, 86, 1592–1598. [DOI] [PMC free article] [PubMed] [Google Scholar]
- 116.Liang Y, Jin Y, Wu Z, Tucholski T, Brown KA, Zhang L, Zhang Y and Ge Y, Analytical Chemistry, 2019, 91, 1743–1747. [DOI] [PMC free article] [PubMed] [Google Scholar]
- 117.Dores-Sousa JL, Terryn H and Eeltink S, Analytica Chimica Acta, 2020, 1124, 176–183. [DOI] [PubMed] [Google Scholar]
- 118.Stoll ML, Kumar R, Lefkowitz EJ, Cron RQ, Morrow CD and Barnes S, Genes & Immunity, 2016, 17, 400–405. [DOI] [PMC free article] [PubMed] [Google Scholar]
- 119.Surmann K, Stopp M, Wörner S, Dhople VM, Völker U, Unden G and Hammer E, Journal of Proteomics, 2020, 212, 103583. [DOI] [PubMed] [Google Scholar]
- 120.Zhang Q, Higginbotham JN, Jeppesen DK, Yang Y-P, Li W, McKinley ET, Graves-Deal R, Ping J, Britain CM, Dorsett KA, Hartman CL, Ford DA, Allen RM, Vickers KC, Liu Q, Franklin JL, Bellis SL and Coffey RJ, Cell Reports, 2019, 27, 940–954.e946. [DOI] [PMC free article] [PubMed] [Google Scholar]
- 121.Li Z-Y, Huang M, Wang X-K, Zhu Y, Li J-S, Wong CCL and Fang Q, Analytical Chemistry, 2018, 90, 5430–5438. [DOI] [PubMed] [Google Scholar]
- 122.Shao X, Wang X, Guan S, Lin H, Yan G, Gao M, Deng C and Zhang X, Analytical Chemistry, 2018, 90, 14003–14010. [DOI] [PubMed] [Google Scholar]
- 123.Hata K, Izumi Y, Hara T, Matsumoto M and Bamba T, Analytical Chemistry, 2020, 92, 2997–3005. [DOI] [PubMed] [Google Scholar]
- 124.Liu D, Han X, Liu X, Cheng M, He M, Rainer G, Gao H and Zhang X, Journal of Pharmaceutical and Biomedical Analysis, 2019, 173, 62–67. [DOI] [PubMed] [Google Scholar]
- 125.Saha-Shah A, Esmaeili M, Sidoli S, Hwang H, Yang J, Klein PS and Garcia BA, Analytical chemistry, 2019, 91, 8891–8899. [DOI] [PMC free article] [PubMed] [Google Scholar]
- 126.Sun L, Dubiak KM, Peuchen EH, Zhang Z, Zhu G, Huber PW and Dovichi NJ, Analytical Chemistry, 2016, 88, 6653–6657. [DOI] [PMC free article] [PubMed] [Google Scholar]
- 127.Shao X, Weng L, Gao M and Zhang X, TrAC Trends in Analytical Chemistry, 2019, 120, 115666. [Google Scholar]
- 128.Murgia M, Toniolo L, Nagaraj N, Ciciliot S, Vindigni V, Schiaffino S, Reggiani C and Mann M, Cell Reports, 2017, 19, 2396–2409. [DOI] [PubMed] [Google Scholar]
- 129.Lombard-Banek C, Moody SA and Nemes P, Angewandte Chemie International Edition, 2016, DOI: 10.1002/anie.201510411, 2454. [DOI] [PMC free article] [PubMed] [Google Scholar]
- 130.Zhu Y, Clair G, Chrisler WB, Shen Y, Zhao R, Shukla AK, Moore RJ, Misra RS, Pryhuber GS, Smith RD, Ansong C and Kelly RT, Angewandte Chemie International Edition, 2018, 57, 12370–12374. [DOI] [PMC free article] [PubMed] [Google Scholar]
- 131.Lamont L, Baumert M, Ogrinc Potočnik N, Allen M, Vreeken R, Heeren RMA and Porta T, Analytical Chemistry, 2017, 89, 11143–11150. [DOI] [PMC free article] [PubMed] [Google Scholar]
- 132.Ma F, Tremmel DM, Li Z, Lietz CB, Sackett SD, Odorico JS and Li L, Journal of Proteome Research, 2019, 18, 3156–3165. [DOI] [PMC free article] [PubMed] [Google Scholar]
- 133.Sun F, Zhuo R, Ma W, Yang D, Su T, Ye L, Xu D and Wang W, Journal of Cellular Physiology, 2019, 234, 22057–22070. [DOI] [PubMed] [Google Scholar]
- 134.Liu L, Yang K, Zhu X, Liang Y, Chen Y, Fang F, Zhao Q, Zhang L and Zhang Y, Talanta, 2017, 175, 189–193. [DOI] [PubMed] [Google Scholar]
- 135.Nguyen CDL, Malchow S, Reich S, Steltgens S, Shuvaev KV, Loroch S, Lorenz C, Sickmann A, Knobbe-Thomsen CB, Tews B, Medenbach J and Ahrends R, Scientific Reports, 2019, 9, 8836. [DOI] [PMC free article] [PubMed] [Google Scholar]
- 136.Shah DJ, Rohlfing F, Anand S, Johnson WE, Alvarez MTB, Cobell J, King J, Young SA, Kauwe JSK and Graves SW, J Alzheimers Dis, 2016, 49, 317–327. [DOI] [PubMed] [Google Scholar]
- 137.Wilson RE, Jaquins-Gerstl A and Weber SG, Analytical Chemistry, 2018, 90, 4561–4568. [DOI] [PMC free article] [PubMed] [Google Scholar]
- 138.Şahar U and Deveci R, Molecular Reproduction and Development, 2017, 84, 401–407. [DOI] [PubMed] [Google Scholar]
- 139.Zou G, Benktander JD, Gizaw ST, Gaunitz S and Novotny MV, Analytical Chemistry, 2017, 89, 5364–5372. [DOI] [PMC free article] [PubMed] [Google Scholar]
- 140.Zhang Y, Peng Y, Yang L and Lu H, TrAC Trends in Analytical Chemistry, 2018, 99, 34–46. [Google Scholar]
- 141.Kolarich D, Windwarder M, Alagesan K and Altmann F, in Glyco-Engineering: Methods and Protocols, ed. Castilho A, Springer New York, New York, NY, 2015, DOI: 10.1007/978-1-4939-2760-9_29, pp. 427–435. [DOI] [PubMed] [Google Scholar]
- 142.Ashwood C, Lin C-H, Thaysen-Andersen M and Packer NH, Journal of the American Society for Mass Spectrometry, 2018, 29, 1194–1209. [DOI] [PubMed] [Google Scholar]
- 143.Hinneburg H, Chatterjee S, Schirmeister F, Nguyen-Khuong T, Packer NH, Rapp E and Thaysen-Andersen M, Analytical Chemistry, 2019, 91, 4559–4567. [DOI] [PubMed] [Google Scholar]
- 144.Nguyen-Khuong T, Pralow A, Reichl U and Rapp E, Glycoconjugate Journal, 2018, 35, 499–509. [DOI] [PubMed] [Google Scholar]
- 145.Schmid D, Behnke B, Metzger J and Kuhn R, Biomedical Chromatography, 2002, 16, 151–156. [DOI] [PubMed] [Google Scholar]
- 146.Mudd AT, Salcedo J, Alexander LS, Johnson SK, Getty CM, Chichlowski M, Berg BM, Barile D and Dilger RN, Frontiers in Nutrition, 2016, 3. [DOI] [PMC free article] [PubMed] [Google Scholar]


