Abstract
The osteochondral junction (OCJ) of the knee joint is comprised of multiple tissue components, including a portion of the deep layer cartilage, calcified cartilage, and subchondral bone. The OCJ is of increasing radiological interest as it may be relevant in the early pathogenesis of osteoarthritis (OA). Due to its short transverse relaxation, the OCJ is invisible to clinical MR sequences. The purpose of this study was to develop a fast 3D T1-weighted ultrashort echo time cones sequence with fat saturation (FS-UTE-Cones) for high resolution and high contrast imaging of the OCJ on a clinical 3T scanner. First, numerical simulations were performed to investigate how the flip angle affected the signal intensities and contrasts of both short and long T1 tissues. The results from these simulations demonstrated that higher short T1 contrast could be achieved with higher flip angle. Next, T1 relaxation was measured for the different layers of a human patellar cartilage sample, and the results showed that the deepest layer had a significantly shorter T1 value than other layers. Finally, a healthy knee joint was scanned with different flip angles and the OCJ was highlighted in the T1-weighted FS-UTE-Cones sequence using a flip angle greater than 20°. The clinical T2-weighted and proton density-weighted FSE sequences were also included for comparison, revealing a dark OCJ region. Representative T1-weighted FS-UTE-Cones images of the whole knee of a healthy volunteer showed high signal intensity bands in the OCJ regions of the patella, femur, and tibia. On the other hand, T1-weighted FS-UTE-Cones imaging of the knee joints of OA patients revealed regions with reduction or loss of these high signal intensity bands in the OCJ regions, indicating abnormal OCJ tissue composition. The proposed 3D T1-weighted FS-UTE-Cones sequence with a 3-minute scan time may be very useful for demonstrating the involvement of the OCJ regions in early OA.
Keywords: Osteochondral junction, T1-weighted, 3D ultrashort echo time
1. Introduction
Osteoarthritis (OA) is one of the major causes of global disability, affecting at least 30 million adults in the United States with an estimated annual cost of $5,700 per patient [1]. It is considered a whole joint disease with pathological changes in all components of the diarthrodial joint [2]. The region of the osteochondral junction (OCJ) is of increasing interest as it is believed to play an important role in the pathogenesis of OA [3–7]. In the knee, the OCJ comprises the deeper non-calcified cartilage, calcified cartilage, and subchondral bone plate, a region which lies between the deeper layers of articular cartilage and the underlying subchondral bone [3]. In normal joints, the articular cartilage is avascular; however, in OA joints, activated osteoclasts form channels through the subchondral bone, allowing vessels and nerves to extend into cartilage at its deeper layers [4,5,7]. This is associated with local inflammation, degradation of the extracellular matrix, and reduction of cartilage’s load-bearing capacity, which may all be relevant in the pathogenesis of OA [4–7].
MRI is a non-invasive tool which has been routinely used in the diagnosis of knee joint diseases in the clinical setting. However, tissues at the OCJ cannot be visualized with clinical MR sequences due to their short transverse relaxations [8–11]. Ultrashort echo time (UTE) sequences with echo times less than 100 μs have been used to overcome this limitation [12]. However, there are only a few UTE techniques being developed for OCJ imaging, mainly including UTE dual-echo subtraction method, and dual inversion recovery (DIR)- and single inversion recovery (IR)-prepared UTE techniques [10,13,14]. Dual-echo subtraction is a simple and easy to implement method, but it suffers from reduction in signal to noise ratio (SNR) of the short T2 tissues [10,15]. Moreover, the image contrast between short T2 and marrow fat in the subtracted image is relatively low due to high residual signals from fat because of its high proton density and short T2* (e.g., T2* between 5 and 15 ms at 3T) [16]. Furthermore, the short T2 signals may suffer chemical shift artifacts (i.e. expressed as ringing artifacts) induced by the off-resonance excitation of marrow fat in the non-Cartesian UTE imaging [13]. In the DIR-UTE sequence, two individual IR pulses with a narrow bandwidth (e.g., around 500 Hz) are centered on the fat and water resonance frequencies, respectively [13]. With proper selection of inversion times for these two IR pulses, high contrast calcified cartilage imaging can be achieved with simultaneous suppression of signals from the marrow fat and superficial layers of cartilage. However, this technique is sensitive to B0 inhomogeneity due to the narrow pulse bandwidth used for the spectral selection. The IR-UTE sequence combined with fat saturation (FatSat) (IR-FS-UTE) has been used to highlight the OCJ region in vivo, suppressing major signals from superficial cartilage and fat [14]. However, the scan time of the IR-FS-UTE sequence is relatively long (i.e., around 10 min) for coverage of the whole knee, which may limit its potential application in clinical practice.
In this study, we developed a fast 3D T1-weighted UTE-Cones sequence with fat saturation (FS-UTE-Cones) to highlight the OCJ tissue in the human knee joint on a clinical 3T MRI scanner. First, T1 values of the OCJ region as well as other layers of cartilage were measured in the patellar sample study. Shorter T1 value was found for the OCJ tissue compared with more superficial cartilage. Next, we took advantage of the OCJ tissue’s short T1 property and created high image contrast using the proposed T1-weighted FS-UTE-Cones sequence. There are two key components of this sequence: First, high T1 weighting was produced by utilizing a high excitation flip angle together with a short spoke interval; Second, a fat saturation module was employed to suppress the signal from marrow fat prior to data acquisition. Together, these elements allowed us to highlight the signals from OCJ tissue while effectively suppressing signals from the more superficial cartilage and marrow fat. Numerical simulation, an ex vivo sample study, and an in vivo knee joint study were then performed to validate the feasibility of high-contrast OCJ imaging with the proposed T1-weighted FS-UTE-Cones sequence.
2. Material and Methods
The 3D FS-UTE-Cones sequence combined a basic 3D UTE-Cones sequence with a product chemical shift fat saturation module (minimum-phase Shinnar-Le Roux design with pulse duration = 8 ms, bandwidth = 500 Hz and center frequency = −440 Hz) implemented on a 3T GE MR750 scanner (GE Healthcare Technologies, Milwaukee, WI) [17–19]. A series of spokes (Nsp) were acquired after each FatSat module (Figure 1A). The time interval between two adjacent spokes was defined as τ. For each spoke, a short rectangular pulse with duration of 100 μs was used for non-selective excitation (Figure 1B), followed by a 3D spiral trajectory data acquisition with conical view ordering (Figure 1C). The UTE-Cones data sampling began as soon as was practical after the RF excitation, with a minimal nominal delay time of 32 μs. The residual transverse magnetizations after data acquisition were crushed by both RF and gradient spoiling. The 3D regridding with a Kaiser-Bessel kernel was used for the on-line Cones reconstruction. No apparent reconstruction related artifacts were found in the knee.
Figure 1.
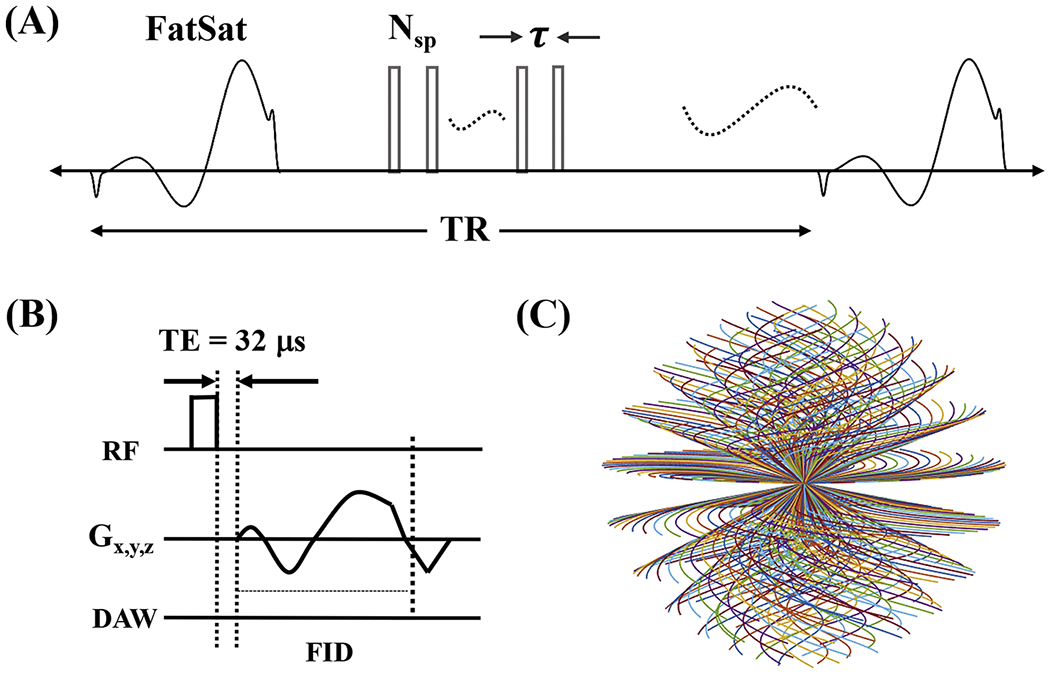
The 3D T1-weighted FS-UTE-Cones sequence. This sequence employs a FatSat module for fat suppression followed by multiple-spoke UTE-Cones data acquisition (A). A short rectangular pulse is used for signal excitation followed by 3D spiral sampling with a minimal nominal TE of 32 μs (B). The spiral trajectories are arranged with conical view ordering (C).
2.1. Numerical simulation
Four different T1 tissues (i.e., 500, 700, 800, and 900 ms) with an identical equilibrium state magnetization were simulated to investigate the degree of change in contrast with different flip angles. The UTE signal formulation used was the same as the conventional spoiled gradient echo recalled (SPGR) sequence. Other sequence parameters were as follows: TR = 6 ms, flip angle changes from 0° to 90°. The contrast between short and long T1 tissues was defined as the signal ratio between them. A higher image contrast between the two T1 tissues can be achieved when their signal ratio is higher.
2.2. Ex vivo cartilage sample study
A patellar sample was harvested from a normal cadaveric knee joint (a 36-year-old male donor). A transverse slab of ~10 mm thickness was cut and stored in phosphate buffered saline (PBS)-soaked gauze at 4°C prior to MR imaging. A wrist coil was used for signal reception to obtain high SNR images of this sample. To measure T1 values for the different layers of cartilage (i.e., superficial, middle, deep, and calcified layers), the cartilage sample was scanned with a 3D UTE-Cones actual flip angle imaging and variable flip angle (3D UTE-Cones AFI-VFA) sequence [20,21]: 1) UTE-Cones AFI: TR = 20/100ms; flip angle = 45°; 2) UTE-Cones VFA: TR = 20ms; flip angles = 4°, 7°, 10°, 15°, 20°, 25°, and 30°. Other sequence parameters were: field of view (FOV) = 7 × 7 × 6.4 cm3, acquisition matrix = 192 × 192 × 64, slice thickness = 1 mm, TE = 0.032 ms, receiver bandwidth = 100 kHz, maximum gradient amplitude = 43 mT/m, maximum gradient slew rate = 120 T/m/s and a total scan time of 45.5 min.
2.3. In vivo whole knee joint study
In vivo knee imaging was performed on five healthy volunteers (29-45 years of age, three males) and eight OA patients undergoing total knee replacement (46-64 years of age, six males). Informed consent was obtained from all subjects in accordance with guidelines of the institutional review board. An 8-ch transmit and receive knee coil was used for both RF excitation and signal reception. A healthy knee joint from a 37-year-old volunteer was scanned with the FS-UTE-Cones sequence using different flip angles (i.e., flip angle = 5°, 10°, 15°, 20°, 25°, and 30°) to investigate the contrast change of the OCJ tissues. Other sequence parameters were: FOV = 13 × 13 × 8.4 cm3, acquisition matrix = 256 × 256 × 42, slice thickness = 2 mm, TR/TE = 80/0.032 ms, receiver bandwidth = 166 kHz, Nsp = 5, τ = 6 ms, maximum gradient amplitude = 33 mT/m, maximum gradient slew rate = 120 T/m/s, and a scan time of 3 min. Fat suppression in FS-UTE-Cones sequence is more effective when the acquisition spokes are close to the FatSat pulse. However, in the meantime, the OCJ tissue signals suffer direct saturation induced by the FatSat pulse since the OCJ tissues have a broad linewidth in frequency domain. Stronger signal attenuation occurs within the spokes which are closer to the FatSat module. In this study, a Nsp of 5 was chosen to simultaneously achieve a reasonable fat suppression and avoid too much OCJ tissue signal attenuation. The clinical T2- and proton density (PD)-weighted fast spin echo (FSE) sequences were used for comparison with sequence parameters listed as follows: 1) T2-weighted FSE: TR/TE = 7585/71.5 ms, FOV = 13 × 13 cm2, acquisition matrix = 352 × 256, slice thickness = 2 mm, number of slices = 40, acceleration factor = 2, scan time = 2 min 32 sec; 2) PD-weighted FSE: TR/TE = 3220/27.8 ms, FOV = 13 × 13 cm2, acquisition matrix = 352 × 256, slice thickness = 2 mm, number of slices = 40, acceleration factor = 2, scan time = 2 min 30 sec.
Afterwards, all in vivo subjects, including healthy volunteers and OA patients, were scanned with the above T1-weighted FS-UTE-Cones sequence with a flip angle of 30° and compared with the clinical T2-weighted sequence.
2.4. Image analysis
T1 was measured using our previously reported methods [20,21]. To investigate the contrast of FS-UTE-Cones images with different excitation flip angles, the CNR between tissues of the OCJ region and the marrow fat (CNROCJ_MF) and superficial cartilage (CNROCJ_SC) were calculated as the respective signal differences divided by the background noise. The signal intensities of OCJ region and superficial cartilages were obtained by the signal averaging of OCJ regions and superficial cartilages in whole knee, respectively. The mean signal intensity of bone marrow fat in whole was utilized for CNR calculation. All the regions of OCJ, superficial cartilage, and marrow fat were manually drawn. The noise level was calculated as the standard deviation of the signal in region of interest (ROI) placed within an artifact-free background. In addition, the CNROCJ_SC and CNROCJ_MF of the abnormal OCJ regions in OA patients were also measured to compare with those values of the normal OCJ regions in healthy volunteers. ANOVA analysis was performed to test the CNROCJ_SC and CNROCJ_MF difference between these abnormal and normal OCJ regions. All the data processing algorithms were written in MATLAB.
3. Results
The simulation results are shown in Figure 2. Figure 2A shows the signal intensity curves of the four T1s, demonstrating that all the signal intensities increase then decrease with a higher flip angle. For all flip angles, tissue with a lower T1 always has a higher signal intensity than signal from tissue with a higher T1. Even though the Ernst angles of the signal intensity curves differ, their signal ratios increase with higher flip angles, as seen in Figure 2B, indicating that a higher T1 contrast can always be achieved with a higher flip angle. However, a higher flip angle doesn’t always mean improved image quality because of the SNR reduction associated with the use of a flip angle higher than the Ernst angle. In addition, a higher signal ratio is achieved when the utilized two tissues have a larger T1 difference.
Figure 2.
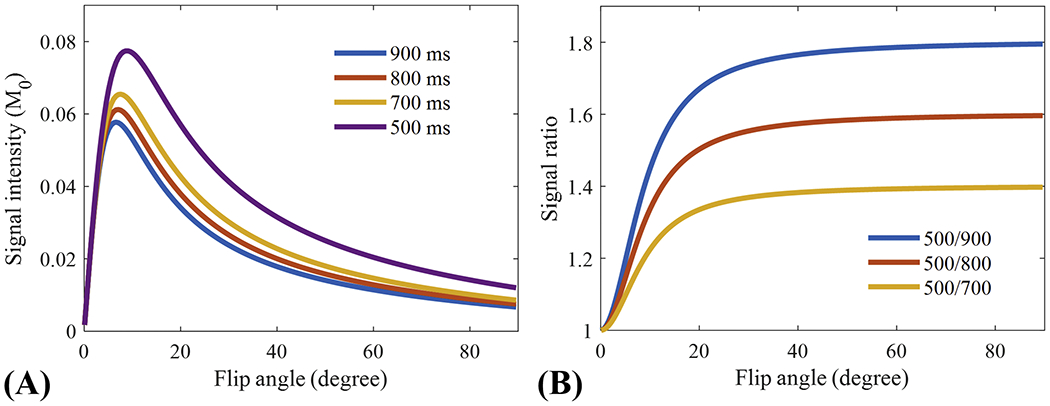
Numerical simulation results of the signal intensities of different T1 tissues (i.e., 500, 700, 800, and 900 ms) (A) and corresponding signal ratios between the tissue with a T1 of 500 ms and the three remaining tissues (B). Signal intensities of all T1s first increase then decrease with higher flip angles (A), while all the signal ratios continue to increase with higher flip angle (B). A higher signal ratio is achieved as the difference in T1 between the two utilized tissues increases.
Figure 3 shows the 3D FS-UTE-Cones image of the patellar cartilage sample and corresponding fitting curves and T1 values within different regions of cartilage. The T1 values of uncalcified cartilage decrease from the superficial layer (890±15 ms) to the middle layer (810±6 ms), then to the deep layer (730±8 ms). Cartilage within the OCJ region has a much lower T1 of 465±8 ms. The significantly lower T1 values of the calcified cartilage make it possible to generate a high contrast of the OCJ region with a T1-weighted UTE sequence using a relatively high excitation flip angle (e.g. > 20°). A high signal intensity band can be seen in the OCJ region for the image with the flip angle of 30° as shown in the Figure 3B.
Figure 3.
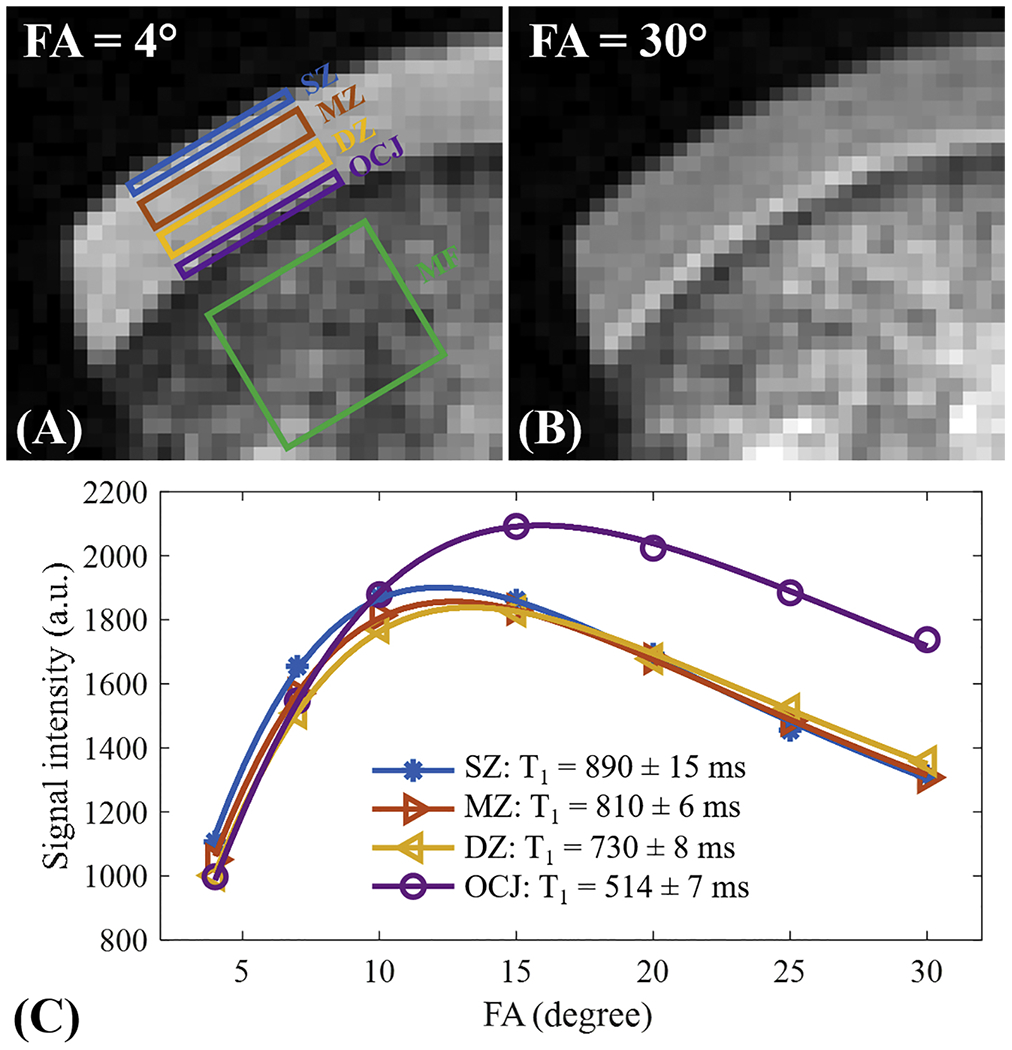
T1 measurement for a patellar cartilage sample on superficial zone (SZ), middle zone (MZ), deep zone (DZ), and OCJ region. Bone marrow fat (MF) region is also labeled in A. Images with flip angles of 4° and 30° are shown in A and B, respectively. A high signal intensity band can be seen in the OCJ region for the image with the flip angle of 30°. The fitting curves and T1 values for SZ, MZ, DZ, and OCJ are all shown in C. T1 value decreases gradually from the SZ to OCJ.
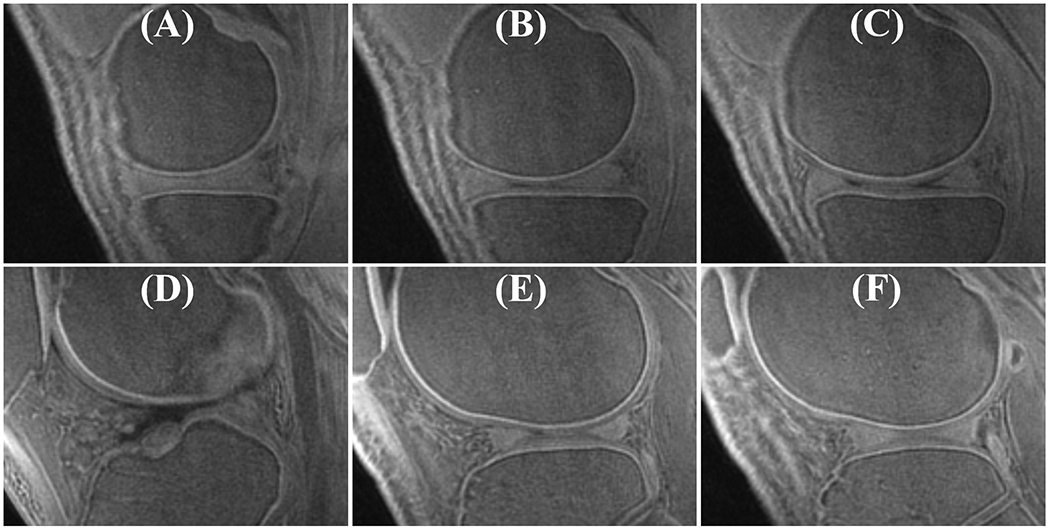
The OCJ tissues appear dark in clinical T2-weighted and PD-FSE images (Figures 4A and 4B) due to their short T2 relaxation. However, signals in the OCJ region can be detected with the PD-weighted FS-UTE-Cones sequence with low flip angles (e.g., 5° and 10° as shown in Figure 4C and 4D), but without a high OCJ contrast. In comparison, the OCJ region was highlighted as a high intensity band by the T1-weighted FS-UTE-Cones sequence with high flip angles (e.g., 25° and 30° as shown in Figure 4G and 4H). CNROCJ_SC increased from 1.2 ± 3.3 at a flip angle of 5°, to 18.3 ± 3.7 at a flip angle of 25°, and to 19.2 ± 3.0 at a flip angle of 30°. CNROCJ_MF increased from 36.7 ± 12.3 at a flip angle of 5°, to 50.6 ± 10.3 at a flip angle of 15°, and then decreased to 30.1 ± 5.4 at a flip angle of 30°. A flip angle of 30° with a maximal CNROCJ_SC and good CNROCJ_MF was used for subsequent T1-weighted FS-UTE-Cones imaging of the in vivo knee joints. However, for the ex vivo cartilage samples, the optimal flip angle in the T1-weighted FS-UTE-Cones imaging may be different from the in vivo circumstance due to the difference in T1.
Figure 4.
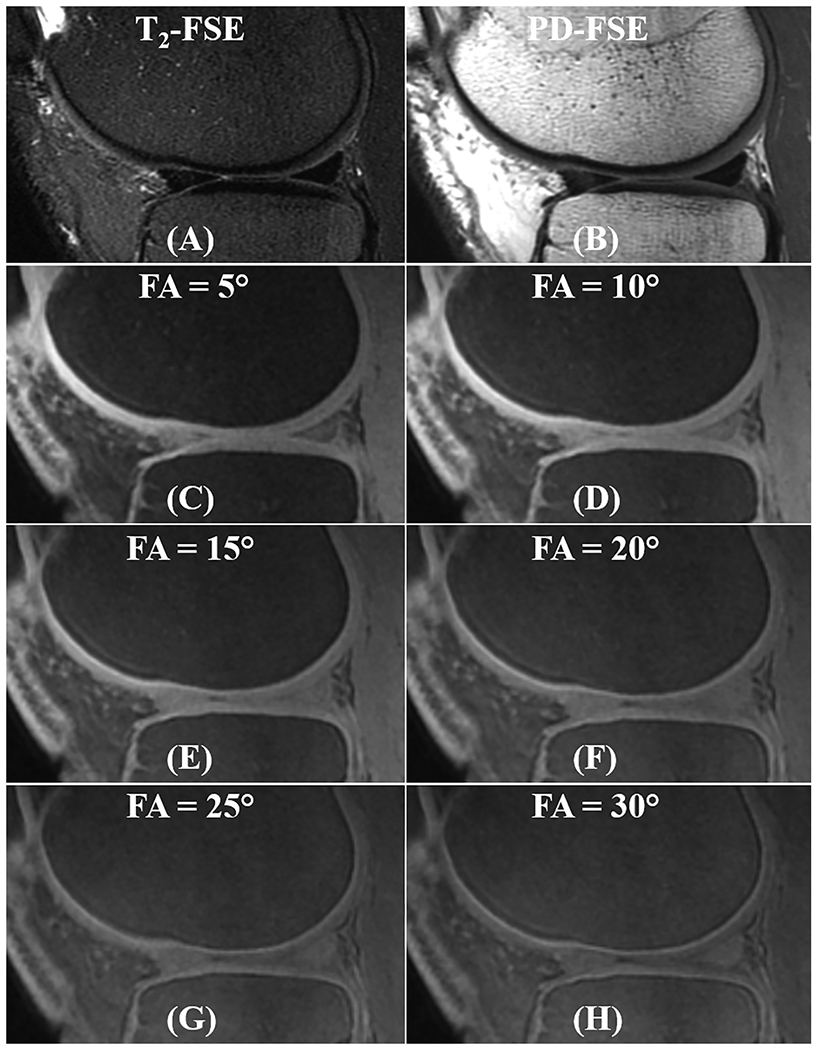
In vivo knee imaging for a 37-year-old male volunteer with the clinical T2- and PD-weighted FSE sequences (A and B), together with the FS-UTE-Cones with different flip angles (C-H). OCJ regions are dark in the T2- and PD-weighted FSE images. In contrast, FS-UTE-Cones sequence can detect signals from OCJ tissues. With a higher flip angle in FS-UTE-Cones imaging (i.e., higher T1 weighting), the OCJ tissues show a higher contrast.
Figure 5 demonstrates a high contrast of the OCJ in the whole knee joint using the proposed T1-weighted FS-UTE-Cones sequence with a flip angle of 30°. Continuous bright bands are found in the OCJ region of patella, femur, and tibia in this healthy knee joint.
Figure 5.
Representative whole knee joint OCJ images from a 36-year-old male healthy volunteer. High signal intensity bands can be seen in the OCJ regions of patella, femur, and tibia.
Figure 6 shows that the abnormal knee joints of OA patients show changes in the OCJ region morphologically in the T1-weighted FS-UTE-Cones images, depicted by an ill-defined region or region absent of a bright band adjacent and parallel to the subchondral bone (indicated by arrows). The abnormal OCJ regions shown in T1-weighted 3D FS-UTE-Cones imaging correspond well with the abnormal superficial layers seen in the clinical T2-weighted FSE imaging. Both the mean CNROCJ_SC (−5.1 ± 3.7) and CNROCJ_MF (−3.4 ± 2.3) of the abnormal OCJ regions in OA patients are lower than those of normal OCJ regions (i.e. CNROCJ_SC = 18.1 ± 3.5 and CNROCJ_MF = 26.7 ± 4.3) in healthy volunteers with p values < 0.001.
Figure 6.
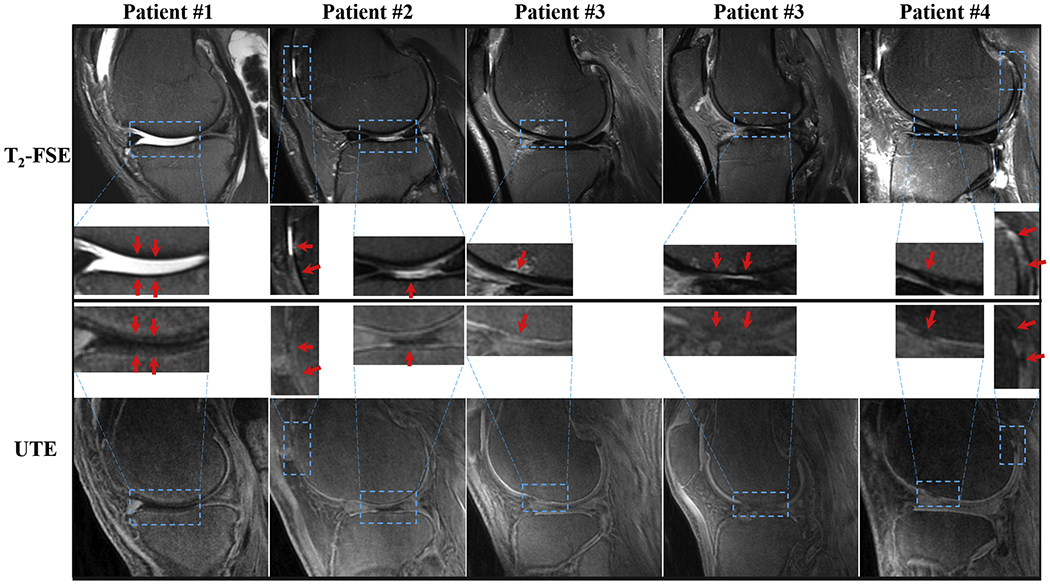
Imaging of abnormal knee joints from four OA patients (first column: first patient; second column: second patient; third and fourth columns: third patient; fifth column: fourth patient) with clinical T2-weighted FSE (first row) and the proposed T1-weighted FS-UTE-Cones images (second row). The zoomed-up regions for all the images are also shown for better comparison. The arrows indicate the abnormal regions showing reduction or loss of high intensity band in OCJ regions of T1-weighted FS-UTE-Cones images.
4. Discussion
This study demonstrated that the proposed fast 3D T1-weighted FS-UTE-Cones sequence can provide high resolution and high contrast imaging of the OCJ tissues in vivo. Numerical simulation demonstrated that the short T1 contrast increased with a higher flip angle in UTE imaging, which was confirmed in the in vivo imaging study with different flip angles. A relatively high flip angle of 30° was utilized to create a high T1 contrast in the UTE-Cones imaging and suppress the cartilage signals from more superficial layers with longer T1 values. In the healthy volunteer study, the proposed T1-weighted FS-UTE-Cones imaging consistently produced a high signal intensity band in the OCJ region. In contrast, the knee joints of OA patients presented as low intensity bands or with no band highlighted whatsoever, suggesting the detection of abnormal OCJ tissue.
The proposed T1-weighted FS-UTE-Cones sequence may provide some new information regarding early changes in cartilage. For example, a lesion in marrow fat can be found in the T2-FSE image (third column in Figure 6). However, the cartilage that was close to the marrow lesion still showed a relatively normal appearance in the T2-FSE image. Interestingly, a clear signal loss in the corresponding OCJ region was found in the T1-weighted FS-UTE-Cones image, demonstrating that the proposed T1-weighted FS-UTE-Cones sequence may be useful in detecting OCJ tissue signal changes associated with early OA.
Changes in the OCJ tissues may play an important role in early cartilage degeneration as the OCJ is centrally involved in the effective transport of nutrients from the vascular to the avascular cartilage. Previous studies demonstrated that the OCJ region may play an critical role in the initiation and/or progression of both OA and pain [7,22–24]. Electron micrographic studies have shown disruption of this barrier both with increasing age and in OA. This disruption may be a key initiating event in OA via several mechanisms, including exposure of the subchondral bone to neurogenic and angiogenic factors, as well as upregulation of metalloproteinase activity within chondrocytes of the superficial cartilage layers causing degradation of the extracellular matrix, loss of proteoglycan, and reduction in cartilage’s load-bearing ability [2–4,6]. CT has a limited role in the imaging of cartilage and cannot distinguish calcified cartilage from subchondral bone [25,26]. Clinical MRI techniques provide excellent depiction of the superficial layers of cartilage but display near zero signal from the OCJ. UTE imaging’s ability to detect signals from the OCJ tissues may therefore be of critical importance in determining the relevance of the OCJ in the structural and functional pathogenesis of OA. The proposed T1-weighted FS-UTE-Cones sequence is able to evaluate the quality of OCJ tissues, which may be useful to detect the early OA.
The proposed fast T1-weighted FS-UTE-Cones can provide volumetric imaging of the whole knee joint with a clinically feasible scan time of 3 min. A flip angle of 30° was used with this sequence to obtain a high T1 contrast without introducing apparent image artifacts. A higher flip angle (e.g., >30°) could lead to strong residual transverse magnetizations after data acquisition in each spoke. If residual transverse magnetizations are not sufficiently dephased, the final image will suffer contamination of T2 contrast as well as banding artifacts similar to balanced steady-state free precession (b-SSFP) [27,28]. A strong gradient spoiler is needed to sufficiently crush the transverse magnetizations, which leads to an increased spoke interval [27], and in turn increases scan time and reduces the T1 contrast. The strong gradient spoiler may also cause peripheral nerve stimulation in the in vivo study.
A healthy volunteer (37-year-old male) was scanned to compare the performance of OCJ imaging with the proposed T1-weighted FS-UTE-Cones, the previously reported IR-FS-UTE Cones, and the commercially available Liver Acquisition with Volume Acquisition (LAVA) (i.e., a 3D T1-weighted fast SPGR with fat suppression) sequences (see Figure 7) [14,29]. The high signal intensity band in the OCJ region was observed in both FS-UTE-Cones and IR-FS-UTE Cones images, while absent in the LAVA images due to signal loss of the short T2 OCJ tissue at a TE of 2.4 ms. Apparently, the IR-FS-UTE Cones sequence performs better in suppressing tissues with long T1 values, such as superficial cartilage and muscle, than the FS-UTE-Cones sequence. The IR technique is more effective in creating T1 contrast than the high excitation flip angle method. On the other hand, the FS-UTE-Cones sequence performs fat suppression better than the IR-FS-UTE Cones sequence since a much smaller number of spokes are acquired following the FatSat module in FS-UTE-Cones (i.e., 5 spokes) than in IR-FS-UTE Cones (i.e., 21 spokes). More spokes per TR were used in the IR-FS-UTE Cones sequence to reduce scan time. However, since the scan time of the IR-FS-UTE Cones sequence (i.e., 10.5 min) is still much longer than that of the FS-UTE-Cones sequence (i.e., 3 min), the FS-UTE-Cones sequence may be much easier for translation to clinical use. In addition, the image quality of the LAVA sequence, especially for the higher excitation flip angle one, is low. The sequence may need further optimization for knee imaging.
Figure 7.

Comparison of OCJ imaging with the proposed T1-weighted FS-UTE-Cones (A), the previously reported IR-FS-UTE Cones (B), and the commercially available LAVA (C and D) sequences. The IR-FS-UTE Cones and LAVA sequences have identical resolutions as the FS-UTE-Cones sequence. Their other sequence parameters were: 1) IR-FS-UTE Cones (B): TR/T1 = 1200/600 ms, flip angle = 10°, bandwidth = 166 kHz, Nsp = 21, τ = 5.2, scan time = 10.5 min; 2) LAVA (C, default parameters): TR/TE = 6.5/2.4 ms, flip angle = 12°, bandwidth =182 kHz, scan time = 1 min; 3) LAVA (D, using a high excitation flip angle): TR/TE = 6.5/2.4 ms, flip angle = 30°, bandwidth =182 kHz, scan time = 1 min.
The signal sources of the high intensity band in the OCJ region observed in the proposed T1-weighted FS-UTE-Cones imaging primarily include the part of deeper layers of articular cartilage, with little signal contribution from the subchondral bone due to its low proton density. This bright band has a width between 0.8 mm to 1.3 mm, which is much wider than the typical layer of calcified cartilage (i.e., < 0.1 mm) [13,25]. This can be caused by signal contribution from the deep layer, which also has a short T1, short T2 blurring, and partial volume effect (using a relatively thick slice of 2 mm in this study). A most recent study also demonstrated that the bight signals were mainly located at the deep layer cartilage [30]. In general, the qualitative method is more likely to be of clinical utility, given that assessment is rapid and intuitive. That being said, the quantitative measures, including the width or signal intensity of the bright band, may provide further information about normal aging or the rate of pathological progression in disease (to be conducted in a future study).
In OA joints, low intensity band signal or absence of signal in the T1-weighted FS-UTE-Cones images can be produced by either hyper-mineralization of deeper cartilages or by cartilage degeneration. The proton density or water content may be decreased in the hyper-mineralized cartilage, leading to eventual signal reduction of the OCJ tissues. On the other hand, the water content can be increased due to the cartilage degeneration in OA, causing significantly increased T1 relaxation. This degeneration also leads to signal reduction in the OCJ for the T1-weighted imaging technique. Clearly, more research is required to investigate the origin of the signal loss in the proposed OCJ imaging. In the future, combining the proposed technique with other quantitative UTE imaging techniques, including mapping of proton density and relaxations of T1, T2, T2*, and T1ρ [21,31], could be very helpful in obtaining more information to elucidate the pathological changes of OCJ tissues across an array of degenerative musculoskeletal conditions and diseases.
There are limitations of this feasibility study. First, we did not perform histology to confirm the signal source of the 3D T1-weighted FS-UTE-Cones imaging. Second, only a small number of healthy volunteers (five) and OA patients (eight) were studied. The clinical significance of this technique remains to be further investigated. However, the promising preliminary results demonstrate a clinical potential of the proposed T1-weighted FS-UTE-Cones sequence for evaluating the OCJ tissues in knee joints with OA. Third, the distance between the high signal intensity bands in the tibia and femur condyle may provide useful information to identify abnormalities related to different OA stages. The potential three-dimensional OA grading using the T1-weighted FS-UTE-Cones images may provide more valuable information than the commonly used one-dimensional x-ray-based Kellgren-Lawrence (KL) grading [32].
5. Conclusions
The proposed 3D T1-weighted FS-UTE-Cones sequence can highlight the OCJ region of the human knee joint. This fast technique could be valuable in detection of signal changes in the OCJ tissues which may be related to OA, especially in its early stages.
Acknowledgements
The authors acknowledge grant support from GE Healthcare, NIH (1R21 AR073496, 1R21 AR075851, 1R01 AR062581, 1R01 AR068987, and 1R01 NS092650).
Footnotes
Publisher's Disclaimer: This is a PDF file of an unedited manuscript that has been accepted for publication. As a service to our customers we are providing this early version of the manuscript. The manuscript will undergo copyediting, typesetting, and review of the resulting proof before it is published in its final form. Please note that during the production process errors may be discovered which could affect the content, and all legal disclaimers that apply to the journal pertain.
Declaration of competing interest
The authors have no conflicts of interest to declare.
References
- [1].Lawrence RC, Felson DT, Helmick CG, Arnold LM, Choi H, Deyo RA, et al. Estimates of the prevalence of arthritis and other rheumatic conditions in the United States: Part II. Arthritis Rheum 2008;58:26–35. 10.1002/art.23176. [DOI] [PMC free article] [PubMed] [Google Scholar]
- [2].Loeser RF, Goldring SR, Scanzello CR, Goldring MB. Osteoarthritis: A disease of the joint as an organ. Arthritis Rheum 2012;64:1697–707. 10.1002/art.34453. [DOI] [PMC free article] [PubMed] [Google Scholar]
- [3].Mapp PI, Walsh DA. Mechanisms and targets of angiogenesis and nerve growth in osteoarthritis. Nat Rev Rheumatol 2012;8:390–8. 10.1038/nrrheum.2012.80. [DOI] [PubMed] [Google Scholar]
- [4].Walsh DA, McWilliams DF, Turley MJ, Dixon MR, Fransès RE, Mapp PI, et al. Angiogenesis and nerve growth factor at the osteochondral junction in rheumatoid arthritis and osteoarthritis. Rheumatology 2010;49:1852–61. 10.1093/rheumatology/keq188. [DOI] [PMC free article] [PubMed] [Google Scholar]
- [5].Suri S, Gill SE, Camin SM de, McWilliams DF, Wilson D, Walsh DA. Neurovascular invasion at the osteochondral junction and in osteophytes in osteoarthritis. Ann Rheum Dis 2007;66:1423–8. 10.1136/ard.2006.063354. [DOI] [PMC free article] [PubMed] [Google Scholar]
- [6].Findlay DM, Atkins GJ. Osteoblast-Chondrocyte Interactions in Osteoarthritis. Curr Osteoporos Rep 2014;12:127–34. 10.1007/s11914-014-0192-5. [DOI] [PMC free article] [PubMed] [Google Scholar]
- [7].Suri S, Walsh DA. Osteochondral alterations in osteoarthritis. Bone 2012;51:204–l1. 10.1016/j.bone.2011.10.010. [DOI] [PubMed] [Google Scholar]
- [8].Bae WC, Biswas R, Chen K, Chang EY, Chung CB. UTE MRI of the Osteochondral Junction. Curr Radiol Rep 2014;2:35 10.1007/s40134-013-0035-7. [DOI] [PMC free article] [PubMed] [Google Scholar]
- [9].Du J, Takahashi AM, Bae WC, Chung CB, Bydder GM. Dual inversion recovery, ultrashort echo time (DIR UTE) imaging: Creating high contrast for short-T2 species. Magn Reson Med 2010;63:447–55. 10.1002/mrm.22257. [DOI] [PMC free article] [PubMed] [Google Scholar]
- [10].Bae WC, Dwek JR, Znamirowski R, Statum SM, Hermida JC, D’Lima DD, et al. Ultrashort Echo Time MR Imaging of Osteochondral Junction of the Knee at 3 T: Identification of Anatomic Structures Contributing to Signal Intensity. Radiology 2010;254:837–45. 10.1148/radiol.09081743. [DOI] [PMC free article] [PubMed] [Google Scholar]
- [11].Mackay JW, Low SBL, Houston GC, Toms AP. Ultrashort TE evaluation of the osteochondral junction in vivo: a feasibility study. Br J Radiol 2016;89:20150493 10.1259/bjr.20150493. [DOI] [PMC free article] [PubMed] [Google Scholar]
- [12].Robson MD, Gatehouse PD, Bydder M, Bydder GM. Magnetic resonance: an introduction to ultrashort TE (UTE) imaging. J Comput Assist Tomogr 2003;27:825–846. [DOI] [PubMed] [Google Scholar]
- [13].Du J, Carl M, Bae WC, Statum S, Chang EY, Bydder GM, et al. Dual inversion recovery ultrashort echo time (DIR-UTE) imaging and quantification of the zone of calcified cartilage (ZCC). Osteoarthritis Cartilage 2013;21:77–85. 10.1016/j.joca.2012.09.009. [DOI] [PMC free article] [PubMed] [Google Scholar]
- [14].Ma Y-J, Jerban S, Carl M, Wan L, Guo T, Jang H, et al. Imaging of the region of the osteochondral junction (OCJ) using a 3D adiabatic inversion recovery prepared ultrashort echo time cones (3D IR-UTE-cones) sequence at 3 T. NMR Biomed 2019;32:e4080 10.1002/nbm.4080. [DOI] [PMC free article] [PubMed] [Google Scholar]
- [15].Lee YH, Kim S, Song H-T, Kim I, Suh J-S. Weighted subtraction in 3D ultrashort echo time (UTE) imaging for visualization of short T2 tissues of the knee. Acta Radiol 2014;55:454–61. 10.1177/0284185113496994. [DOI] [PubMed] [Google Scholar]
- [16].Kühn J-P, Hernando D, Meffert PJ, Reeder S, Hosten N, Laqua R, et al. Proton-density fat fraction and simultaneous R2* estimation as an MRI tool for assessment of osteoporosis. Eur Radiol 2013;23:3432–3439. [DOI] [PMC free article] [PubMed] [Google Scholar]
- [17].Carl M, Bydder GM, Du J. UTE imaging with simultaneous water and fat signal suppression using a time-efficient multispoke inversion recovery pulse sequence. Magn Reson Med 2016;76:577–82. 10.1002/mrm.25823. [DOI] [PMC free article] [PubMed] [Google Scholar]
- [18].Ma Y-J, Jerban S, Jang H, Chang EY, Du J. Fat suppression for ultrashort echo time imaging using a novel soft-hard composite radiofrequency pulse. Magn Reson Med 2019;82:2178–87. 10.1002/mrm.27885. [DOI] [PMC free article] [PubMed] [Google Scholar]
- [19].Pauly J, Le Roux P, Nishimura D, Macovski A. Parameter relations for the Shinnar-Le Roux selective excitation pulse design algorithm (NMR imaging). IEEE Trans Med Imaging 1991;10:53–65. 10.1109/42.75611. [DOI] [PubMed] [Google Scholar]
- [20].Ma Y-J, Lu X, Carl M, Zhu Y, Szeverenyi NM, Bydder GM, et al. Accurate T1 mapping of short T2 tissues using a three-dimensional ultrashort echo time cones actual flip angle imaging-variable repetition time (3D UTE-Cones AFI-VTR) method. Magn Reson Med 2018;80:598–608. [DOI] [PMC free article] [PubMed] [Google Scholar]
- [21].Ma Y-J, Zhao W, Wan L, Guo T, Searleman A, Jang H, et al. Whole knee joint T1 values measured in vivo at 3T by combined 3D ultrashort echo time cones actual flip angle and variable flip angle methods. Magn Reson Med 2018. [DOI] [PMC free article] [PubMed] [Google Scholar]
- [22].Mente PL, Lewis JL. Elastic modulus of calcified cartilage is an order of magnitude less than that of subchondral bone. J Orthop Res Off Publ Orthop Res Soc 1994;12:637–47. 10.1002/jor.1100120506. [DOI] [PubMed] [Google Scholar]
- [23].Anderson DD, Brown TD, Radin EL. The influence of basal cartilage calcification on dynamic juxtaarticular stress transmission. Clin Orthop 1993:298–307. [PubMed] [Google Scholar]
- [24].Ferguson VL, Bushby AJ, Boyde A. Nanomechanical properties and mineral concentration in articular calcified cartilage and subchondral bone. J Anat 2003;203:191–202. 10.1046/j.1469-7580.2003.00193.x. [DOI] [PMC free article] [PubMed] [Google Scholar]
- [25].Kauppinen S, Karhula SS, Thevenot J, Ylitalo T, Rieppo L, Kestilä I, et al. 3D morphometric analysis of calcified cartilage properties using micro-computed tomography. Osteoarthritis Cartilage 2019;27:172–80. 10.1016/j.joca.2018.09.009. [DOI] [PubMed] [Google Scholar]
- [26].Jeffrey DR, Watt I. Imaging hyaline cartilage. Br J Radiol 2003;76:777–87. 10.1259/bjr/51504520. [DOI] [PubMed] [Google Scholar]
- [27].Yarnykh VL. Optimal radiofrequency and gradient spoiling for improved accuracy of T1 and B1 measurements using fast steady-state techniques. Magn Reson Med 2010;63:1610–26. 10.1002/mrm.22394. [DOI] [PubMed] [Google Scholar]
- [28].Yarnykh VL. Actual flip-angle imaging in the pulsed steady state: A method for rapid three-dimensional mapping of the transmitted radiofrequency field. Magn Reson Med 2007;57:192–200. 10.1002/mrm.21120. [DOI] [PubMed] [Google Scholar]
- [29].Li XH, Zhu J, Zhang XM, Ji YF, Chen TW, Huang XH, et al. Abdominal MRI at 3.0 T: LAVA-flex compared with conventional fat suppression T1-weighted images. J Magn Reson Imaging 2014;40:58–66. [DOI] [PubMed] [Google Scholar]
- [30].Nykänen O, Leskinen HP, Finnilä M, Karhula SS, Turunen MJ, Töyräs J, et al. The bright ultra-short echo time SWIFT MRI signal at the osteochondral junction is not located in the calcified cartilage. J Orthop Res 2020. [DOI] [PubMed] [Google Scholar]
- [31].Ma Y-J, Carl M, Shao H, Tadros AS, Chang EY, Du J. Three-dimensional ultrashort echo time cones T1ρ (3D UTE-cones-T1ρ ) imaging. NMR Biomed 2017;30 10.1002/nbm.3709. [DOI] [PMC free article] [PubMed] [Google Scholar]
- [32].Kellgren JH, Lawrence JS. Radiological Assessment of Osteo-Arthrosis. Ann Rheum Dis 1957;16:494–502. [DOI] [PMC free article] [PubMed] [Google Scholar]


