

This retrospective analysis from 5 Maryland and Washington, DC area hospitals determines factors on hospital admission predictive of severe disease or death from COVID-19 and describes patient trajectories and outcomes categorized using the WHO COVID-19 disease severity scale.
Visual Abstract. Trajectories Among Patients Hospitalized for COVID-19.
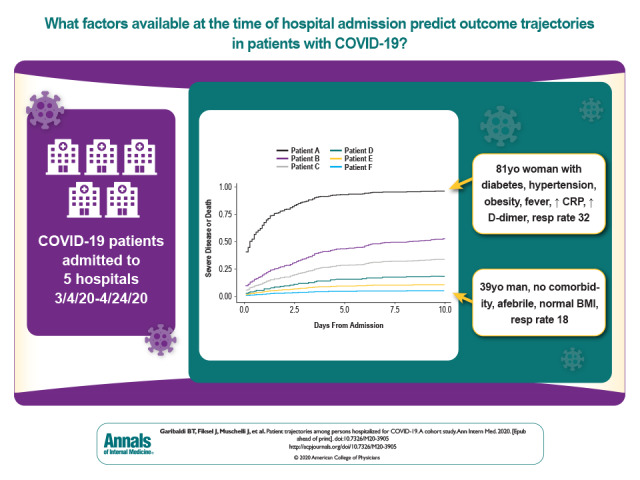
This retrospective analysis from 5 Maryland and Washington, DC, area hospitals determines factors on hospital admission predictive of severe disease or death from COVID-19 and describes patient trajectories and outcomes categorized using the WHO COVID-19 disease severity scale.
Abstract
Background:
Risk factors for progression of coronavirus 2019 (COVID-19) to severe disease or death are underexplored in U.S. cohorts.
Objective:
To determine the factors on hospital admission that are predictive of severe disease or death from COVID-19.
Design:
Retrospective cohort analysis.
Setting:
Five hospitals in the Maryland and Washington, DC, area.
Patients:
832 consecutive COVID-19 admissions from 4 March to 24 April 2020, with follow-up through 27 June 2020.
Measurements:
Patient trajectories and outcomes, categorized by using the World Health Organization COVID-19 disease severity scale. Primary outcomes were death and a composite of severe disease or death.
Results:
Median patient age was 64 years (range, 1 to 108 years); 47% were women, 40% were Black, 16% were Latinx, and 21% were nursing home residents. Among all patients, 131 (16%) died and 694 (83%) were discharged (523 [63%] had mild to moderate disease and 171 [20%] had severe disease). Of deaths, 66 (50%) were nursing home residents. Of 787 patients admitted with mild to moderate disease, 302 (38%) progressed to severe disease or death: 181 (60%) by day 2 and 238 (79%) by day 4. Patients had markedly different probabilities of disease progression on the basis of age, nursing home residence, comorbid conditions, obesity, respiratory symptoms, respiratory rate, fever, absolute lymphocyte count, hypoalbuminemia, troponin level, and C-reactive protein level and the interactions among these factors. Using only factors present on admission, a model to predict in-hospital disease progression had an area under the curve of 0.85, 0.79, and 0.79, at day 2, 4, and 7, respectively.
Limitation:
The study was done in a single health care system.
Conclusion:
A combination of demographic and clinical variables is strongly associated with severe COVID-19 disease or death and their early onset. The COVID-19 Inpatient Risk Calculator (CIRC), using factors present on admission, can inform clinical and resource allocation decisions.
Primary Funding Source:
Hopkins inHealth and COVID-19 Administrative Supplement for the HHS Region 3 Treatment Center from the Office of the Assistant Secretary for Preparedness and Response.
The first case of coronavirus disease 2019 (COVID-19) in the United States was identified on 20 January 2020 in a returned traveler from Wuhan, China (1). By early August 2020, about one quarter of the world's cases and deaths were in the United States (2). Outcomes range from asymptomatic infection to death (3, 4). Age; sex; smoking; race; body mass index (BMI); inflammatory markers; lymphopenia; and comorbid conditions, such as hypertension and diabetes, have emerged as risk factors for severe outcomes (4–6). Although older age is an important risk factor for hospitalization and death, younger persons may develop severe disease (7). Further definition of factors present at hospital admission that predict poor outcomes may help to inform allocation plans for potentially scarce resources, such as ventilators and therapeutics (8, 9), and help guide discussions with patients and families.
We report a comprehensive analysis of the clinical features, patient trajectories, and risk factors for progression to severe disease or death at the time of hospital admission among all patients admitted to our hospital system and used these data to develop the COVID-19 Inpatient Risk Calculator (CIRC) to quantify the probability of progression to severe disease or death among patients hospitalized with COVID-19.
Methods
Study Design and Participants
This cohort study was conducted at Johns Hopkins Hospital, Baltimore, Maryland; Bayview Hospital, Baltimore, Maryland; Howard County General Hospital, Columbia, Maryland; Suburban Hospital, Bethesda, Maryland; and Sibley Hospital, Washington, D.C. These 5 hospitals comprise Johns Hopkins Medicine (JHM), a health care system with 2513 beds (354 intensive care unit beds) serving approximately 7 million persons. The institutional review boards of these hospitals approved this study as minimal risk and waived consent requirements.
All patients consecutively admitted with confirmed severe acute respiratory syndrome coronavirus 2 infection according to any nucleic acid test with an Emergency Use Authorization from the US Food and Drug Administration between 4 March and 24 April 2020 were included. Time zero for all analyses was the time of the admission order.
Data Collection
The primary data source was JH-CROWN: The COVID-19 PMAP Registry, which utilizes the Hopkins Precision Medicine Analytics Platform (10) and includes demographic characteristics, medical history, comorbid conditions, symptoms, vital signs, respiratory events, medications, and laboratory results.
Outcome Measures and Definitions
Primary outcomes were defined by using the World Health Organization (WHO) COVID-19 disease severity scale (11). The WHO scale is an 8-point ordinal scale ranging from ambulatory (1 = asymptomatic, 2 = mild limitation in activity) to hospitalized with mild to moderate disease (3 = room air, 4 = nasal cannula or facemask oxygen), hospitalized with severe disease (5 = high-flow nasal cannula or noninvasive positive pressure ventilation, 6 = intubation and mechanical ventilation, 7 = intubation and mechanical ventilation and other signs of organ failure [hemodialysis, vasopressors, extracorporeal membrane oxygenation]), and death (score of 8). We defined severe disease as a score of 5 to less than 8 and the composite outcome of severe disease or death as a score of 5 to 8 on the WHO scale.
Laboratory testing was determined by treating physicians. Natural language processing was used to identify presenting symptoms (Supplement Table).
Statistical Analysis
To assess the association between patient characteristics at admission and outcomes, a set of 24 demographic and clinical variables were selected on the basis of their clinical relevance. Multiple comorbid condition burden was assessed by using the 17-item modified Charlson Comorbidity Index (CCI) (12, 13). We imputed missing values by chained equations (MICE) with predictive mean matching (MICE, R package, version 3.7.0) (14–16) with 10 rounds of multiple imputation (Supplement Figure 1). For the 7 out of 694 discharged patients whom we know subsequently died, we censored their outcomes at time of discharge to minimize bias due to treating them differently from the discharged patients with unknown vital status. To estimate the association between baseline patient characteristics and a given cause-specific outcome, we used Cox proportional hazard regression models with baseline hazards stratified by admitting hospital (17). Standard error estimates that account appropriately for missing covariates were computed by using the Rubin rules (18).
To protect against overfitting, models were initially built by splitting the predictor variables into clinically meaningful subgroups or “blocks” (for example, “demographic” or “comorbid conditions”), then adding the best predictors from each block. For the composite outcome of severe disease or death, no further variable selection was performed. For the time-to-death models, with few events relative to the number of variables of interest, we fit cause-specific proportional-hazards models regularized with an elastic net penalty (glmnet, R package, version 3.0.2) (19). This model was run on each of the 10 imputed data sets, and variables with nonzero coefficients in at least half of the models were chosen for the final model (20). The composite CCI was used instead of individual comorbidities to reduce the risk for model overfitting. The Sao 2/Fio 2 ratio was eligible for selection into the death model but not for the composite outcome model to avoid reverse-causality bias, because reaching severe disease is directly tied to a worsening Sao 2/Fio 2 ratio.
To address age interactions, we first fit models separately for 3 age groups for time to severe disease or death (younger than 60 years, 60 to 74 years, and 75 years or older) and for 2 age groups for the time until death (60 to 74 years and 75 years or older). Owing to changes in statistical significance or in the direction of model coefficients between age groups for sex, CCI, and troponin (for time to severe disease or death) and for the effect of nursing home (for time to death), we refit our final models including age as a 3-level factor and interactions with these factors.
There is clinical utility in predicting an individual's risk for a severe outcome over time. Because discharge and severe disease or death are competing risks, we calculated a cumulative incidence of severe disease or death for each individual's baseline covariate profile. The cumulative incidence function at time t is the probability of the cause-specific outcome having occurred by then. Unlike the prediction in a noncompeting risks model, it requires estimation of a hazard model for the outcome of interest and for the competing event. We estimated the discharge hazard with a Cox regression with the same predictors as for the outcome of interest by using the CSC function in the R package risk regression (21).
To evaluate the cumulative incidence model's ability to discriminate higher from lower-risk patients, we used the area under the cumulative-dynamic receiver-operator characteristic curve (AUC(t)) (22). We used 10-fold cross-validation so that the AUC(t) estimate did not use the same data to fit the model and also assess its quality. We then checked for heterogeneity by using a hospital-specific cross validation where all patients from a given hospital were held out of the training set and then used in the validation set.
Analyses were done by using R, version 3.6.2 (23).
Role of the Funding Source
The data utilized were part of the JH-CROWN: The COVID PMAP Registry, which is based on the contribution of many patients and clinicians and is funded by Hopkins inHealth, the Johns Hopkins Precision Medicine Program. Drs. Garibaldi, Muschelli, Robinson, and Gupta and Mr. Schumock received funding from the COVID-19 Administrative Supplement for the HHS Region 3 Treatment Center from the Office of the Assistant Secretary for Preparedness and Response. The funders had no role in the design, analysis, or conduct of the study or in the decision to submit the manuscript for publication.
Results
Study Population
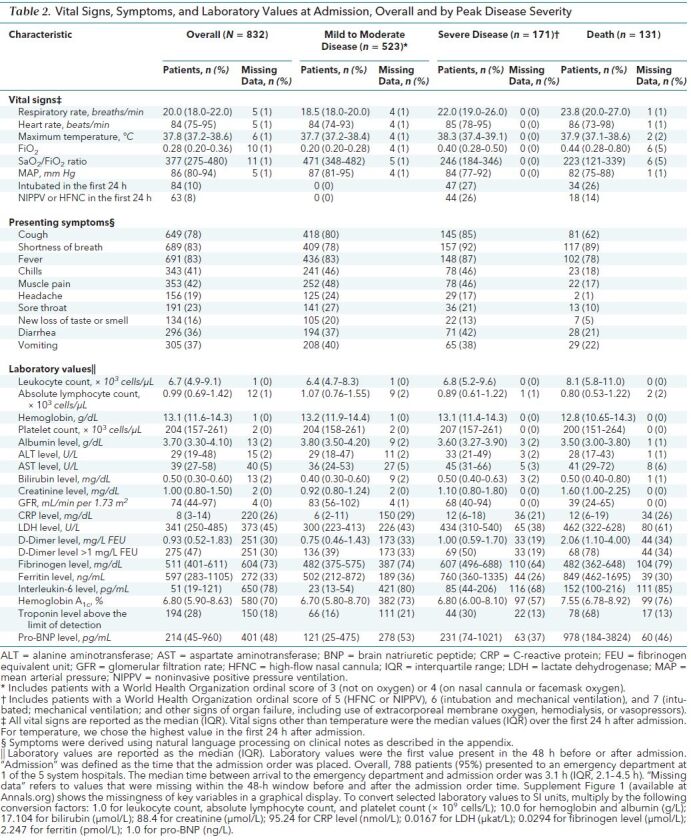
During the study window, 832 patients were admitted with COVID-19. Table 1 shows demographic characteristics and comorbid conditions, and Table 2 shows symptoms, vital signs, and laboratory values on admission. Median age was 63 years (interquartile range [IQR], 49 to 75 years; range, 1 to 108 years). Patients younger than 18 years (n = 3) were excluded from subsequent analyses. Among 788 patients presenting to the emergency department, median time from emergency department arrival to admission was 3.1 hours (IQR, 2.1 to 4.5 hours). At administrative censoring on 24 June 2020, 694 patients (83%) had been discharged, 131 (16%) had died, and 7 (0.8%) remained hospitalized with severe disease. Among those who had been discharged, 523 (63%) had mild to moderate disease and 171 (21%) had severe disease. There were notable differences in demographic and clinical characteristics by peak severity of disease category (Tables 1 and 2) as well as by admission hospital (Supplement Table 2). For example, the median age was higher among patients who died than among those were survived. Ninety percent of deaths occurred in patients aged 60 years or older. Patients who died were more likely to have hypertension, coronary artery disease, chronic kidney disease, and cancer, but the prevalence of diabetes and chronic lung disease was similar across the groups. Vital signs and laboratory values also differed among peak disease categories (Table 2). Supplement Figure 2 shows demographic and clinical characteristics by WHO peak illness severity score.
Table 1. Baseline Demographic Characteristics and Comorbid Conditions, Overall and by Peak Disease Severity.
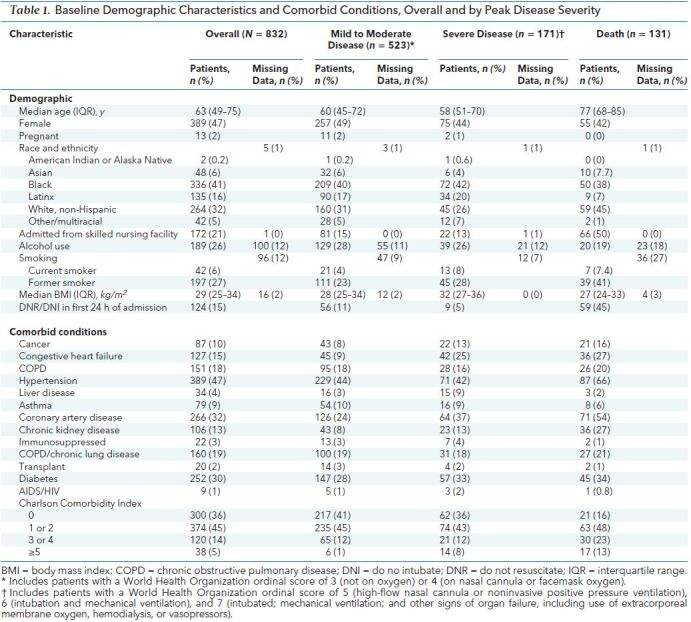
Table 2. Vital Signs, Symptoms, and Laboratory Values at Admission, Overall and by Peak Disease Severity.
Clinical Course by Disease Outcome
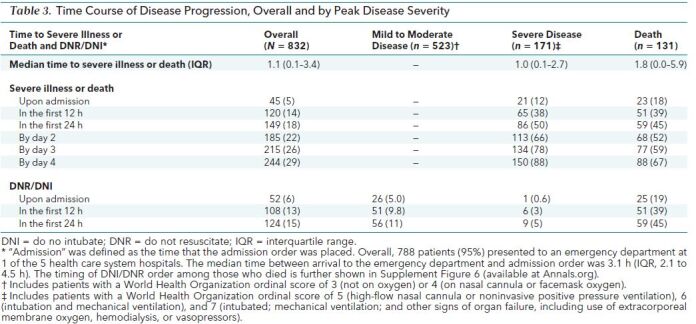
Table 3 and Supplement Figures 3 to 5 show patient trajectories by peak WHO disease category. Forty-five patients (5%) had severe disease on arrival. Of the remaining 787 patients, 120 (15%) developed severe disease or died by 12 hours, 149 (19%) by 24 hours, 185 (24%) by 48 hours, 215 (27%) by 72 hours, and 244 (31%) by 96 hours. The median time to severe disease or death among the 302 patients who experienced that outcome was 1.1 days (IQR, 0.07 to 3.4 days). Supplement Figure 6 shows the individual patient trajectories and key events in those who died. Most (n = 114 [87%]) had a do not resuscitate (DNR)/do not intubate (DNI) order placed during their admission, with 25 (19%) having a DNR/DNI on admission.
Table 3. Time Course of Disease Progression, Overall and by Peak Disease Severity.
Median length of stay was 7.0 days (IQR, 3.1 to 13.2 days) and differed by peak disease state (mild to moderate disease, 4.9 days [IQR, 2.6 to 8.6 days]; severe disease, 19.0 days [IQR, 11.9 to 30.0 days]; and death, 8.5 days [IQR, 3.6 to 16.2 days]). Supplement Table 3 shows medications administered.
Of 179 (22%) mechanically ventilated patients, median time to ventilation was 1.2 days (IQR, 0.1 to 3.1 days). Median duration of mechanical ventilation was 10.5 days (IQR, 3.9 to 21.2 days) overall, 11.6 days (IQR, 6.7 to 22.9 days) for discharged patients (102 [57%]), and 7.1 days (IQR, 1.3 to 16.6 days) for those who died (70 [39%]). Six patients (0.7%) were placed on extracorporeal membrane oxygen; 3 died and 3 were discharged. Seven patients remained hospitalized; 3 remained intubated for a median of 66.5 days, and 4 were extubated after a median of 35.7 days. Of the 131 patients who died, 118 (90%) were older than 60 years, 66 (50%) were nursing home residents, and 63 (48%) had baseline dementia.
Factors on Admission Associated With Time to Severe Disease or Death
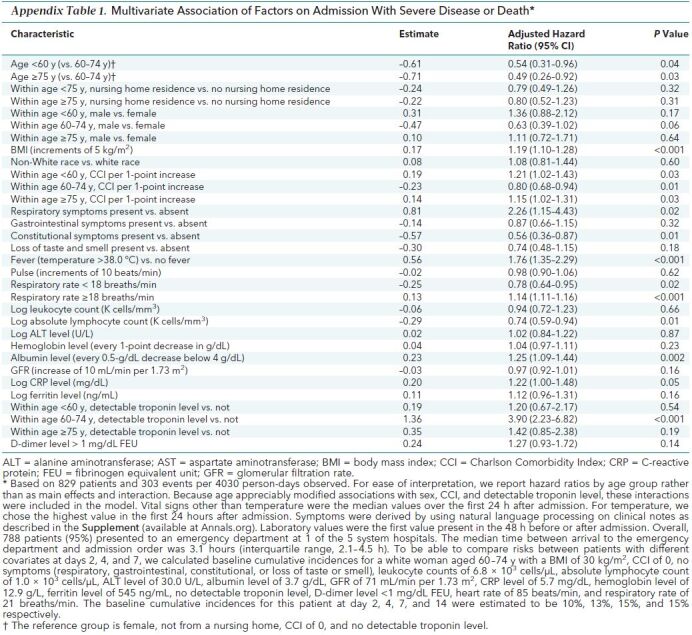
Age appreciably modified associations with sex, multiple comorbid conditions (measured by CCI), and detectable troponin level. Including these effect modifiers in Cox models to describe disease progression, several demographic and clinical factors were significantly associated (Appendix Table 1). Compared with a reference group of patients aged 60 to 74 years (female, not from a nursing home, CCI of 0, and no detectable troponin level), patients younger than 60 years and patients aged 75 years or older were less likely to develop severe disease (for both of the latter groups, a change in risk at 2 days from 10% to 5%). A higher CCI was associated with an increased risk for progression in patients younger than 60 years (a change in risk at 2 days from 10% to 12%) and patients aged 75 years or older (a change in risk at 2 days from 10% to 11%) but a lower risk for progression among patients aged 60 to 74 years (a change in risk at 2 days from 10% to 8%). A detectable troponin level was associated with an increased risk for progression to severe disease or death, but this association was only statistically significant in patients aged 60 to 74 years. Other factors were associated with progression to severe disease or death independent of age; these included BMI (a change in risk by 4 days from 13% to 16% for each 5-point increase), respiratory symptoms (a change in risk by 4 days from 13% to 30%), CRP level, respiratory rate, albumin level, and temperature greater than 38.0 °C (a change in risk by 4 days from 13% to 23%). Constitutional symptoms were associated with a decreased risk for severe disease, as was a higher absolute lymphocyte count.
Appendix Table 1. Multivariate Association of Factors on Admission With Severe Disease or Death*.
Cumulative Incidence and Risk Probabilities by Days After Hospital Admission
We generated cumulative incidence plots for commonly encountered patients with different baseline conditions to illustrate specific factors associated with progression to the composite outcome of severe disease or death (Figure). For example, an 81-year-old Black woman with diabetes and hypertension, a BMI of 35 kg/m2, fever, a respiratory rate of 32 breaths/min, a high CRP level, and a D-dimer level greater than 1 mg/L has a probability of progressing to severe disease or death of 80%, 92%, and 96% by days 2, 4, and 7, respectively, after admission. In contrast, a 39-year-old Latinx man with a BMI of 23 kg/m2, no comorbid conditions, and no fever has a probability of progression of 3%, 5%, and 5% by days 2, 4, and 7.
Figure. Cumulative incidence of severe disease or death for characteristic patients.

The cumulative incidences are calculated from the model in Appendix Table 1. BMI = body mass index; CCI = Charlson Comorbidity Score; CRP = C-reactive protein. Left. Cumulative incidences at day 2, 4, and 7 after admission for 6 characteristic patients. These exemplars were chosen by selecting for key characteristics that are known to affect risk in our Cox models. Right. Cumulative incidence plots for each characteristic patient. The plots show how some patients have a higher likelihood of progression to severe disease or death and progress at a faster rate than others. For example, patient A has an 80% risk for severe disease or death by day 2, whereas patient F has only a 3% risk. The slope of the curve for patient A is also steeper than that of the others.
Prediction Model for Progression to Severe Disease or Death
The cause-specific hazard model in Appendix Table 1 and the same model for the competing risk discharge was applied to each person's baseline characteristics to predict their risk (cumulative incidence) of severe disease or death given their baseline covariate profile. The AUC(t) at days 2, 4, and 7 is shown in Table 4. The value is largest at day 2 (0.85) but remains close to 0.80 for the entire week. An interactive version of the COVID-19 Inpatient Risk Calculator (CIRC) is available at https://rsconnect.biostat.jhsph.edu/covid_predict/.
Table 4. Cross-validated Estimates of AUC(t) for Time to Severe Disease or Death Outcome Prediction*.
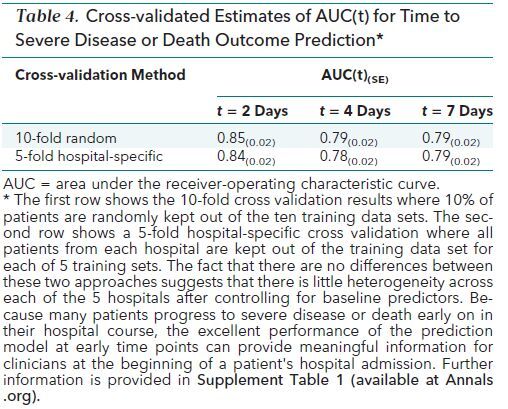
Having 5 hospitals with diverse patient populations was an opportunity to quantify the heterogeneity in patient's risk among these hospitals, which we did by estimating a separate hospital fixed effect for each hospital. Controlling for baseline covariates that differ substantially across hospitals, a joint test that all hospitals have the same baseline rate was not rejected (P = 0.385) (data not shown). We also performed a hospital-specific cross-validation of the prediction error, leaving out all patients from each hospital rather than a random subset of patients. The AUC estimates do not statistically differ from the standard cross-validation, indicating that predictions for patients at a given JHM hospital held out of the training set discriminate patients with severe disease from those with nonsevere disease just as well as predictions within hospitals used for training the model.
Factors on Admission Associated With Time to Death
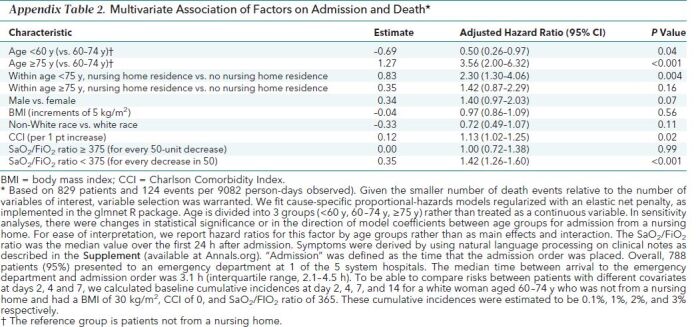
When death alone was assessed, important risk factors included age, age interaction with nursing home, CCI, and Sao 2/Fio 2 ratio (Appendix Table 2). Compared with a reference group of patients aged 60 to 74 years who were not admitted from a nursing home, patients younger than 60 years had a decreased risk for death (a change in baseline risk at 7 days from 2% to 1%) and patients aged 75 or older had an increased risk for death (a change in baseline risk at 7 days from 2% to 7%). Admission from a nursing home was associated with an increased risk for death, but this association was only statistically significant in patients younger than 75 years (a change in baseline risk at 7 days from 2% to 5%). The CCI and Sao 2/Fio 2 ratio were associated with death across all age groups. There were not enough events to create a reliable prediction model for death as the main outcome.
Appendix Table 2. Multivariate Association of Factors on Admission and Death*.
Discussion
Our study provides insight into the disease trajectories of hospitalized patients with COVID-19 in the United States and the risk factors associated with severe outcomes. Rapid progression of disease after admission provides a narrow window to intervene to avert these outcomes. Different combinations of risk factors predict severe disease or death with probabilities ranging from over 90% to as little as 5% (that is, 18-fold for patients at highest risk compared with those at lowest risk). Selected risk factors carry great importance in prediction.
As seen elsewhere (24–26), older age and nursing home residence were associated with a high risk for death. Nursing home patients tend to be older, have high comorbidity, and live in an environment where COVID-19 can spread rapidly among staff and residents (27, 28). Underlying conditions, such as cognitive impairment or chronic cough, can delay recognition of symptoms and presentation to the hospital (27). With approximately 1.4 million nursing home residents in the United States (29), strategies to prevent and treat COVID-19 in this population are needed.
One in 5 patients who died had DNR/DNI orders at the time of admission, probably reflecting advanced directives. Presence of a DNR/DNI order affected the use of specific interventions, measurement of disease severity by using the WHO scale, and time to death. Almost all patients who died without receiving mechanical ventilation had DNR/DNI orders. It is difficult to know how end-of-life practices differed across doctors and hospitals and whether DNR/DNI orders reflected patient preference or rapid development of severe disease with perceived poor outcomes. The implementation of advanced directives varies globally (30) and may contribute to geographic differences in COVID-19 mortality.
As in other studies (31–34), BMI was strongly associated with severe disease or death. This could be due to obesity-related diabetes, cardiovascular disease, and inflammation that impairs the immune response and induces oxidant stress. Obesity can also impair the mechanics of breathing (35, 36). This association is particularly important in the United States, where the age-adjusted prevalence of obesity is 42%. Obesity prevalence is higher among Black persons, Latinx persons, and persons aged 40 to 59 years and is linked to socioeconomic status, other comorbid conditions, and poor health outcomes (37). In the United States, younger patients admitted to the hospital for COVID-19 are more likely to be obese (38). The relationship between obesity and COVID-19 outcomes in older patients is probably complicated by the fact that excess body weight in frail older adults may be somewhat protective against additional stressors (39).
Although 60% of patients were non-White, we did not observe associations of race/ethnicity with severe disease or death after adjustment for clinical factors.
Easily measured baseline parameters (absolute lymphocyte count; CRP, troponin, and albumin levels; respiratory rate; and Sao 2/Fio 2 ratio) were associated with disease trajectory. Respiratory rate is included in mortality prediction scores for hospitalized patients (40–42) and has been associated with mortality in COVID-19 (43). A lower Sao 2/Fio 2 ratio is associated with mortality because hypoxic respiratory failure is a hallmark of severe COVID-19. A lower Sao 2/Fio 2 ratio is also associated with mortality in other causes of acute respiratory distress syndrome and respiratory failure (44, 45).
Our observed mortality of 16% is lower than the 20% to 28% reported from hospitalized cohorts in Italy, China, the United Kingdom, and elsewhere in the United States (4, 20–23, 46) but is similar to the 13% mortality in the placebo arm of the Adaptive COVID-19 Treatment Trial (47). Lower mortality could be due to our more complete observation of discharge outcome or because the Johns Hopkins Hospital is one of the Regional Ebola and Special Pathogens Treatment Centers (RESPTCs) funded to improve domestic preparedness following the 2014–2016 Ebola outbreak (48, 49). Furthermore, the health system did not exceed its capacity of hospital and intensive care unit beds.
The CIRC performed best at predicting progression to severe disease or death in the first 2 days of hospital admission and thus offers valuable information at the time of initial hospital evaluation. Within the 5 study hospitals, the model discriminated higher- from lower-risk patients equally well regardless of whether the patients were from the hospitals used to fit the model. Although the model performed well at predicting progression by hospital days 4 and 7, models that incorporate longitudinal data will probably provide more accurate predictions at these later time points.
Our study has limitations. First, the data are derived from a single health system. However, we observed limited heterogeneity across the 5 hospitals after controlling for baseline predictors, suggesting that this model could apply to other hospitals. Second, collection of key laboratory values was not standardized across the health system, or even at individual hospitals, which contributed to missing data. Third, testing challenges may have caused underascertainment of COVID-19–positive cases in our health system (50). Fourth, we did not have respiratory viral panels for all patients and did not account for the possibility that coinfection with other viral infections may have altered disease trajectory. Fifth, the electronic health record may not have documented all comorbid conditions. Sixth, some symptoms, such as loss of taste or smell, may have been underrepresented because they were not recognized early on in the pandemic and severely ill patients may have been unable to accurately report symptoms. Seventh, our data set did not include symptom onset because this metric is difficult to extract by using natural language processing. Finally, postdischarge outcomes were not captured if they occurred outside of the health system.
In conclusion, we identified important factors easily ascertained at admission that are associated with severe COVID-19 outcomes. Specific subgroups had high risk for progression to severe illness or death. Progression to severe disease or death can be rapid. A model using factors on admission to the hospital can predict outcome at days 2, 4, and 7 of hospitalization. Future studies will focus on prediction using longitudinal data to assist clinicians, patients, and families as they navigate COVID-19.
Supplementary Material
Footnotes
This article was published at Annals.org on 22 September 2020
* Drs. Garibaldi and Fiksel contributed equally as first authors.
† Drs. Zeger and Gupta contributed equally as senior authors.
References
- 1. Holshue ML, DeBolt C, Lindquist S, et al; Washington State 2019-nCoV Case Investigation Team. First case of 2019 novel coronavirus in the United States. N Engl J Med. 2020;382:929-936. [PMID: 32004427] doi:10.1056/NEJMoa2001191 [DOI] [PMC free article] [PubMed]
- 2. Center for Systems Science and Engineering, Johns Hopkins University. COVID-19 Dashboard by the Center for Systems Science and Engineering (CSSE) at Johns Hopkins University (JHU). Accessed at https://coronavirus.jhu.edu/map.htmlon 1 September 2020.
- 3. Wang D, Hu B, Hu C, et al. Clinical characteristics of 138 hospitalized patients with 2019 novel coronavirus-infected pneumonia in Wuhan, China. JAMA. 2020;323:1061-1069. [PMID: 32031570] doi:10.1001/jama.2020.1585 [DOI] [PMC free article] [PubMed]
- 4. Richardson S, Hirsch JS, Narasimhan M, et al; the Northwell COVID-19 Research Consortium. Presenting characteristics, comorbidities, and outcomes among 5700 patients hospitalized with COVID-19 in the New York City area. JAMA. 2020;323:2052-2059. [PMID: 32320003] doi:10.1001/jama.2020.6775 [DOI] [PMC free article] [PubMed]
- 5. Onder G, Rezza G, Brusaferro S. Case-fatality rate and characteristics of patients dying in relation to COVID-19 in Italy. JAMA. 2020;323:1775-1776. [PMID: 32203977] doi:10.1001/jama.2020.4683 [DOI] [PubMed]
- 6. Wu C, Chen X, Cai Y, et al. Risk factors associated with acute respiratory distress syndrome and death in patients with coronavirus disease 2019 pneumonia in Wuhan, China. JAMA Intern Med. 2020;180:934-943. [PMID: 32167524] doi:10.1001/jamainternmed.2020.0994 [DOI] [PMC free article] [PubMed]
- 7. Garg S, Kim L, Whitaker M, et al. Hospitalization rates and characteristics of patients hospitalized with laboratory-confirmed coronavirus disease 2019 - COVID-NET, 14 states, March 1-30, 2020. MMWR Morb Mortal Wkly Rep. 2020;69:458-464. [PMID: 32298251] doi:10.15585/mmwr.mm6915e3 [DOI] [PMC free article] [PubMed]
- 8. Ison MG, Wolfe C, Boucher HW. Emergency use authorization of remdesivir: the need for a transparent distribution process. JAMA. 2020;323:2365-2366. [PMID: 32407438] doi:10.1001/jama.2020.8863 [DOI] [PubMed]
- 9. Emanuel EJ, Persad G, Upshur R, et al. Fair allocation of scarce medical resources in the time of covid-19. N Engl J Med. 2020;382:2049-2055. [PMID: 32202722] doi:10.1056/NEJMsb2005114 [DOI] [PubMed]
- 10. Johns Hopkins inHealth. PMAP: The Johns Hopkins Precision Medicine Analytics Platform. Accessed at https://pm.jh.edu/ on 17 May 2020.
- 11. World Health Organization. WHO R&D Blueprint: novel coronavirus COVID-19 therapeutic trial synopsis. 18 February 2020. Accessed at www.who.int/blueprint/priority-diseases/key-action/COVID-19_Treatment_Trial_Design_Master_Protocol_synopsis_Final_18022020.pdf on 17 May 2020.
- 12. Charlson M, Szatrowski TP, Peterson J, et al. Validation of a combined comorbidity index. J Clin Epidemiol. 1994;47:1245-51. [PMID: 7722560] [DOI] [PubMed]
- 13. Deyo RA, Cherkin DC, Ciol MA. Adapting a clinical comorbidity index for use with ICD-9-CM administrative databases. J Clin Epidemiol. 1992;45:613-9. [PMID: 1607900] [DOI] [PubMed]
- 14. Little RJ. Missing-data adjustments in large surveys. J Bus Econ Stat. 1988;6:287-96.
- 15. van Buuren S, Groothuis-Oudshoorn K. mice: Multivariate imputation by chained equations in R. J Stat Softw. 2011;45:1-67.
- 16. White IR, Royston P. Imputing missing covariate values for the Cox model. Stat Med. 2009;28:1982-98. [PMID: 19452569] doi:10.1002/sim.3618 [DOI] [PMC free article] [PubMed]
- 17. Cox DR. Regression models and life-tables. In: Kotz S, Johnson NL, eds. Breakthroughs in Statistics: Methodology and Distribution. Springer New York; 1992:527-41.
- 18. Rubin DB. Multiple Imputation for Nonresponse in Surveys. vol 81. John Wiley and Sons; 2004.
- 19. Friedman J, Hastie T, Tibshirani R. Regularization paths for generalized linear models via coordinate descent. J Stat Softw. 2010;33:1-22. [PMID: 20808728] [PMC free article] [PubMed]
- 20. Wood AM, White IR, Royston P. How should variable selection be performed with multiply imputed data? Stat Med. 2008;27:3227-46. [PMID: 18203127] doi:10.1002/sim.3177 [DOI] [PubMed]
- 21. Gerds TA, Scheike TH, Andersen PK. Absolute risk regression for competing risks: interpretation, link functions, and prediction. Stat Med. 2012;31:3921-30. [PMID: 22865706] doi:10.1002/sim.5459 [DOI] [PMC free article] [PubMed]
- 22. Heagerty PJ, Zheng Y. Survival model predictive accuracy and ROC curves. Biometrics. 2005;61:92-105. [PMID: 15737082] [DOI] [PubMed]
- 23. R Foundation for Statistical Computing. The R Project for Statistical Computing. Accessed at www.r-project.org/ on 17 May 2020.
- 24. Zhou F, Yu T, Du R, et al. Clinical course and risk factors for mortality of adult inpatients with COVID-19 in Wuhan, China: a retrospective cohort study. Lancet. 2020;395:1054-1062. [PMID: 32171076] doi:10.1016/S0140-6736(20)30566-3 [DOI] [PMC free article] [PubMed]
- 25. Liang W, Liang H, Ou L, et al; China Medical Treatment Expert Group for COVID-19. Development and validation of a clinical risk score to predict the occurrence of critical illness in hospitalized patients with COVID-19. JAMA Intern Med. 2020;180:1081-1089. [PMID: 32396163] doi:10.1001/jamainternmed.2020.2033 [DOI] [PMC free article] [PubMed]
- 26. Docherty AB, Harrison EM, Green CA, et al; ISARIC4C investigators. Features of 20 133 UK patients in hospital with covid-19 using the ISARIC WHO Clinical Characterisation Protocol: prospective observational cohort study. BMJ. 2020;369:m1985. [PMID: 32444460] doi:10.1136/bmj.m1985 [DOI] [PMC free article] [PubMed]
- 27. Arons MM, Hatfield KM, Reddy SC, et al; Public Health–Seattle and King County and CDC COVID-19 Investigation Team. Presymptomatic SARS-CoV-2 infections and transmission in a skilled nursing facility. N Engl J Med. 2020;382:2081-2090. [PMID: 32329971] doi:10.1056/NEJMoa2008457 [DOI] [PMC free article] [PubMed]
- 28. Roxby AC, Greninger AL, Hatfield KM, et al. Outbreak investigation of COVID-19 among residents and staff of an independent and assisted living community for older adults in Seattle, Washington. JAMA Intern Med. 2020;180:1101-1105. [PMID: 32437547] doi:10.1001/jamainternmed.2020.2233 [DOI] [PMC free article] [PubMed]
- 29. Centers for Disease Control and Prevention. Long-term care providers and services users in the United States, 2015-2016. Accessed at www.cdc.gov/nchs/data/series/sr_03/sr03_43-508.pdf on 17 May 2020.
- 30. van Delden JJ, Löfmark R, Deliens L, et al; EURELD Consortium. Do-not-resuscitate decisions in six European countries. Crit Care Med. 2006;34:1686-90. [PMID: 16625128] [DOI] [PubMed]
- 31. Ong SWX, Young BE, Leo YS, et al. Association of higher body mass index (BMI) with severe coronavirus disease 2019 (COVID-19) in younger patients. Clin Infect Dis. 2020. [PMID: 32382755] doi:10.1093/cid/ciaa548 [DOI] [PMC free article] [PubMed]
- 32. Simonnet A, Chetboun M, Poissy J, et al; LICORN and the Lille COVID-19 and Obesity study group. High prevalence of obesity in severe acute respiratory syndrome coronavirus-2 (SARS-CoV-2) requiring invasive mechanical ventilation. Obesity (Silver Spring). 2020;28:1195-1199. [PMID: 32271993] doi:10.1002/oby.22831 [DOI] [PMC free article] [PubMed]
- 33. Cummings MJ, Baldwin MR, Abrams D, et al. Epidemiology, clinical course, and outcomes of critically ill adults with COVID-19 in New York City: a prospective cohort study. Lancet. 2020;395:1763-1770. [PMID: 32442528] doi:10.1016/S0140-6736(20)31189-2 [DOI] [PMC free article] [PubMed]
- 34. Anderson MR, Geleris J, Anderson DR, et al. Body mass index and risk for intubation or death in SARS-CoV-2 infection: a retrospective cohort study. Ann Intern Med. 2020. [PMID: 32726151] doi:10.7326/M20-3214 [DOI] [PMC free article] [PubMed]
- 35. Honce R, Schultz-Cherry S. Impact of obesity on influenza A virus pathogenesis, immune response, and evolution. Front Immunol. 2019;10:1071. [PMID: 31134099] doi:10.3389/fimmu.2019.01071 [DOI] [PMC free article] [PubMed]
- 36. Afshin A, Forouzanfar MH, Reitsma MB, et al; GBD 2015 Obesity Collaborators. Health effects of overweight and obesity in 195 countries over 25 years. N Engl J Med. 2017;377:13-27. [PMID: 28604169] doi:10.1056/NEJMoa1614362 [DOI] [PMC free article] [PubMed]
- 37. Hales CM, Carroll MD, Fryar CD, et al. Prevalence of obesity and severe obesity among adults: United States, 2017-2018. NCHS Data Brief. 2020:1-8. [PMID: 32487284] [PubMed]
- 38. Kass DA, Duggal P, Cingolani O. Obesity could shift severe COVID-19 disease to younger ages [Letter]. Lancet. 2020;395:1544-1545. [PMID: 32380044] doi:10.1016/S0140-6736(20)31024-2 [DOI] [PMC free article] [PubMed]
- 39. Bowen ME. The relationship between body weight, frailty, and the disablement process. J Gerontol B Psychol Sci Soc Sci. 2012;67:618-26. [PMID: 22967933] doi:10.1093/geronb/gbs067 [DOI] [PMC free article] [PubMed]
- 40. Knaus WA, Draper EA, Wagner DP, et al. APACHE II: a severity of disease classification system. Crit Care Med. 1985;13:818-29. [PMID: 3928249] [PubMed]
- 41. Vincent JL, Moreno R, Takala J, et al. The SOFA (sepsis-related organ failure assessment) score to describe organ dysfunction/failure. On behalf of the Working Group on Sepsis-Related Problems of the European Society of Intensive Care Medicine. Intensive Care Med. 1996;22:707-10. [PMID: 8844239] [DOI] [PubMed]
- 42. Royal College of Physicians. National Early Warning Score (NEWS) 2. Accessed at www.rcplondon.ac.uk/projects/outputs/national-early-warning-score-news-2 on 1 June 2020.
- 43. Du RH, Liang LR, Yang CQ, et al. Predictors of mortality for patients with COVID-19 pneumonia caused by SARS-CoV-2: a prospective cohort study. Eur Respir J. 2020;55. [PMID: 32269088] doi:10.1183/13993003.00524-2020 [DOI] [PMC free article] [PubMed]
- 44. Adams JY, Rogers AJ, Schuler A, et al. Association between peripheral blood oxygen saturation (SpO2)/Fraction of inspired oxygen (FiO2) ratio time at risk and hospital mortality in mechanically ventilated patients. Perm J. 2020;24. [PMID: 32069205] doi:10.7812/TPP/19.113 [DOI] [PMC free article] [PubMed]
- 45. Chen W, Janz DR, Shaver CM, et al. Clinical characteristics and outcomes are similar in ARDS diagnosed by oxygen Saturation/Fio2 ratio compared with Pao2/Fio2 ratio. Chest. 2015;148:1477-1483. [PMID: 26271028] doi:10.1378/chest.15-0169 [DOI] [PMC free article] [PubMed]
- 46. Grasselli G, Zangrillo A, Zanella A, et al; COVID-19 Lombardy ICU Network. Baseline characteristics and outcomes of 1591 patients infected with SARS-CoV-2 admitted to ICUs of the Lombardy region, Italy. JAMA. 2020;323:1574-1581. [PMID: 32250385] doi:10.1001/jama.2020.5394 [DOI] [PMC free article] [PubMed]
- 47. Beigel JH, Tomashek KM, Dodd LE, et al; ACTT-1 Study Group Members. Remdesivir for the treatment of covid-19 - preliminary report. N Engl J Med. 2020. [PMID: 32445440] doi:10.1056/NEJMoa2007764 [DOI] [PubMed]
- 48. U.S. Department of Health and Human Services. HHS selects nine regional Ebola and other special pathogen treatment centers. 12 June 2015. Accessed at https://wayback.archive-it.org/3926/20170128051101/https://www.hhs.gov/about/news/2015/06/12/hhs-selects-nine-regional-ebola-and-other-special-pathogen-treatment-centers.html on 25 May 2020.
- 49. Garibaldi BT, Kelen GD, Brower RG, et al. The creation of a biocontainment unit at a tertiary care hospital. The Johns Hopkins Medicine experience. Ann Am Thorac Soc. 2016;13:600-8. [PMID: 27057583] doi:10.1513/AnnalsATS.201509-587PS [DOI] [PubMed]
- 50. Xiao AT, Tong YX, Zhang S. False negative of RT-PCR and prolonged nucleic acid conversion in COVID-19: rather than recurrence [Letter]. J Med Virol. 2020. [PMID: 32270882] doi:10.1002/jmv.25855 [DOI] [PMC free article] [PubMed]
Associated Data
This section collects any data citations, data availability statements, or supplementary materials included in this article.