

Abstract

The aim of the current study was to investigate whether degradation of rapeseed meal (RSM) by a swine gut microbiota consortium was improved by modifying RSM by treatment with cellulase (CELL), two pectinases (PECT), or alkaline (ALK) compared to untreated RSM and to assess whether microbiota composition and activity changed. The predicted relative abundances of carbohydrate digestion and absorption, glycolysis, pentose phosphate pathway, and pyruvate metabolism were significantly increased upon CELL and ALK feeding, and CELL and ALK also exhibited increased total short-chain fatty acid (SCFA) production compared to CON. Megasphaera, Prevotella, and Desulfovibrio were significantly positively correlated with SCFA production. Findings were validated in ileal cannulated pigs, which showed that CELL and ALK increased fiber degradation of RSM. In conclusion, CELL and ALK rather than PECT1 or PECT2 increased fiber degradation in RSM, and this information could guide feed additive strategies to improve efficiency and productivity in the swine industry.
Keywords: rapeseed meal, pig gut microbiota, polysaccharides, carbohydrase, cell wall
Introduction
The European Union (EU) is highly dependent on imports of protein-rich animal feed ingredients (70%). This percentage is even higher when the focus is on soybean alone as the EU imports 95% of its demand or on average 36.1 million tons of soybean equivalent on a yearly basis.1 Of these, 9 million tons of soybean meal are annually used in pig production. For a more sustainable supply of responsible protein-rich feed ingredients, the European livestock sector needs an alternative local protein feed ingredient to fill the “protein gap”.
Rapeseed meal (RSM), a byproduct from rapeseed oil production, is not only a suitable protein source for swine feed but also a potential energy source. RSM contains a high amount of cell wall polysaccharides, and the levels are even higher compared to soybean meal commonly used in the feed industry.2 Nonstarch polysaccharides (NSP) constitute 20 to 40% of RSM3−5 and include pectic polysaccharides (homogalacturonan, rhamnogalacturonan, arabinogalactan, and arabinan), cellulose, and hemicelluloses (xyloglucan, galactomannan, and glucuronoxylan).6,7 A limitation of RSM is that complex cell wall polysaccharides cannot be utilized by endogenous enzymes from monogastric animals and can only partly be fermented by the microbial community in the gastrointestinal tract (GIT). Reports show that only 3–6% of NSP is degraded by chickens,4,8,9 and approximately 58–68% is degraded in pigs, which is rather low compared to other NSP-rich feed ingredients, such as sugar beet pulp (approximately 85% of NSP is degraded by pigs).10 Thus, RSM should be pretreated to improve its digestibility and fermentability. Carbohydrases, e.g., β-glucanases, xylanases, cellulases, and/or pectinases, are commonly used in poultry feed; however, fewer feed enzymes are used in pig diets to increase fiber degradation.
Meanwhile, the intestinal microbiota plays a critical role in host nutrition, health, performance and quality of meat products given that the microbiota in the GIT can degrade undigested substrates and create SCFA and oligosaccharides from cell wall NSP, which act as an additional energy source and exhibit potential prebiotic effects, respectively.11 The chemical composition and structure of the substrates largely determine the (changes in) microbial composition of the bacterial community in the GIT given that microbes exhibit differences in substrate preferences (degradation capacity) and growth requirements.12,13 As a result, microbial composition and metabolic function are very much dependent on biochemical conditions of digesta. Previous research showed that supplementation with NSP-degrading enzymes (endo-(1-3),(1-4)-β-glucanase and endo-(1-4)-β-xylanase) in weaned piglets led to a shift in dominating bacteria.14 Pigs fed with multicarbohydrase enzyme [pectinase and (hemi)cellulase]-supplemented diets exhibited increased lactobacilli counts compared to unsupplemented diets.15 Carbohydrase supplementation modulates gut microbiota in a limited number of studies in both animal and in vitro models.16−18
In the current study, RSM (predigested with digestive enzymes) was treated independently with two types of pectinases (PECT1 and PECT2), one cellulase (CELL), or alkaline (ALK). Afterward, the untreated and treated RSM preparations were fermented in the swine large intestine in vitro model (SLIM)19 and in vivo (in ileal cannulated pigs). We hypothesized that (1) carbohydrase increases NSP degradability of RSM and (2) feed enzyme-treated RSM differentially affects pig gut microbiota composition and thus the predicted microbial functional profile and potential energy yield of the substrate. Here, 16S rRNA gene sequencing technology was used to monitor the microbial communities. The results of the current study provide insight into how carbohydrases affect swine gut microbiota, which is important information to exploit for (new) feed enzymes.
Materials and Methods
Substrate Preparation
Rapeseed meal (Brassica napus, Cargill N.V., Antwerp, Belgium) was obtained from a commercial feed mill (Agrifirm B.V., Utrecht, The Netherlands). Preparation method I (predigestion of RSM after carbohydrase or alkaline treatment) [Figure 1] was as follows: to 200 g of RSM, 40 mL 10× gastric electrolyte concentrate solution (GES, 310 g sodium chloride, 110 g potassium chloride, 15 g calcium chloride dihydrate, and 4840 g ultrapure water) and 360 mL ultrapure water were added. The pH was adjusted to 5.5 or not adjusted (CON). Then, 10 mL of alkaline solution (ALK, 6 M NaOH) or the following carbohydrases were added: CELL (Accellerase 1000, Sigma-Aldrich, Missouri), PECT1 (Pectinex Ultra SP, Novozymes A/S, Bagsvaerd, Denmark), or PECT2 (Multifect Pectinase, DuPont Industrial Biosciences, Genencor division, Rochester, NY). Enzyme/substrate mixtures were incubated at 37 °C for 2 h with occasional shaking (every 30 min), whereas ALK was incubated overnight at 4 °C. Enzyme/substrate mixtures were then heated at 100 °C for 5 min to inactivate enzymes. For all treatments, pH was neutralized to 6.5–7 with HCl or NaOH. Afterward, for all five samples, 120 mL of GES was added, and the pH was adjusted to 3 to continue with the gastric incubation according to the predigestion protocol as described elsewhere.20 After predigestion, the slurry was centrifuged (8 000g, 4 °C, 20 min), and dialysis was performed for the supernatants. For dialysis, a dialyzer (Sureflux, Nipro Europe Group Companies, Mechelen, Belgium) was used with a peristaltic pump to remove small digestion products and water. After reduction of the total volume to ∼450–500 mL, supernatant was mixed with the pellet. For method II (digestion of RSM before carbohydrase or alkaline treatment) [Figure 1], four quantities of 200 g of RSM were predigested as described above and then dialyzed. Afterward, 55 mL of 10× GES was added, and the pH was adjusted to 5.5. Then, 10 mL of CELL, PECT1, PECT2, or ALK treatment were added. Enzyme/substrate mixtures were incubated at 37 °C for 2 h with occasional shaking (every 30 min), and ALK was incubated overnight at 4 °C. Afterward, the enzyme/substrate mixtures were heated at 100 °C for 5 min to inactivate the enzymes, and the pH was neutralized to 6.5–7 with HCl or NaOH. Samples from both methods I and II were subsequently freeze-dried. Samples are differentiated by the suffix B (for before) or _A (for after) (e.g., PECT1_A) for carbohydrase or ALK treatment prior to and after digestion, respectively.
Figure 1.

Schematic of the experimental design.
Fermentation in the Swine In Vitro Large Intestinal Model (SLIM)
The SLIM setup was previously described (Long et al., 2020).19 Briefly, a completely computer-controlled in vitro model was used to mimic the swine large intestine. The pH (5.9) was controlled by the addition of 2 M sodium hydroxide. Standard ileal efflux medium of pigs (SIEMP) was used to simulate the materials entering the colon.19 SIEMP and dialysate solution are described in detail in Long et al.19 Briefly, the SIEMP, which is slightly modified from Gibson et al.21 and described in Maathuis et al.,22 contained the following components (g/L): 74.6 maize starch, 9.0 xylan, 9.0 pectin, 9.0 amylopectin, 9.0 arabinogalactan, 9.0 arabinoxylan, 9.0 xyloglucan, 31.5 Tween 80, 43.7 casein, 0.7 ox-bile, 43.7 bactopepton, 4.7 K2HPO4·3H2O, 0.009 FeSO4·7H2O, 8.4 NaCl, 0.8 CaCl2·2H2O, 0.7 MgSO4·H2O, 0.05 bile, 0.02 heme and 0.3 cysteine·HCl plus 1.5 mL of a vitamin mixture containing (per liter) 1 mg of menadione, 0.5 mg of vitamin B12, 2 mg of D-biotin, 10 mg of pantothenate, 5 mg of p-aminobenzoic acid, 4 mg of thiamine, and 5 mg of nicotinamide acid. The pH was adjusted to 5.9. Dialysis liquid contained (per liter) 2.5 g of K2HPO4·3H2O, 0.005 g of FeSO4·7H2O, 4.5 g of NaCl, 0.45 g of CaCl2·2H2O, 0.05 g of bile, 0.5 g of MgSO4·7H2O, and 0.4 g of cysteine·HCl plus 1 mL of the vitamin mixture. All medium components were purchased at Tritium Microbiology (Eindhoven, The Netherlands). The pig fecal inoculum was a standardized microbiota from growing pigs collected from the floor (48 pens with 6 pigs/pen, Hypor Libra x Hypor Maxter, Hendrix Genetics, Boxmeer, The Netherlands), but only fresh feces from the top (not touching the floor) was selected. Feces were pooled and mixed with dialysate as described previously.19
To create a complete anaerobic environment, SLIM with 90 mL of dialysate in each of the 4 individual units was flushed with gaseous nitrogen for at least 3 h before incorporating the standardized microbiota. A volume of 30 mL of the standardized microbiota was added to each SLIM-unit, making the total volume 120 mL. Figure 1 shows the experimental setup for fiber addition to SLIM. The microbiota were adapted to the model with SIEMP for 16 h. During the adaptation phase, SIEMP was added into each SLIM unit at a rate of 2.5 mL/h through the feeding syringe. At the end of the adaptation period, a 2-h starving period was employed to allow all the carbohydrates within SIEMP to be fermented by the microbiota. Afterward, the fiber adjustment period (48 h) was implemented, in which the microbiota were allowed to adapt to the test products (CON, CELL, PECT1, PECT2, and ALK-treated RSM). During this stage, carbohydrates in SIEMP were replaced with 7.5 g/day of (treated) RSM, which were added continuously in the model at a rate of 2.5 mL/h. At the end of the 48-h adaptation period, a shot of 5 g of the different RSMs was given to the system, at time point 48 h.
In Vivo Fermentation in Growing Pigs Using the Mobile Nylon Bag Technique
Mobile nylon bag technique (MNBT) studies were performed at the Animal Nutrition Group of Wageningen University & Research in Wageningen, The Netherlands. Two pigs (TN 70, Topigs Norsvin) with initial body weights of 28 ± 6.8 kg were fitted with a simple T-cannula at the distal ileum23 for the insertion of nylon bags. After surgery, the pigs were individually housed on tenderfeet floors with small openings. The pigs were fed their diet as mash. All experimental procedures were approved by the local institution for animal welfare (IVD) of Wageningen University & Research.
MNBT studies included the nine feedstuffs, which are described above (CON, 4 RSM substrates treated with carbohydrases or ALK before digestion, and 4 RSM substrates treated with carbohydrases or ALK after digestion). The procedures were slightly modified from previous research.24 Briefly, 0.3–0.5 g samples of each feedstuff were ground and filled into a nylon cloth (bag size, 25 mm × 40 mm, pore size 48 μm, Sefar Nitex, Heiden Swiss, 03-37/24) and sealed using a heat sealer. Eight bags per feedstuff were prepared (4 bags for 2 pigs). The bags were inserted in the distal ileum through the cannula divided over 10 days (two bags at a time with two or three insertion moments at 15 min intervals per day). Some bags were not collected, and these replicates were repeated. The average collection time was 126.1 min (range from 42.3 to 175.5 min). In total, 64 bags were retrieved from feces and directly frozen at −20 °C before transporting to the laboratory. Bags were subsequently cleaned from adherent feces using ultrapure water and thereafter immediately freeze-dried.
Sample Collection
In Vitro SLIM
Lumen samples from time point 48 h (just before the shot) were analyzed for constituent monosaccharide composition, molecular weight distribution, and oligosaccharide profiling. Samples from lumen and spent dialysate were collected at the following time point: 48.5, 49, 50, 52, 54, 56, and 72 h. Samples were snap-frozen in liquid nitrogen and stored until analyses. Lumen samples were used to analyze microbiota composition, constituent monosaccharide composition, molecular weight distribution, and oligosaccharide profiling, while both lumen and dialysis samples were subject to SCFA concentration analyses.
MNBT Study
Samples from MNBT studies were pooled together according to treatment and used to analyze constituent monosaccharide composition.
16S rRNA Gene Sequencing
Microbial DNA extraction and sequencing of the V3–V4 region of the 16S rRNA gene were performed by BaseClear B.V. (Leiden, The Netherlands). Briefly, genomic DNA extraction from a single sample at each time point was performed using the Quick-DNA Fecal/Soil Microbe Miniprep Kit (Zymo Research, California) according to the manufacturer’s instructions. Barcoded amplicons from the V3–V4 region of 16S rRNA genes were generated using a 2-step PCR. Briefly, 10–25 ng of genomic DNA was used as a template for the first PCR with a total volume of 50 μL using the 341F (5′-CCTACGGGNGGCWGCAG-3′) and the 785R (5′-GACTACHVGGGTATCTAATCC-3′) primers25 appended with Illumina adaptor sequences. The plate was sealed, and PCR was performed in a thermal cycler using the following program: 95 °C for 3 min; 25 cycles of 95 °C for 30 s, 55 °C for 30 s, and 72 °C for 30 s; 72 °C for 5 min; held at 4 °C. PCR products were purified (QIAquick PCR Purification Kit, Qiagen, Venlo, The Netherlands), and the sizes of the PCR products were assessed on a fragment analyzer (Advanced Analytical, Ankeny, U.S.) and quantified by fluorometric analysis. Purified PCR products were used for the second PCR in combination with sample-specific barcoded primers (Nextera XT index kit, Illumina, California). Subsequently, PCR products were purified, assessed on a fragment analyzer and quantified. Then, products were subject to multiplexing, clustering, and sequencing on an Illumina MiSeq with the paired-end (2×) 300-bp protocol and indexing by Baseclear B.V. (Leiden, The Netherlands). Sequencing was conducted using 2× 300 cycle MiSeq v3 reagent kits (Illumina, San Diego, CA). The sequencing run was analyzed using the Illumina CASAVA pipeline (v1.8.3) with demultiplexing based on sample-specific barcodes. Raw sequencing data were submitted to the European Nucleotide Archive (https://www.ebi.ac.uk/ena) under accession number PRJEB36980.
Bioinformatics Analysis
The demultiplexed raw sequences obtained from BaseClear were processed using QIIME2 pipeline.26 In short, reads were imported, quality filtered, and dereplicated with q2-dada2.27 Next, dada2 was performed with paired-end reads, and the truncation parameters were as follows: the first 10 base pairs were trimmed off, and the fragment was truncated at position 280 base pairs in forward reads and at position 240 base pairs for the reverse reads. The processed sequences were used for all the downstream analyses. Alpha-diversity (Shannon index) and beta diversity (weighted and unweighted UniFrac) were analyzed using the q2-phylogeny plugin (https://github.com/qiime2/q2-diversity). All scripts used in the current analysis were deposited in the Supporting Infomation (R_Markdown.html).
Random Forest
The Random Forest supervised machine learning algorithm was used to predict treatments and time points from microbiome composition. The predictive models were built in R using the “caret” package. Specifically, samples were divided into training (greater than 60% of the total samples) and test sets. Once the data were split, the function “train” was used to fit the random forest model. Afterward, class labels on the test set were predicted using the function “predict” and compared to the real class labels. To interpret random forest results, proximity plots were produced in R. To understand more about the random forest model, the amplicon sequence variant (ASV) with the most influence in the random forest prediction was identified. All the analyses were performed using the R version 3.5.3 program, and the following packages were used: bioformat, yaml, Biostrings, phyloseq, Hmisc, qiime2R, vegan, ggplot2, tidyverse, caret, and randomForest.
Phylogenetic Investigation of Communities by Reconstruction of Unobserved States (PICRUSt2)
PICRUSt2 software28 was used to predict microbial functional abundances based on marker gene sequences. The nearest-sequenced taxon index (NSTI) was calculated for each input ASV; by default, any ASVs with NSTI > 2 were excluded from the output.28 The KEGG database was used to predict the results. Functional predictions were assigned to KO tier 3 for all genes.
Chemical Analyses
Short-Chain Fatty Acids
Samples from lumen and dialysate were analyzed by Brightlabs (Venlo, The Netherlands) for determination of SCFA concentrations. Ion exclusion chromatography (IEC) was applied on an 883 ion chromatograph (IC; Metrohm, Switzerland) using a Transgenomic IC Sep ICE-ION-300 column (30 cm length, 7.8 mm diameter, and 7 μm particles) and a MetroSep RP2 Guard. The mobile phase consists of 1.5 mM aqueous sulfuric acid. A column flow rate of 0.4 mL min–1 was used. The temperature of the column was 65 °C. Organic acids were detected using suppressed conductivity detection. Samples were centrifuged (21 000g, 10 min), and the clear supernatant was filtered through a 0.45-μm PFTE filter and diluted with the mobile phase (for lumen 1:5, for dialysate 1:2). A volume of 10 μL was loaded on the column using an autosampler 730 (Metrohm, Herisau, Switzerland). Molecules were eluted according to their pKa.
Constituent Monosaccharide Composition
Constituent monosaccharide content and composition were determined using a prehydrolysis step with 72% (w/w%) sulfuric acid at 30 °C for 1 h followed by hydrolysis with 1 M sulfuric acid at 100 °C for 3 h. The monosaccharides formed upon hydrolysis were derivatized to alditol acetates and analyzed by gas chromatography using inositol as the internal standard.29 The colorimetric m-hydroxydiphenyl assay was used to determine the total uronic acid content.30
Molecular Weight Distribution
Fermentation digests (corresponding to 2 mL lumen samples) or dry raw materials, which were dissolved in ultrapure water, were centrifuged (10 min, 18 000g, 24 °C) to obtain the soluble fraction, which was analyzed for molecular weight distribution using high-performance size exclusion chromatography (HPSEC) on an Ultimate 3000 HPLC (Dionex, Sunnyvale, CA). Three SK-Gel columns in series (4000–3000–2500 Super AW; 150 mm × 6 mm) were used for the analysis. All columns were from Tosoh Bioscience (Tokyo, Japan). Pullulan molecular mass standards (Polymer Laboratories,, Palo Alto, CA) were used for calibration.31
Oligosaccharide Profiling
High-performance anion exchange chromatography (HPAEC) was performed on an ICS5000 system (Dionex) equipped with a Dionex CarboPac PA-1 column (2 mm × 250 mm) in combination with a CarboPac PA-1 guard column (2 mm × 250 mm). The flow rate was 0.3 mL/min with an eluent profile starting with 0.02 M NaOH until 13 min and then increasing to 0.1 M NaOH until 15 min followed by a linear gradient of 0–500 mM NaOAc in 0.1 M NaOH until 45 min and a gradient to 1 M NaOAc in 0.1 M NaOH in 1 and 7 min at 1 M NaOAc in 0.1 M NaOH. Then, the column was equilibrated with 0.1 M NaOH for 3 min and 0.02 M NaOH for 20 min. An ICS5000ED (Dionex) pulsed amperometric detector and Chromeleon software version 7 were used. Oligomers of cellulose (DP 2-DP 6) were used as standards to identify cellulose oligomers in the elution profile.
Statistics
Kruskal–Wallis rank sum tests were applied to compare alpha diversities (Shannon index and Faith’s PD) among different RSM treatments, and Wilcoxon rank sum tests were used for pairwise comparison in R version 3.5.3 (https://www.r-project.org/). Bonferroni adjustments were used to correct P-values for multiple comparisons. Permutational multivariate analysis of variance (PERMANOVA) was performed to test the significance of beta diversity (weighted and unweighted UniFrac) between nonprocessed and processed RSM in QIIME2. The results were visualized in R.
The ASV table (feature table of QIIME2) was normalized and filtered in R, and statistical analysis was performed using STAMP.32 The table was normalized via division by the sum of sequences in a given sample and multiplied by the minimum sum across all samples. Relative abundances were filtered as follows: values below a relative abundance threshold of 0.01% were not taken into account; taxa with a median relative abundance <1% in all groups were not considered for statistical analysis. White’s nonparametric t test was applied to comparisons between the CON group and treatments. P-values were corrected using the Benjamini–Hochberg method. A q-value (corrected P-value) < 0.05 was considered significant.
Spearman correlations between continuous meta-variables and taxonomic variables were calculated and visualized in R (R version 3.5.3). Parameters were set as follows: missing values for meta-variables were handled as NO imputation (replacing missing data with substituted); zeros were retained for the calculation of correlation; a minimum number of 0.1% was considered for calculation; a minimum of 4 paired observations were required for calculation of correlations.
t tests were conducted to compare SCFA production between CON and the treated RSM substrates in the built-in R package (R version 3.5.3).
Results
Description and Characteristics of Untreated and Processed RSM
Table 1 shows the constituent monosaccharide composition of (processed) RSM. The carbohydrate content of CON is 62% w/w. Dominant sugars include glucose (Glc, 31 mol %), uronic acid (UA, 19 mol %), arabinose (Ara, 25 mol %), and galactose (Gal, 11 mol %). CON contained 56% pectin (defined as rhamnose + arabinose + galactose + uronic acid) and 44% (hemi)cellulose (xylose + mannose + fucose + glucose). The values of pectin and (hemi)cellulose for ALK_A, ALK_B, PECT1_A, PECT1_B, PECT2_A, PECT2_B, CELL_A, and CELL_B were 55% and 45%, 52% and 48%, 54% and 46%, 50% and 50%, 56% and 44%, 51% and 49%, 57% and 43%, and 60% and 40%, respectively. Relative pectin contents decreased with ALK, PECT1, and PECT2 treatments but increased with CELL treatment compared to CON. ALK, PECT1, and PECT2 treatment increased (hemi)cellulose values compared to CON. Predigesting before or after processing RSM had minimal effects on monosaccharide levels.
Table 1. Constituent Monosaccharide Composition of Processed RSMa.
| (mol %) |
(w/w%) | ||||||||
|---|---|---|---|---|---|---|---|---|---|
| Rha | Fuc | Ara | Xyl | Man | Gal | Glc | UA | total | |
| CON | 1 | 1 | 25 | 10 | 2 | 11 | 31 | 19 | 62 |
| ALK_A | 1 | 1 | 23 | 9 | 3 | 11 | 35 | 17 | 58 |
| ALK_B | 1 | 1 | 26 | 9 | 2 | 8 | 32 | 21 | 52 |
| PECT1_A | 1 | 1 | 26 | 9 | 2 | 14 | 37 | 9 | 61 |
| PECT1_B | 1 | 1 | 22 | 8 | 2 | 10 | 34 | 21 | 53 |
| PECT2_A | 1 | 1 | 16 | 8 | 3 | 11 | 37 | 22 | 63 |
| PECT2_B | 1 | 1 | 23 | 9 | 3 | 11 | 31 | 21 | 57 |
| CELL_A | 1 | 1 | 24 | 9 | 2 | 11 | 28 | 23 | 63 |
| CELL_B | 1 | 1 | 24 | 9 | 3 | 10 | 30 | 23 | 56 |
Rha, rhamnose; Fuc, fucose; Ara, arabinose; Xyl, xylose; Man, mannose; Gal, galactose, Glc, glucose; UA, Uronic acid. _A, RSM was treated after predigesting, _B, RSM was treated before predigesting.
Considerable Changes Occurred in the Microbiota Fed with ALK- and CELL-Processed RSM after a Shot of 5 g of Test Products
Changes in the gut microbiota in response to a shot of 5 g of the different treated RSM substrates were determined. When data from all of the time points were pooled, Shannon indexes of ALK and CELL were significantly lower than CON, whereas PECT1 and PECT2 did not significantly differ compared to CON (Figure 2). Different time points did not exhibit significant difference in terms of the Shannon index (Figure S1). Phylogeny-based UniFrac distance matrix measurements were then used to compare the β-diversity of the microbial communities between microbiota fed nonprocessed and processed RSM. Unweighted UniFrac, which is clustering data based on presence or absence of ASV, clustered the nonprocessed and processed RSMs samples separately (P < 0.001). No clear separation was noted between CON and PECT1 and between CON and PECT2 in terms of weighted UniFrac metrics (P > 0.05), which also considers the relative abundance of the ASV. In contrast, CON significantly differed from ALK and CELL (P < 0.001) (Figure 3 and Figure S2). Both weighted and unweighted UniFrac revealed that the bacterial community structure of CON was more similar to PECT1 and PECT2 compared with ALK and CELL, whereas microbial community compositions of PECT1 and PECT2 were similar to each other (Pweighted UniFrac = 0.131, Punweighted Unifrac = 0.078) (Figure S2).
Figure 2.
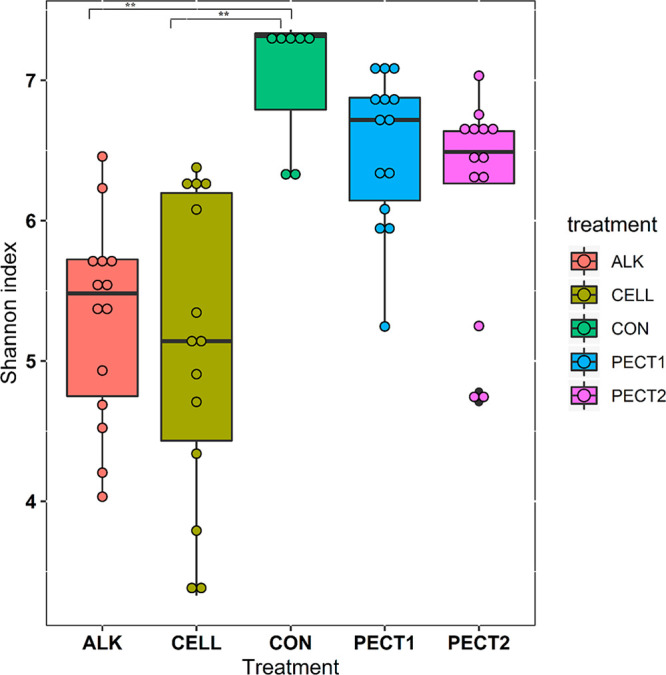
Community diversity represented by Shannon index values at the ASV level for samples from each treatment. The Shannon index was calculated based on the average of 10 iterations at an equal sampling depth of 7139 for each sample. Each bar represents the samples from the microbiota fed nonprocessed RSM (CON) and RSM processed by Accellerase 1000 (CELL), Pectinex Ultra SP (PECT1), Multifect Pectinase (PECT2), or 6 M NaOH (ALK).
Figure 3.

Principle coordinate analysis (PCoA) plot generated based on the calculated distances in the unweighted matrix. Samples were grouped by shape and color in terms of treatment and time point, respectively: nonprocessed RSM (CON), square; RSM processed by 6 M NaOH (ALK), circle; RSM processed by Pectinex Ultra SP (PECT1), +; RSM processed by Multifect Pectinase (PECT2), square with cross inside; RSM processed by Accellerase 1000 (CELL), triangle; a red-green-purple scale was used to indicate the fermentation time (red and purple depict the start and end of the fermentation period).
We next compared the relative microbial abundance of the CON group compared with groups fed different processed RSMs to identify significantly different bacterial taxa. Data from all time points were grouped. No significant differences were detected at the phylum level when comparing CON to the other groups (ALK, PECT1, PECT2 and CELL) (data not shown). At the genus level, when compared to CON, ALK treatment resulted in significantly increased relative abundance of Olsenella (P = 0.017), Runimicoccus gauvreauii group (P = 0.019), Eubacterium nodatum group (P < 0.001), Megasphaera (P < 0.001), Bifidobacterium (P < 0.001), Acidaminococcus (P < 0.001), and Acetitomaculum (P < 0.001), which represent the phyla Actinobacteria and Firmicutes. In addition, ALK treatment significantly decreased the relative abundance of Ruminococcaceae UCG-002 (P < 0.001), Christensenellaceae R-7 group (P < 0.001), Enterobacteriaceae unknown group (P < 0.001), p-2534–18B5 gut group from the order Bacteroidales (P < 0.001), Citrobacter (P < 0.001), Prevotella 9 (P = 0.004), Rikenellaceae RC9 gut group (P = 0.006), Desulfovibrio (P = 0.007), Prevotellaceae NK3B31 group (P = 0.030), and Lachnoclostridium (P = 0.031), representing the phyla Bacteroidetes, Firmicutes, and Proteobacteria (Figure 4 and Figure S3).
Figure 4.

Significantly different relative abundances of microbial genera in the different treatment groups compared to CON. White’s nonparametric t test was applied to comparisons between the CON group and treatments. P-values were corrected using the Benjamini–Hochberg method (q-values). The mean relative abundance percentages of the taxa are presented and were calculated using all samples obtained over time within each treatment.
PECT2 treatment significantly decreased the relative frequencies of the Enterobacteriaceae unknown group (P < 0.001) and Christensenellaceae R-7 group (P < 0.001) compared with the CON group (Figure 4). No significant differences were noted at the genus level between the CON group and the PECT1 treatment group.
Relative abundance of Olsenella (P < 0.001), Eubacterium nodatum group (P < 0.001), Acidaminococcus (P < 0.001), Lachnospiraceae NK3A20 group (P < 0.001), Bifidobacterium (P < 0.001), Acetitomaculum (P = 0.014), and Syntrophococcus (P = 0.016) from the phyla Actinobacteria and Firmicutes significantly increased in microbiota fed CELL-processed RSM. Moreover, CELL treatment decreased the relative abundance of Ruminococcaceae UCG-002, Christensenellaceae R-7 group, the p-2534-18B5 gut group from the order Bacteroidales, Rikenellaceae RC9 gut group, and Succiniclasticum, representing Firmicutes and Bacteroidetes (Figure 4 and Figure S3).
ALK and CELL Significantly Increased Microbial Functional Abundance Related to Fiber Degradation and SCFA Production Compared to CON
PICRUST2 was performed using 16S rRNA gene data to predict metagenomic functional profiles. Compared with CON, 111 features were significantly different in ALK, 108 features in CELL, 2 features in PECT1, and 1 feature in PECT2 (Figure S3). Given that the current study focused on fiber degradation, only carbohydrate metabolism-related microbial functional features are summarized. The relative abundances of carbohydrate digestion and absorption (P = 0.047), galactose metabolism (P = 0.008), glycolysis (P = 0.001), pentose phosphate pathway (P = 0.004), propanoate metabolism (P < 0.001), and pyruvate metabolism (P < 0.001) were predicted to be significantly increased upon ALK feeding, whereas glycan biosynthesis and metabolism (P = 0.005) and lipopolysaccharide biosynthesis (P = 0.005) were significant increased in CON (Figure 5A). After the microbiota were fed CELL, the abundance of microbial functions involved in carbohydrate digestion and absorption (P = 0.019), energy metabolism (P = 0.018), fructose mannose metabolism (P = 0.020), galactose metabolism (P = 0.010), glycerolipid metabolism (P < 0.001), glycolysis (P < 0.001), pentose phosphate pathway (P = 0.004), and pyruvate metabolism (P = 0.001) significantly increased (Figure 5B). No significant changes in carbohydrate metabolism-related microbial abundance upon feeding PECT1 or PECT2 were noted compared to CON.
Figure 5.

Relative abundance of significantly different metagenomic functions in ALK (A) and CELL (B) treatments compared to CON. Differences in short-chain fatty acid production (C) during fermentation of ALK, PECT1, PECT2, and CELL compared to CON.
Cumulative short-chain fatty acid production by microbiota fed CON was compared with that by microbiota fed ALK, PECT1, PECT2, or CELL. The amount of propionic acid (PALK = 0.010, PCELL = 0.006) and the total SCFA (PALK = 0.008, PCELL = 0.015) in the ALK and CELL groups were significantly increased compared with the CON group, whereas no significant differences in SCFA production in PECT1 and PECT2 were noted compared with CON (Figure 5C).
Random Forest Revealed an RSM Degradation Pattern in Porcine Gut Microbiota
The supervised machine learning technique Random Forest was applied to predict fermentation time. Every possible time interval was used {e.g., (48, 49] (49, 72], (48, 50](50, 72], (48, 52] (52, 72], (48, 54] (54, 72], and (48, 56] (56, 72]}, but only the time interval (48, 52] (52, 72] performed well in the prediction task (Table S1). The Random Forest proximity plot shows that samples from time point 48.5 to 52 were clustered (Figure 6A). This finding indicated that microbiota composition considerably changed only after incubation for 4 h after a shot of 5 g of treated RSM, which potentially occurred because the nutrient composition in the lumen significantly changed. To further understand the Random Forest model, the ASV with the most influence in the Random Forest prediction was identified as a genus in the family Veillonellaceae: Megasphaera (Figure 6B). Megasphaera was also significantly increased in ALK based on White's nonparametric t test (Figure 4).
Figure 6.

Random Forest proximity plots of time points (A) and treatments (C), and the ASV with the most influence in the Random Forest prediction (B for time points, D for treatments). To generate this representation, the distance between samples was based on how frequently samples occur in the same tree partition in the Random Forest bootstrapping procedure. If a pair of samples frequently occurred in the same partition, the pair was assigned a low distance. The resulting distances are then input to the PCA.
Interestingly, the effect on the microbiota composition of the different processing methods on RSM was also predicted by Random Forest. Table S2 shows that Random Forest performed well at this prediction task, and the Random Forest proximity plot demonstrates that microbiota fed CON was more similar to PECT1 and PECT2 than ALK and CELL (Figure 6C). The Ruminococcaceae UCG-002 genus from the family Ruminococcaceae most influenced the classification based on the different processing methods (Figure 6D).
HPSEC Elution Profiles Showed Almost Complete Degradation of Soluble High-Molecular Weight Polysaccharides at 52 h
Molecular weight distributions of soluble fibers from RSM with different processing methods are shown in Figure S5. For ALK, PECT1, PECT2, and CELL fermentation, an increase in the amount of soluble materials corresponding to high molecular weight (Mw) polysaccharides was observed 2, 1, 1, and 1 h after the shot (at time points 50 or 49 h), respectively. However, for CON, the increase in soluble materials with high Mw was observed after 0.5 h of incubation (at time point 48.5 h). High Mw material was observed before the shot of 5 g of RSM (at time point 48), indicating that the starvation period did not lead to complete fermentation of the fibers as previously observed.33 However, these materials were degraded rapidly after 0.5 h (at time point 48.5 h) since the peaks of 48.5 h were lower than those at 48 h, which is noted in the HPSEC profiles of ALK, PECT1, PECT2, and CELL. From 4 h onward (at time point 52 h), an almost complete disappearance in the high Mw fraction occurred, indicating degradation and/or utilization of all high Mw polysaccharides.
Compared to the highest peak of the elution profile of CON (48.5 h), the highest peaks of the elution profiles of ALK and CELL (50 and 49 h, respectively) exhibited increased levels of high Mw material, whereas the highest peaks of the elution profiles of PECT1 and PECT2 were approximately equal to CON (Figure S5). This finding indicated that more materials were solubilized in the ALK and CELL groups compared with the other substrates.
HPAEC Elution Profiles Indicate That a Large Amount of Soluble Oligo-Celluloses Formed during ALK and CELL Fermentation
To determine oligomers formed and utilized during fermentation of processed versus nonprocessed RSM, soluble fractions from fermentation digests were analyzed using HPAEC (Figure S6). For ALK and CELL, a few peaks can be identified as oligomers of cellulose based on standard cellulose oligomers as indicated in Figure S6 (cellobiose, cellotriose, cellotetraose, cellopentaose, and cellohexaose). However, most of the peaks in ALK and CELL fermentation samples were not identifiable based on the cellulodextrin standard. These oligomers are only present upon ALK and CELL feeding and were not observed with PECT1, PECT2, and CON. Oligomer levels increased to the highest levels 0.5 h after the addition of the 5-g shot (time point 48.5 h) and decreased to levels indicative of approximately complete fermentation after 8 h (time point 56 h). No pectin oligomers were observed in both enzymatical and chemical treatment groups.
Constituent Monosaccharide Composition of Fermentation Samples Showed That Less Residual Carbohydrates Remained in ALK and CELL Compared to CON
Direct utilization of polysaccharides during RSM fermentation is indicated by a reduction in carbohydrate content. Figure 7 shows the utilization of the main monosaccharides in RSM, which include arabinose, galactose, glucose, and uronic acid. Main monosaccharide levels were lower after 24-h fermentation (at time point 72) for ALK and CELL compared to CON. The utilization of the main monosaccharides plateaued after time point 52 h with the exception of glucose, which was continuously utilized until time point 72 h. Arabinose and galactose were more rapidly utilized in ALK and PECT1 compared to the other treatments.
Figure 7.

Utilization of arabinose (Ara), galactose (Gal), glucose (Glc), and uronic acid (UA) present in CON (A), ALK (B), PECT1 (C), PECT2 (D), and CELL (E) during in vitro fermentation. Values presented are means of duplicate measurements.
Correlation between Microbiota Abundance and SCFA Production and Monosaccharide Composition
Correlations among the relative abundances at the genus level, SCFA production and monosaccharide composition (mg/mL sugar left) at each time point were analyzed (Figure 8). Bifidobacterium, [Eubacterium] nodatum group, and Acidaminococcus exhibited significant negative correlations with acetic and butyric acid, whereas Prevotella 7 and Megasphaera exhibited significant positive correlations with acetic, propionic, and butyric acid. Butyric acid was significantly positively correlated with the Prevotellaceae NK3B31 group and Desulfovibrio.
Figure 8.

Correlation between core bacterial genera and SCFA production and molar percentage of monosaccharides. Statistical significance was determined for all pairwise comparisons using Spearman’s method. The relative abundances of ASVs were significantly negatively correlated with monosaccharides (mg/mL sugar left in the lumen), indicating that increased bacterial abundance was associated with increased utilization of these monosaccharides. For instance, Prevotella 7 was significantly negatively correlated with Rha, indicating that more Rha was utilized when the relative abundance of Prevotella 7 increased. Side chain versus backbone pectin = (Ara + Gal)/(galA+Rha); fate of side chains = Ara/Gal; (Hemi)cellulose versus pectin = (Xyl + Glc + Man)/(galA + Gal + Ara + Rha). Rha, rhamnose; Fuc, fucose; Ara, arabinose; Xyl, xylose, Man, mannose, Gal, galactose, Glc, glucose; galA, assumed to be equal to uronic acid; Total, total sugar remaining in the lumen *P < 0.05; **P < 0.01. Circle size indicates correlation values, and larger sizes indicate larger correlation values. Blue circles represent positive correlations, whereas red circles represent negative correlations.
Rha, Ara, Xyl, Man, Glu, and total monosaccharides (total) exhibited significant negative correlations with Prevotella 7 and Megasphaera, and Gal and UA also exhibited significant negative correlations with Megasphaera. Olsenella was significantly negatively correlated with “Side chain versus backbone pectin” [= (Ara + Gal)/(galA+Rha)], whereas [Ruminococcus] gauvreauii group and Desulfovibrio were significantly positively correlated with this feature. Bifidobacterium was significantly positively correlated with “Fate of side chains” [Ara/Gal], whereas Succiniclasticum and Megasphaera were significantly negatively correlated with this feature. Bacteroidales S24-7 group and unknown genera from family Prevotellaceae and Enterobacteriaceae exhibited significant negative correlations with “(Hemi)cellulose versus pectin” [(Xyl + Glc + Man)/(galA + Gal + Ara + Rha)], whereas Prevotella 7 and the Rikenellaceae RC9 gut group were significantly positively correlated with this feature.
MNBT Revealed That More Fibers Were Degraded with ALK and CELL Treatment Compared to PECT1 and PECT2
Utilization of cell wall polysaccharides upon RSM fermentation assessed using ileal cannulated growing pigs is indicated by reductions in the total carbohydrate content and constituent monosaccharides of the material in the collected bags after transit through the pigs (Table 2). After the nine substrates (in the nylon bags) passed through ileal cannulated growing pigs, 31% (CON), 11 and 22% ALK_A and ALK_B, 30 and 31% PECT1_A and _B, 30 and 30% PECT2_A and _B, and 19 and 22% CELL_A and _B carbohydrates remained in the residues, respectively (calculated from the sugar composition and DM recovery). The constituent monosaccharides of nonprocessed and processed RSM were similar to each other (Table 1), while mol percentages of Ara, Glc, and Gal were altered in ALK and CELL after fermentation in sacco (Table 2). The percentages of Ara and Gal were lower in ALK and CELL after fermentation, where the mol percentages of Ara decreased from 23% to 9% for ALK_A, 26% to 5% for ALK_B, 24% to 5% for CELL_A, and from 24% to 10% for CELL_B (Tables 1 and 2). Molar percentages of Gal were reduced from 11% to 6% in ALK_A, from 8% to 4% in ALK_B, 11% to 6% in CELL_A, and from 10% to 7% in CELL_B. Glc increased from 35% to 37% in ALK_A, from 32% to 68% in ALK_B, from 28% to 50% in CELL_A, and from 30% to 37% in CELL_B. In addition to this change in mol percentages, the recovery of DM was also reduced by at least 69%, as described above. Thus, using ALK_A (11% DM recovery) as an example, Ara decreased by approximately 25-fold (Table S3).
Table 2. Constituent Monosaccharide Composition of Residues Obtained from In Sacco Fermentation of CON, ALK, PECT1, PECT2, and CELL in Ileal Cannulated Pigsa.
| (mol %) |
(w/w %) | |||||||||
|---|---|---|---|---|---|---|---|---|---|---|
| Rha | Fuc | Ara | Xyl | Man | Gal | Glc | UA | w/w % total | recovery of DM | |
| CON | 2 | 1 | 17 | 9 | 2 | 10 | 40 | 20 | 87 | 36 |
| ALK_A | 2 | 1 | 9 | 13 | 2 | 6 | 37 | 30 | 82 | 13 |
| ALK_B | 1 | 1 | 5 | 2 | 1 | 4 | 68 | 18 | 80 | 27 |
| PECT1_A | 2 | 1 | 19 | 9 | 2 | 11 | 46 | 10 | 87 | 35 |
| PECT1_B | 2 | 1 | 18 | 11 | 2 | 10 | 39 | 17 | 89 | 35 |
| PECT2_A | 2 | 1 | 10 | 13 | 2 | 5 | 39 | 28 | 86 | 35 |
| PECT2_B | 3 | 1 | 13 | 12 | 2 | 6 | 32 | 30 | 86 | 35 |
| CELL_A | 3 | 1 | 5 | 10 | 3 | 6 | 50 | 23 | 83 | 23 |
| CELL_B | 3 | 1 | 10 | 10 | 2 | 7 | 37 | 30 | 81 | 27 |
Rha, rhamnose; Fuc, fucose; Ara, arabinose; Xyl, xylose; Man, mannose; Gal, galactose, Glc, glucose; UA, uronic acid; _A, RSM was treated after predigesting; _B, RSM was treated before predigesting.
PECT1, PECT2, and CON exhibited less of a shift in composition in these monosaccharides compared to ALK and CELL. Molar percentages of Ara decreased from 25% to 17% for CON, from 26 to 18% for both PECT1_A and PECT1_B, from 16% to 10% for PECT2_A, and from 23% to 13% for PECT2_B. The changes in Gal were within 2% for PECT1, PECT2, and CON. The molar percentages of Glc in PECT1, PECT2, and CON increased by 7%, 6%, and 2% on average, respectively. This finding does not indicate that the microbiota did not ferment these substrates. Given that 30% recovery of total carbohydrates is noted for these substrates in sacco (see above), 70% has been fermented. However, the remaining carbohydrate exhibits a monosaccharide composition similar to the original substrate that was inserted in the ileum.
Discussion
Our in vitro studies on the swine microbiota demonstrated that feeding the microbiota RSM processed with two types of pectinases (PECT1 and PECT2), a cellulase (CELL), or ALK induced differences in the composition and functionality of the gut microbiota compared to CON. Our findings revealed that ALK and CELL significantly increased the abundances of microbial functional groups related to fiber degradation and SCFA production compared to CON, and these effects did not occur with PECT1 and PECT2. This finding is consistent with the greater reduction of monosaccharide amounts in the nylon bag experiments.
Alpha diversities of ALK and CELL were lower compared to CON, while no significant differences were noted among PECT1, PECT2, and CON (Figure 2), which may be due to the selection of particular genera in Actinobacteria and Firmicutes.34 The abundances of many microbes after feeding with CELL and ALK were significantly increased compared with CON, while abundances were not shifted with PECT1 and PECT2 (Figure 4). Exogenous carbohydrases from Trichoderma longibrachiatum aid in the degradation of specific bonds of cell walls either before or after ingestion of the enzyme preparation, which subsequently causes an increase in the numbers and/or activities of bacteria that utilize the polysaccharides in the GIT.16,35 Carbohydrase supplementation modulates gut microbiota in various animal models14,15 and in vitro.16−18 Another possible mode of action of carbohydrases that has been shown in the rumen is that the enzyme preparation alters the fiber structures of substrates and stimulates the attachment of rumen microbiota to feed particles, improving fiber degradation.17 Giraldo et al. (2008) also reported that supplementing carbohydrases directly into the rumen increased the overall fibrolytic activity and stimulated the growth of cellulolytic bacteria.18 In the current study, CELL treatment (prior to ingestion) significantly increased the number of Olsenella, [Eubacterium] nodatum group, Acidaminococcus, Lachnospiraceae NK3A20 group, Bifidobacterium, Acetitomaculum, and Syntrophococcus (Figure 4). These genera may prefer to utilize cellulose and/or hemicellulose fragments generated by the action of CELL. However, in the literature, of these only Eubacterium has been reported as cellulolytic.36 CELL contains multiple glycolytic activities, including exo-1,4-β-glucanase (cellobiohydrolase), endo-1,4-β-glucanase, hemicellulase, and β-glucosidase. CELL may have broken down some bonds in cellulose, thereby enhancing (hemi)cellulose utilization by the gut bacteria and simultaneously exposing other polysaccharides (e.g., pectins) to other bacteria. ALK increased Megasphaera and the Ruminococcus gauvreauii group. Reports show that Ruminococcus are the most common cellulolytic organisms.36−39Megasphaera contains glycosyl hydrolase (GH) family 53, which is involved in plant cell wall degradation.40 These reports indicate that ALK can disrupt the cell wall architecture by solubilization of polysaccharides by breaking hydrogen bonds and hydrolyzing ester linkages, thereby removing esters present as decoration on polysaccharides and making them more accessible for further enzyme degradation and utilization by the microbiota. Interestingly, Shannon index values for both PECT1 and PECT2 groups did not significantly differ from that of the CON group. This similarity suggests very similar microbiota compositions. These results indicate that these pectinases did not change the cell wall structure or that the changes were not suited to the swine gut microbiotas’ hydrolytic capacities; thus, bacteria were not selectively stimulated. We previously reported before that a cocktail of PECT1 and PECT2 improved degradability of nonglucose polysaccharides of RSM in broilers.41−43 Nevertheless, it seems that cell wall degradation by PECT1 and PECT2 does not offer advantages to members of the swine gut microbiota.
The shifts in the bacterial community structures were converted into predicted functional metagenomic profiles (Figures 3, 5, and 6C). PECT1 and PECT2 had minimal effects on predicted microbial function as expected given the minimal changes in microbial structure. In contrast, CELL and ALK exhibited greater microbial composition shifts, subsequently resulting in more changes in microbial function. In the current study, we were interested in fiber utilization; thus, the significantly different microbial functions of carbohydrate metabolism were summarized (Figure 5). The abundances of microbes involved in carbohydrate-related microbial functional metabolism pathways, pyruvate metabolism, propanoate metabolism, pentose phosphate pathway, galactose metabolism, energy metabolism, fructose and mannose metabolism, and carbohydrate digestion and absorption (Figure 5) were increased in CELL and/or ALK compared to CON, while the abundances of microbes involved in lipopolysaccharide biosynthesis and glycan biosynthesis and metabolism were increased in CON compared to ALK. This finding was corroborated by data on SCFA production, which showed that total SCFA and propionic acid production were significantly increased in CELL and ALK compared to CON (Figure 5). Giraldo et al.17 reported that supplementation of endoglucanase and xylanase increased propionate production by 28% and total SCFA production by 11%. Thus, it is hypothesized that the complementary action between the stimulated microbes and prior incubation with the exogenous enzymes leads to the increase in hydrolytic capacity.44 However, another study45 demonstrated that the concentration of cellulolytic bacteria was not the limiting factor in the digestion of cellulose and reported that factors associated with the forage and/or the rate of cellulose hydrolysis by cellulase may have a greater influence on the amount of cellulose digested in the rumen. According to the current study, a prerequisite for the complementary action in recalcitrant fiber degradation might be that the cell wall structure of the substrate is processed appropriately by the feed enzyme, thereby making it more amenable to subsequent degradation by gut microbial enzymes. HPAEC showed that oligomers of cellulose were detected upon feeding CELL and ALK, and these oligomers were not observed with PECT1, PECT2, and CON (Figure 8). Our in sacco study also showed that more carbohydrates were utilized upon feeding CELL and ALK based on dry matter recovery. Moreover, constituent monosaccharide compositions shifted with CELL and ALK. This did not occur with PECT1, PECT2, and CON (Table 2). This finding can be explained by the fact that CELL and ALK broke down cellulose microfibrils and stimulated fibrolytic bacteria, which expressed more related enzymes. More SCFA were ultimately produced. This notion might also explain why SCFA production was not increased with PECT1 or PECT2 given that no pectin oligomers were detected by HPAEC (Figure 8). However, the mechanism by which exogenous enzymes enhance degradation of plant cell walls is complex, with many interrelated factors, and requires further studies.46 Moreover, degradation of fibers requires a plethora of microbial enzymes as indicated by the numerous PUL-loci required by Bacteroides thetaiotaomicron to breakdown pectin.46 Thus, future research needs to elucidate these interrelated factors given that a better understanding of the mode of the action will allow the development of feed enzymes designed specifically to improve feed digestion by swine.
Random Forest analysis found that the microbiota structures significantly changed after 4 h of fermentation after a shot of processed or nonprocessed RSM (Figure 6A). This finding can be explained by comparing this information with HPSEC and HPAEC results, which showed that almost all of the high molecular weight polysaccharides fibers were utilized after 4 h of fermentation (time point 52 h) and converted into low molecular weight sugars, which serve as substrates for the microbiota. The changes in nutrient composition led to the shifts in microbiota structure. Megasphaera was identified by Random Forest as the most important genus in the classification process. Figure 6B shows that a large number of samples contained Megasphaera during the fermentation period. This finding indicates that Megasphaera might be a microbe that can utilize the nonprocessed and processed RSM well. Genome-wide analysis of Megasphaera sp. showed that the genomes harbored genes coding GH25, GH32, GH43, GH53, GH73, and GH77, indicating its ability to degrade complex carbohydrates.40,47Megasphaera is also known to produce all of the SCFA, including valerate.40,47,48 In the current study, the correlation between SCFA production and the relative abundance of genera also showed that Megasphaera exhibited significantly positive correlations with acetic acid and propionic acid (Figure 8). Prevotella 7 and Desulfovibrio were also significantly positively correlated with SCFA production (Figure 8), whereas Megasphaera and Prevotella 7 exhibited considerably negative correlations with the “Fate of side chains” (Ara/Gal) and/or positive correlations with “(Hemi)cellulose versus pectin” [(Xyl + Glc + Man)/(galA + Gal + Ara + Rha)]. This finding indicated that these genera had the ability to use the side chain of pectins in the RSM cell wall and produced SCFA but only after degradation of the cellulose network given that these findings were not observed for substrates treated with PECT1 and PECT2. Prevotella 7 and Megasphaera also had significant negative correlations with most of the monosaccharides, indicating that these microbes can efficiently use monosaccharides. Research showed that Desulfovibrio significantly increased after exposure to RG-I-enriched pectin, and SCFA production was also increased.49Prevotella is well-known as an important pectinolytic bacterium.50−52 Thus, removal of cellulose by CELL seems to increase the accessibility of microbial enzymes to pectin. However, in the literature, converse reasoning is frequently presented; specifically, pectinases are thought to remove pectins from the pores in cell walls, enhancing the activity of cellulases.33
In conclusion, CELL and ALK feeding considerably changed the microbiota structure and predicted functional profiles in swine compared to CON, and these alterations were not noted with PECT1 and PECT2. It is hypothesized that this results from the different cell wall architectures of RSM once processed by this carbohydrase or alkaline treatment. The increase in relative abundance of pathways involved in carbohydrate fermentation in CELL or ALK represents a positive effect of these treatments in fiber utilization and SCFA production. Moreover, these findings indicate that CELL and ALK feeding in pigs improved the overall degradation of RSM by the mobile nylon bag technique. Altogether, we hypothesize that the carbohydrase enzyme, i.e., CELL, improved fiber degradation of RSM during fermentation by changing the microbial community structure and enzymatic activity and subsequently shifting the microbiota metagenomic functional profile.
Acknowledgments
Cheng Long received a Ph.D. scholarship from the China Scholarship Council under the Chinese Government Graduate Student Overseas Study Program (Grant No. 201603250050).
Glossary
Abbreviations Used
- RSM
rapeseed meal
- CON
control, RSM without treatment
- CELL
cellulase
- Accellerase 1000
RSM treated with CELL
- PECT
pectinase
- PECT1
Pectinex Ultra SP, RSM treated with PECT1
- PECT2
Multifect Pectinase, RSM treated with PECT2
- ALK
alkaline, 6 M NaOH, RSM treated with ALK
- _B
for carbohydrase or ALK treatment prior to digestion
- _A
for carbohydrase or ALK treatment after digestion
- SCFA
short-chain fatty acids
- NSP
nonstarch polysaccharides
- GIT
gastrointestinal tract
- SLIM
swine large intestine in vitro model
- MNBT
mobile nylon bag technique
- GES
gastric electrolyte concentrate solution
- TIM-2
TNO (gastro-) intestinal model of the colon
- SIEMP
standard ileal efflux medium of pigs
- ASV
amplicon sequence variant
- XG
xyloglucan
- RG-I
Rhamnogalacturonan I
- Rha
rhamnose
- Fuc
fucose
- Ara
arabinose
- Xyl
xylose
- Man
mannose
- Gal
galactose
- Glc
glucose
Supporting Information Available
The Supporting Information is available free of charge at https://pubs.acs.org/doi/10.1021/acs.jafc.0c03618.
Figure S1, community diversity represented by the Shannon index at the ASV level for samples from each time point; Figure S2, principle coordinate analysis plot generated based on the calculated distances in the weighted matrix; Figure S3, phylogenetic tree of the core bacteria fed with nonmodified and modified RSM; Figure S4, significantly different metagenomic function in relative abundance in different treatments compared to CON; Figure S5, HPSEC elution patterns of soluble fraction of fermentation digests; Figure S6, HPAEC elution profiles of fermentation digests during fermentation; Table S1, Random Forest prediction task of the time interval (48,52] (52,72]; Table S2, Random Forest prediction task of the processing method; Table S3, constituent monosaccharide composition of digest obtained from in vitro fermentation of CON, ALK, PEC1, PEC2, and ACC; and Script in R used to run statistics and create figures (PDF)
The study was funded by the Centre for Healthy Eating & Food Innovation (HEFI) of Maastricht University–Campus Venlo and has been made possible with the support of the Dutch Province of Limburg with a Grant to HEFI, HEFI-1venk15-25.
The authors declare no competing financial interest.
Notes
Raw sequencing data were submitted to the European Nucleotide Archive (https://www.ebi.ac.uk/ena) under accession number PRJEB36980.
Supplementary Material
References
- Bouxin A.Feed & Food Statistical Yearbook 2018. http://www.fefac.eu (accessed 19-12-2019).
- Karr-Lilienthal L. K.; Kadzere C. T.; Grieshop C. M.; Fahey G. C. Chemical and nutritional properties of soybean carbohydrates as related to nonruminants: A review. Livest. Prod. Sci. 2005, 97, 1–12. 10.1016/j.livprodsci.2005.01.015. [DOI] [Google Scholar]
- Simbaya J.; Slominski B. A.; Rakow G.; Campbell L. D.; Downey R. K.; Bell J. M. Quality characteristics of yellow-seeded Brassica seed meals: Protein, carbohydrate, and dietary fiber components. J. Agric. Food Chem. 1995, 43, 2062–2066. 10.1021/jf00056a020. [DOI] [Google Scholar]
- Slominski B. A.; Campbell L. D. Non-starch polysaccharides of canola meal: Quantification, digestibility in poultry and potential benefit of dietary enzyme supplementation. J. Sci. Food Agric. 1990, 53, 175–184. 10.1002/jsfa.2740530205. [DOI] [Google Scholar]
- de Vries S.Fiber fermentation in pigs and poultry: sense and nonsense of its manipulation. Doctoral dissertation, Wageningen University & Research, Wageningen, The Netherlands, 2014. [Google Scholar]
- Pustjens A. M.; Schols H. A.; Kabel M. A.; Gruppen H. Characterisation of cell wall polysaccharides from rapeseed (Brassica napus) meal. Carbohydr. Polym. 2013, 98, 1650–6. 10.1016/j.carbpol.2013.07.059. [DOI] [PubMed] [Google Scholar]
- Siddiqui I. R.; Wood P. J. Carbohydrates of rapeseed: a review. J. Sci. Food Agric. 1977, 28, 530–538. 10.1002/jsfa.2740280610. [DOI] [PubMed] [Google Scholar]
- Slominski B. A. Hydrolysis of galactooligosaccharides by commercial preparations of α-galactosidase and β-fruetofuranosidase: Potential for use as dietary additives. J. Sci. Food Agric. 1994, 65, 323–330. 10.1002/jsfa.2740650310. [DOI] [Google Scholar]
- Meng X.; Slominski B. Nutritive values of corn, soybean meal, canola meal, and peas for broiler chickens as affected by a multicarbohydrase preparation of cell wall degrading enzymes. Poult. Sci. 2005, 84, 1242–1251. 10.1093/ps/84.8.1242. [DOI] [PubMed] [Google Scholar]
- Pustjens A. M.; de Vries S.; Bakuwel M.; Gruppen H.; Gerrits W. J.; Kabel M. A. Unfermented recalcitrant polysaccharide structures from rapeseed (Brassica napus) meal in pigs. Ind. Crops Prod. 2014, 58, 271–279. 10.1016/j.indcrop.2014.04.036. [DOI] [Google Scholar]
- Staack L.; Della Pia E. A.; Jørgensen B.; Pettersson D.; Rangel Pedersen N. Cassava cell wall characterization and degradation by a multicomponent NSP-targeting enzyme (NSPase). Sci. Rep. 2019, 9, 10150. 10.1038/s41598-019-46341-2. [DOI] [PMC free article] [PubMed] [Google Scholar]
- Flint H. J.; Scott K. P.; Duncan S. H.; Louis P.; Forano E. Microbial degradation of complex carbohydrates in the gut. Gut Microbes. 2012, 3, 289–306. 10.4161/gmic.19897. [DOI] [PMC free article] [PubMed] [Google Scholar]
- Apajalahti J.; Kettunen A.; Graham H. Characteristics of the gastrointestinal microbial communities, with special reference to the chicken. World's Poult. Sci. J. 2004, 60, 223–232. 10.1079/WPS20040017. [DOI] [Google Scholar]
- Högberg A.; Lindberg J. E. Influence of cereal non-starch polysaccharides and enzyme supplementation on digestion site and gut environment in weaned piglets. Anim. Feed Sci. Technol. 2004, 116, 113–128. 10.1016/j.anifeedsci.2004.03.010. [DOI] [Google Scholar]
- Kiarie E.; Nyachoti C. M.; Slominski B. A.; Blank G. Growth performance, gastrointestinal microbial activity, and nutrient digestibility in early-weaned pigs fed diets containing flaxseed and carbohydrase enzyme1,2. J. Anim. Sci. 2007, 85, 2982–2993. 10.2527/jas.2006-481. [DOI] [PubMed] [Google Scholar]
- Nsereko V.; Beauchemin K.; Morgavi D.; Rode L.; Furtado A.; McAllister T.; Iwaasa A.; Yang W.; Wang Y. Effect of a fibrolytic enzyme preparation from Trichoderma longibrachiatum on the rumen microbial population of dairy cows. Can. J. Microbiol. 2002, 48, 14–20. 10.1139/w01-131. [DOI] [PubMed] [Google Scholar]
- Giraldo L.; Ranilla M.; Tejido M.; Carro M. Influence of exogenous fibrolytic enzymes and fumarate on methane production, microbial growth and fermentation in Rusitec fermenters. Br. J. Nutr. 2007, 98, 753–761. 10.1017/S0007114507744446. [DOI] [PubMed] [Google Scholar]
- Giraldo L.; Tejido M.; Ranilla M.; Ramos S.; Carro M. Influence of direct-fed fibrolytic enzymes on diet digestibility and ruminal activity in sheep fed a grass hay-based diet. J. Anim. Sci. 2008, 86, 1617–1623. 10.2527/jas.2007-0343. [DOI] [PubMed] [Google Scholar]
- Long C.; de Vries S.; Venema K. Polysaccharide source altered ecological network, functional profile, and short-chain fatty acid production in a porcine gut microbiota. Benef. Microb. 2020, 10.3920/BM2020.0006. [DOI] [PubMed] [Google Scholar]
- Sáyago-Ayerdi S. G.; Zamora-Gasga V. M.; Venema K. Prebiotic effect of predigested mango peel on gut microbiota assessed in a dynamic in vitro model of the human colon (TIM-2). Food Res. Int. 2019, 118, 89–95. 10.1016/j.foodres.2017.12.024. [DOI] [PubMed] [Google Scholar]
- Gibson G. R.; Cummings J. H.; Macfarlane G. T. Use of a three-stage continuous culture system to study the effect of mucin on dissimilatory sulfate reduction and methanogenesis by mixed populations of human gut bacteria. Appl. Environ. Microbiol. 1988, 54, 2750–2755. 10.1128/AEM.54.11.2750-2755.1988. [DOI] [PMC free article] [PubMed] [Google Scholar]
- Maathuis A.; Hoffman A.; Evans A.; Sanders L.; Venema K. The effect of the undigested fraction of maize products on the activity and composition of the microbiota determined in a dynamic in vitro model of the human proximal large intestine. J. Am. Coll. Nutr. 2009, 28, 657–666. 10.1080/07315724.2009.10719798. [DOI] [PubMed] [Google Scholar]
- Li S.; Sauer W.; Hardin R. Effect of dietary fibre level on amino acid digestibility in young pigs. Can. J. Anim. Sci. 1994, 74, 327–333. 10.4141/cjas94-044. [DOI] [PubMed] [Google Scholar]
- Thacker P.; Qiao S. Further modifications to the mobile nylon bag technique to determine nutrient digestibility for swine. Asian-Australas. J. Anim. Sci. 2001, 14, 1149–1156. 10.5713/ajas.2001.1149. [DOI] [Google Scholar]
- Klindworth A.; Pruesse E.; Schweer T.; Peplies J.; Quast C.; Horn M.; Glöckner F. O. Evaluation of general 16S ribosomal RNA gene PCR primers for classical and next-generation sequencing-based diversity studies. Nucleic Acids Res. 2013, 41 (1), e1–e1. 10.1093/nar/gks808. [DOI] [PMC free article] [PubMed] [Google Scholar]
- Bolyen E.; Rideout J. R.; Dillon M. R.; Bokulich N. A.; Abnet C. C.; Al-Ghalith G. A.; Alexander H.; Alm E. J.; Arumugam M.; Asnicar F.; Bai Y.; Bisanz J. E.; Bittinger K.; Brejnrod A.; Brislawn C. J.; Brown C. T.; Callahan B. J.; Caraballo-Rodriguez A. M.; Chase J.; Cope E. K.; Da Silva R.; Diener C.; Dorrestein P. C.; Douglas G. M.; Durall D. M.; Duvallet C.; Edwardson C. F.; Ernst M.; Estaki M.; Fouquier J.; Gauglitz J. M.; Gibbons S. M.; Gibson D. L.; Gonzalez A.; Gorlick K.; Guo J.; Hillmann B.; Holmes S.; Holste H.; Huttenhower C.; Huttley G. A.; Janssen S.; Jarmusch A. K.; Jiang L.; Kaehler B. D.; Kang K. B.; Keefe C. R.; Keim P.; Kelley S. T.; Knights D.; Koester I.; Kosciolek T.; Kreps J.; Langille M. G. I.; Lee J.; Ley R.; Liu Y.-X.; Loftfield E.; Lozupone C.; Maher M.; Marotz C.; Martin B. D.; McDonald D.; McIver L. J.; Melnik A. V.; Metcalf J. L.; Morgan S. C.; Morton J. T.; Naimey A. T.; Navas-Molina J. A.; Nothias L. F.; Orchanian S. B.; Pearson T.; Peoples S. L.; Petras D.; Preuss M. L.; Pruesse E.; Rasmussen L. B.; Rivers A.; Robeson M. S.; Rosenthal P.; Segata N.; Shaffer M.; Shiffer A.; Sinha R.; Song S. J.; Spear J. R.; Swafford A. D.; Thompson L. R.; Torres P. J.; Trinh P.; Tripathi A.; Turnbaugh P. J.; Ul-Hasan S.; van der Hooft J. J. J.; Vargas F.; Vazquez-Baeza Y.; Vogtmann E.; von Hippel M.; Walters W.; Wan Y.; Wang M.; Warren J.; Weber K. C.; Williamson C. H. D.; Willis A. D.; Xu Z. Z.; Zaneveld J. R.; Zhang Y.; Zhu Q.; Knight R.; Caporaso J. G. Reproducible, interactive, scalable and extensible microbiome data science using QIIME 2. Nat. Biotechnol. 2019, 37, 852–857. 10.1038/s41587-019-0209-9. [DOI] [PMC free article] [PubMed] [Google Scholar]
- Callahan B. J.; McMurdie P. J.; Rosen M. J.; Han A. W.; Johnson A. J. A.; Holmes S. P. DADA2: High-resolution sample inference from Illumina amplicon data. Nat. Methods 2016, 13, 581. 10.1038/nmeth.3869. [DOI] [PMC free article] [PubMed] [Google Scholar]
- Douglas G. M.; Maffei V. J.; Zaneveld J.; Yurgel S. N.; Brown J. R.; Taylor C. M.; Huttenhower C.; Langille M. G. PICRUSt2 for prediction of metagenome functions. Nat. Biotechnol. 2020, 38, 685. 10.1038/s41587-020-0548-6. [DOI] [PMC free article] [PubMed] [Google Scholar]
- Englyst H. N.; Cummings J. H. Simplified method for the measurement of total non-starch polysaccharides by gas-liquid chromatography of constituent sugars as alditol acetates. Analyst 1984, 109, 937–942. 10.1039/an9840900937. [DOI] [PubMed] [Google Scholar]
- Ahmed A. E. R.; Labavitch J. M. A simplified method for accurate determination of cell wall uronide content. J. Food Biochem. 1978, 1, 361–365. 10.1111/j.1745-4514.1978.tb00193.x. [DOI] [Google Scholar]
- Rösch C.; Taverne N.; Venema K.; Gruppen H.; Wells J. M.; Schols H. A. Effects of in vitro fermentation of barley β-glucan and sugar beet pectin using human fecal inocula on cytokine expression by dendritic cells. Mol. Nutr. Food Res. 2017, 61, 1600243. 10.1002/mnfr.201600243. [DOI] [PubMed] [Google Scholar]
- Parks D. H.; Tyson G. W.; Hugenholtz P.; Beiko R. G. STAMP: statistical analysis of taxonomic and functional profiles. Bioinformatics 2014, 30, 3123–3124. 10.1093/bioinformatics/btu494. [DOI] [PMC free article] [PubMed] [Google Scholar]
- Ramasamy U. S.; Venema K.; Schols H. A.; Gruppen H. Effect of soluble and insoluble fibers within the in vitro fermentation of chicory root pulp by human gut bacteria. J. Agric. Food Chem. 2014, 62, 6794–802. 10.1021/jf501254z. [DOI] [PubMed] [Google Scholar]
- Umu O. C.; Frank J. A.; Fangel J. U.; Oostindjer M.; da Silva C. S.; Bolhuis E. J.; Bosch G.; Willats W. G.; Pope P. B.; Diep D. B. Resistant starch diet induces change in the swine microbiome and a predominance of beneficial bacterial populations. Microbiome. 2015, 3, 16. 10.1186/s40168-015-0078-5. [DOI] [PMC free article] [PubMed] [Google Scholar]
- Beauchemin K.; Colombatto D.; Morgavi D.; Yang W.; Rode L. Mode of action of exogenous cell wall degrading enzymes for ruminants. Can. J. Anim. Sci. 2004, 84, 13–22. 10.4141/A02-102. [DOI] [Google Scholar]
- Robert C.; Bernalier-Donadille A. The cellulolytic microflora of the human colon: evidence of microcrystalline cellulose-degrading bacteria in methane-excreting subjects. FEMS Microbiol. Ecol. 2003, 46, 81–89. 10.1016/S0168-6496(03)00207-1. [DOI] [PubMed] [Google Scholar]
- Wedekind K. J.; Mansfield H. R.; Montgomery L. Enumeration and isolation of cellulolytic and hemicellulolytic bacteria from human feces. Appl. Environ. Microbiol. 1988, 54, 1530–1535. 10.1128/AEM.54.6.1530-1535.1988. [DOI] [PMC free article] [PubMed] [Google Scholar]
- Kopečný J.; Hajer J.; Mrázek J. Detection of cellulolytic bacteria from the human colon. Folia Microbiol. 2004, 49, 175. 10.1007/BF02931396. [DOI] [PubMed] [Google Scholar]
- Flint H. J.; Bayer E. A.; Rincon M. T.; Lamed R.; White B. A. Polysaccharide utilization by gut bacteria: potential for new insights from genomic analysis. Nat. Rev. Microbiol. 2008, 6, 121–131. 10.1038/nrmicro1817. [DOI] [PubMed] [Google Scholar]
- Shetty S. A.; Marathe N. P.; Lanjekar V.; Ranade D.; Shouche Y. S. Comparative genome analysis of Megasphaera sp. reveals niche specialization and its potential role in the human gut. PLoS One 2013, 8, e79353. 10.1371/journal.pone.0079353. [DOI] [PMC free article] [PubMed] [Google Scholar]
- De Vries S.; Pustjens A.; Kabel M.; Kwakkel R.; Gerrits W. Effects of processing technologies and pectolytic enzymes on degradability of nonstarch polysaccharides from rapeseed meal in broilers. Poult. Sci. 2014, 93, 589–598. 10.3382/ps.2013-03476. [DOI] [PubMed] [Google Scholar]
- Pustjens A. M.; de Vries S.; Gerrits W. J.; Kabel M. A.; Schols H. A.; Gruppen H. Residual carbohydrates from in vitro digested processed rapeseed (Brassica napus) meal. J. Agric. Food Chem. 2012, 60, 8257–63. 10.1021/jf301160m. [DOI] [PubMed] [Google Scholar]
- de Vries S.; Pustjens A. M.; Kabel M. A.; Salazar-Villanea S.; Hendriks W. H.; Gerrits W. J. Processing technologies and cell wall degrading enzymes to improve nutritional value of dried distillers grain with solubles for animal feed: an in vitro digestion study. J. Agric. Food Chem. 2013, 61, 8821–8828. 10.1021/jf4019855. [DOI] [PubMed] [Google Scholar]
- Morgavi D.; Beauchemin K.; Nsereko V.; Rode L.; Iwaasa A.; Yang W.; McAllister T.; Wang Y. Synergy between ruminal fibrolytic enzymes and enzymes from Trichoderma longibrachiatum. J. Dairy Sci. 2000, 83, 1310–1321. 10.3168/jds.S0022-0302(00)74997-6. [DOI] [PubMed] [Google Scholar]
- Dehority B.; Tirabasso P. Effect of ruminal cellulolytic bacterial concentrations on in situ digestion of forage cellulose. J. Anim. Sci. 1998, 76, 2905–2911. 10.2527/1998.76112905x. [DOI] [PubMed] [Google Scholar]
- Luis A. S.; Briggs J.; Zhang X.; Farnell B.; Ndeh D.; Labourel A.; Basle A.; Cartmell A.; Terrapon N.; Stott K.; Lowe E. C.; McLean R.; Shearer K.; Schuckel J.; Venditto I.; Ralet M.-C.; Henrissat B.; Martens E. C.; Mosimann S. C.; Abbott D. W.; Gilbert H. J. Dietary pectic glycans are degraded by coordinated enzyme pathways in human colonic Bacteroides. Nat. Microbiol. 2018, 3, 210–219. 10.1038/s41564-017-0079-1. [DOI] [PMC free article] [PubMed] [Google Scholar]
- Marounek M.; Fliegrova K.; Bartos S. Metabolism and some characteristics of ruminal strains of Megasphaera elsdenii. Appl. Environ. Microbiol. 1989, 55, 1570–1573. 10.1128/AEM.55.6.1570-1573.1989. [DOI] [PMC free article] [PubMed] [Google Scholar]
- Chiquette J. The role of probiotics in promoting dairy production. In 30th Western Nutrition Conference, 2009; p 2.
- Mao G.; Li S.; Shen X.; Zhou S.; Orfila C.; Linhardt R. J.; Ye X.; Chen S. Depolymerized RG-I enriched pectin from citrus segment membrane modulates gut microbiota, increases SCFAs production, promotes the growth of Bifidobacterium spp., Lactobacillus spp. and Faecalibaculum spp. Food Funct. 2019, 10, 7828–7843. 10.1039/C9FO01534E. [DOI] [PubMed] [Google Scholar]
- Marounek M.; Kalachnyuk G. Stoichiometry of pectin and glucose fermentation in Prevotella ruminicola. Ukr. Biokhim. Zh. (1978) 1995, 67, 107–110. [PubMed] [Google Scholar]
- Nograšek B.; Accetto T.; Fanedl L.; Avguštin G. Description of a novel pectin-degrading bacterial species Prevotella pectinovora sp. nov., based on its phenotypic and genomic traits. J. Microbiol. 2015, 53, 503–510. 10.1007/s12275-015-5142-0. [DOI] [PubMed] [Google Scholar]
- Tian L.; Bruggeman G.; van den Berg M.; Borewicz K.; Scheurink A. J.; Bruininx E.; de Vos P.; Smidt H.; Schols H. A.; Gruppen H. Effects of pectin on fermentation characteristics, carbohydrate utilization, and microbial community composition in the gastrointestinal tract of weaning pigs. Mol. Nutr. Food Res. 2017, 61, 1600186. 10.1002/mnfr.201600186. [DOI] [PubMed] [Google Scholar]
Associated Data
This section collects any data citations, data availability statements, or supplementary materials included in this article.