
Figure 8.
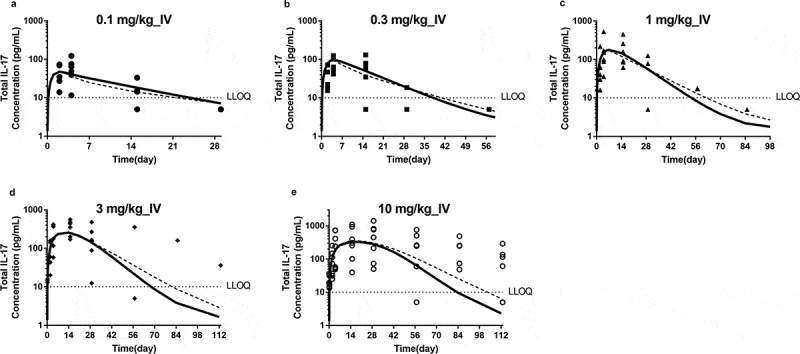
Comparison of observed and model-predicted Total IL-17A profiles following a single IV administration of JNJ-8104 at 0.1, 0.3, 1, 3 and 10 mg/kg (a−e) normal human subjects. Symbols = Observed individual data; Solid lines = Mean model prediction based on cyno PK/TE model parameters and allometric scaling for human PK; Dotted lines = Mean model prediction based on estimated JNJ-8104 human PK parameters from FIH data with cyno-based in vivo KD.