

Antimicrobial resistance (AMR) is a multifaceted problem that poses a worldwide threat to human and animal health. Recent reports suggest that wildlife may play an important role in the emergence, dissemination, and persistence of AMR. As such, there have been calls for better integration of wildlife into current research on AMR, including the use of wild animals as biosentinels of AMR contamination in the environment. A One Health approach can be used to gain a better understanding of all AMR sources and pathways, particularly those at the human-animal-environment interface. Our study focuses on this interface in order to assess the effect of human-impacted landscapes on AMR in a wild animal. This work highlights the value of wildlife rehabilitation centers for environmental AMR surveillance and demonstrates how metagenomic sequencing within a spatial epidemiology framework can be used to address questions surrounding AMR complexity in natural ecosystems.
KEYWORDS: Enterobacteriaceae, anthropogenic landscapes, antimicrobial resistance, metagenomics, raptors, spatial epidemiology, wildlife
ABSTRACT
Antimicrobial resistance (AMR) is a well-documented phenomenon in bacteria from many natural ecosystems, including wild animals. However, the specific determinants and spatial distribution of resistant bacteria and antimicrobial resistance genes (ARGs) in the environment remain incompletely understood. In particular, information regarding the importance of anthropogenic sources of AMR relative to that of other biological and ecological influences is lacking. We conducted a cross-sectional study of AMR in great horned owls (Bubo virginianus) and barred owls (Strix varia) admitted to a rehabilitation center in the midwestern United States. A combination of selective culture enrichment and shotgun metagenomic sequencing was used to identify ARGs from Enterobacteriaceae. Overall, the prevalence of AMR was comparable to that in past studies of resistant Enterobacteriaceae in raptors, with acquired ARGs being identified in 23% of samples. Multimodel regression analyses identified seasonality and owl age to be important predictors of the likelihood of the presence of ARGs, with birds sampled during warmer months being more likely to harbor ARGs than those sampled during cooler months and with birds in their hatch year being more likely to harbor β-lactam ARGs than adults. Beyond host-specific determinants, ARG-positive owls were also more likely to be recovered from areas of high agricultural land cover. Spatial clustering analyses identified a significant high-risk cluster of tetracycline resistance gene-positive owls in the southern sampling range, but this could not be explained by any predictor variables. Taken together, these results highlight the complex distribution of AMR in natural environments and suggest that both biological and anthropogenic factors play important roles in determining the emergence and persistence of AMR in wildlife.
IMPORTANCE Antimicrobial resistance (AMR) is a multifaceted problem that poses a worldwide threat to human and animal health. Recent reports suggest that wildlife may play an important role in the emergence, dissemination, and persistence of AMR. As such, there have been calls for better integration of wildlife into current research on AMR, including the use of wild animals as biosentinels of AMR contamination in the environment. A One Health approach can be used to gain a better understanding of all AMR sources and pathways, particularly those at the human-animal-environment interface. Our study focuses on this interface in order to assess the effect of human-impacted landscapes on AMR in a wild animal. This work highlights the value of wildlife rehabilitation centers for environmental AMR surveillance and demonstrates how metagenomic sequencing within a spatial epidemiology framework can be used to address questions surrounding AMR complexity in natural ecosystems.
INTRODUCTION
Antimicrobial resistance (AMR) is a complex global problem that poses a serious threat to human and animal health. While antimicrobial use primarily occurs in health care and veterinary settings and food animal production, there is substantial evidence that residual antibiotics and associated antimicrobial-resistant bacteria (ARB) and antimicrobial resistance genes (ARGs) can also spread into natural ecosystems (1–3). To date, many studies have confirmed the widespread nature of AMR in environmental resources and wildlife, including resistance of clinical relevance to treating infections in humans and domestic animals (4, 5). This is particularly true of wild animals living in close proximity to anthropogenic sources of AMR, such as wastewater effluent, landfills, livestock facilities, and agricultural fields fertilized with manure (6–11). Thus, wildlife may play an important role in the maintenance and dissemination of AMR (12, 13). Specifically, wild animals may act as secondary or amplifying reservoirs of ARB and ARGs that may be reintroduced into humans and domestic animals at human-environment interfaces, such as through contamination of animal feed or drinking water reservoirs (5). Wildlife may also act as vectors by disseminating AMR to new geographical regions (this is particularly the case with migratory birds) or provide novel opportunities for the horizontal transfer of ARGs to zoonotic pathogens (13, 14). However, a more detailed understanding of how and when wildlife impacts AMR can be achieved only via an integrated One Health approach, where all potential sources and pathways, including those at the human-animal-environment interface, are considered.
Given the potential for wild animals to affect AMR persistence, spread, and evolution and the predicted subsequent risks for public health, there have been calls for the better integration of wildlife into current research on AMR (12), including the use of wild animals as indicators or biosentinels of AMR contamination in the environment (4, 15). In particular, shared ARB, ARGs, and plasmids illustrate potential exchanges between humans, domestic animals, and environmental compartments (4, 16, 17). However, the spatial distribution of AMR in the environment is heterogeneous, and the importance of anthropogenic sources of AMR relative to that of other biological and ecological determinants remains poorly understood (13, 18, 19). This is due in part to logistical and ethical concerns with sampling wild animals, which can limit sample sizes and the collection of relevant metadata. Wildlife rehabilitation centers may represent a convenient resource of animals for AMR surveillance in natural ecosystems. Animals may be recovered from broad geographical areas, allowing for more comprehensive surveys, and biological samples and biometrics are relatively easy to collect upon admission. Indeed, a number of studies on ARB have utilized wildlife rehabilitation data, particularly from raptors, with promising results (20–22).
Owls are commonly admitted to rehabilitation centers worldwide and may be particularly good biosentinels for human-derived AMR in the environment, given their diet of small animals commonly exposed to agricultural animal feed, by-products, and waste and the potential for the trophic accumulation of resistance organisms via their prey (23–26). Further, owls are found across a broad variety of ecoregions, including wetlands, forests, grasslands, agricultural areas, and urban/suburban areas (27, 28), which provides an opportunity to explore the relationship between landscape variation and the spatial distribution of AMR.
Here, we conducted a cross-sectional study of ARGs collected from two species of wild owls—great horned owls (Bubo virginianus) and barred owls (Strix varia)—admitted to a large raptor rehabilitation facility in the midwestern United States. First, we used an enriched metagenomic sequencing approach to characterize acquired ARGs harbored by Enterobacteriaceae, a bacterial family that is thought to play an important role in the global spread of ARGs and that includes many medically important ARB, such as extended-spectrum-β-lactamase (ESBL)-producing Escherichia coli (29, 30). Shotgun metagenomic sequencing approaches have been used to characterize the collection of ARGs (referred to as the “resistome”) across a variety of microbial communities in humans, domestic animals, and environmental sources, such as soil and water (31–34). However, such sequencing often requires a significant sequencing depth to detect ARGs in low-abundance bacterial species (35). Selective culture enrichment of bacterial taxa of interest, combined with shotgun sequencing, allows for ARG profiling of multiple taxa within the selected group while avoiding the need for an excessive sequencing depth (36). We then used analytical tools from spatial epidemiology to identify potential spatial clusters of AMR and explore how anthropogenic landscapes shape the genetic structure and geographical distribution of ARGs. Since both great horned and barred owls are nonmigratory and typically have small, localized home ranges (37), we had the ability to link an ARG-positive owl to fine-scale land use data from the geographical area where they were recovered. Together, our results demonstrate how metagenomic sequencing within a spatial epidemiology framework can be used to broaden our understanding of AMR complexity in natural ecosystems.
RESULTS
A total of 78 cloacal swab samples from great horned owls and barred owls were enriched for Enterobacteriaceae, and total DNA was extracted. Shotgun sequencing generated over 66 million read pairs, with an average of 850,859 read pairs (range, 94,875 to 1,829,247) being generated per sample (see Data Set S1 in the supplemental material). On average, 85.7% of read pairs per sample (range, 70.3% to 92.4%) survived quality filtering (Data Set S1). Subsequent bioinformatic analyses of the sequences were performed to assign the taxonomy, identify the ARGs in each sample, and characterize the genetic context of each identified ARG (Fig. 1).
FIG 1.

Flowchart depicting the bioinformatic analyses performed in this study. Numbers in parentheses are reference numbers (72, 74, 76–78, 80, 83–86). Abbreviations: ARG, antimicrobial resistance gene; CDS, coding sequence; NCBI, National Center for Biotechnology Information; nr, nonredundant.
Taxonomy assignments by use of the Kraken program classified 97.4% of the reads (range, 60.0% to 99.9%) as belonging to bacteria, with the remaining 2.6% of reads being classified as either belonging to archaea or viruses or uncharacterized. As expected, the majority of bacterial reads were assigned to the family Enterobacteriaceae (mean, 96.7%; range, 47.0% to 99.4%). Escherichia coli was the most abundant species and was identified in 92.3% (72/78) of samples (Fig. 2). Plesiomonas shigelloides was dominant in 2.6% (2/78) of samples, and Escherichia albertii, Escherichia fergusonii, Klebsiella aerogenes, and K. oxytoca were each dominant in one sample. Interestingly, Salmonella enterica was identified in all 78 samples, but at a level several orders of magnitude lower than that for E. coli (mean normalized relative abundances, 0.0023 ± 0.0023 for S. enterica versus 0.59 ± 0.19 for E. coli).
FIG 2.

Heatmap displaying the relative abundance of bacterial species and the presence/absence of antibiotic resistance genes across 78 owl cloacal swab samples. Samples (rows) are clustered based on cumulative sum scaling-normalized bacterial species abundances, using the Euclidean distance with complete linkage. Only bacterial species with a relative abundance of ≥0.1 in at least one sample are included. ARGs are colored according to their major antimicrobial chemical class. Colored squares indicate the presence of a gene; white squares indicate its absence. ARGs that were identified via inclusion of multimapping reads are marked with asterisks (see “Antimicrobial resistance gene identification” in Materials and Methods for further details). Abbreviations: P. shigelloides, Plesiomonas shigelloides; S. pseudintermedius, Staphylococcus pseudintermedius.
ARGs were associated with a range of antimicrobial drug classes, but overall ARG prevalence was low.
To identify acquired ARGs, quality-filtered sequencing reads were aligned to ARG reference sequences, where a gene fraction of ≥80% was used to decrease the likelihood of false-positive ARG identification. Across all samples, ARGs were identified in only 23.1% of owls (18/78) (Fig. 2). Inclusion of multimapping reads for gene fraction calculations considerably improved ARG identification by nine additional ARGs in seven additional owls (note the asterisks in Fig. 2; see “Antimicrobial resistance gene identification” in Materials and Methods for further details). Among the ARG-positive owls, the median number of unique ARGs was 1 (range, 1 to 6 unique ARGs). A total of 17 unique ARG groups were identified, including those that encode resistance to the antimicrobial drug classes β-lactams, tetracyclines, fosfomycin, aminoglycosides, phenicols, trimethoprim, and sulfonamides. ARGs that confer resistance to tetracyclines and β-lactams were the most prevalent across samples (n = 8 samples), with the specific gene groups tet(A) and blaTEM being identified in five and six samples, respectively. Of particular note, blaCMY, which encodes an AmpC β-lactamase conferring resistance to cephalosporins, was identified in one sample. Two samples also carried the ARG pair oqxAB, which confers resistance to multiple antimicrobial drug classes, including fluoroquinolones.
De novo assemblies revealed that multiple ARGs were associated with commonly found MGEs.
To gain insight into the genetic environment of the identified ARGs, reads were de novo assembled and ARG-positive contigs were annotated, with a particular focus being placed on ARG colocalization and association with mobile genetic elements (MGEs). The average number of assembly contigs of ≥500 bp per sample was 925 ± 1,035.4, with a read mapping rate of over 99% (mean, 99.4% ± 0.6%) (Data Set S1). Twenty-one ARGs across 14 samples were identified in assembly contigs, including one ARG (dfrA17) that was not identified via read mapping due to a gene fraction of <80% and another two ARGs that were colocalized on the same contig [blaTEM-1b and tet(A)] (Table 1). The majority of ARG contigs could be classified as either plasmid (8/21) or chromosomal (5/21), based on top BLAST hits and the presence of plasmid replicons or species-specific housekeeping genes. The remaining eight contigs matched equally well to both plasmid and chromosomal NCBI reference sequences and therefore were classified as “unknown.” Predicted plasmid types of contigs included IncFIA/FII in two samples and IncI1 and Inc1/FII in one sample each. Among the chromosomal ARG contigs, predicted taxonomic origins included E. coli, K. aerogenes, and K. oxytoca, a finding which was further supported by the presence of typically chromosomally encoded ARGs (i.e., fosA7 in Salmonella Heidelberg [38], fosA in K. aerogenes [39], and blaOXY-2-6 in K. oxytoca [40]).
TABLE 1.
Genetic environment of antimicrobial resistance genes identified in assembly contigs
| Sample | Resistance genea (GenBank accession no.) | Contig identifier | Size (bp) | DNA molecule type | Predicted origin | Associated mobile genetic element(s)b |
|---|---|---|---|---|---|---|
| MB95 | ant(2″)-Ia (X04555) | NODE_2877 | 573 | Unknown | Enterobacteriaceae | Unknown |
| MB132 | aph(6)-Id (M28829) | NODE_452 | 1,177 | Unknown | Enterobacteriaceae | Unknown |
| MB128 | blaOXY-2-6 (AY077485) | NODE_8 | 273,128 | Chromosome | K. oxytoca | None |
| MB132 | blaTEM-1b (AY458016) | NODE_356 | 2,026 | Unknown | Enterobacteriaceae | Tn2 transposon |
| MB134 | blaTEM-1b (AY458016) | NODE_1997 | 958 | Unknown | Enterobacteriaceae | Unknown |
| MB143 | blaTEM-1b (AY458016) | NODE_2 | 77,719 | Plasmid, IncFIA/FII | Enterobacteriaceae | Tn2 transposon |
| MB158 | blaTEM-1b (AY458016) | NODE_13 | 140,727 | Plasmid, IncFIA/FII | Enterobacteriaceae | Tn2 transposon |
| MB79 | blaTEM-1b (AY458016) | NODE_14 | 35,371 | Plasmid, IncI1 | Enterobacteriaceae | Tn2 transposon flanked by IS200/IS605-like elements |
| MB81 | dfrA17 (FJ460238) | NODE_2242 | 501 | Unknown | Enterobacteriaceae | Unknown |
| MB132 | dfrA5 (X12868) | NODE_137 | 11,916 | Plasmid | Enterobacteriaceae | Class 1 integron downstream of TnAs1/Tn21 transposon |
| MB74 | fosA (ACZD01000244) | NODE_10 | 159,439 | Chromosome | K. aerogenes | None |
| MB103 | fosA7 (LAPJ01000014) | NODE_5 | 272,244 | Chromosome | E. coli | ISL3 family-like transposon |
| MB130 | fosA7 (LAPJ01000014) | NODE_3 | 305,867 | Chromosome | E. coli | ISL3 family-like transposon |
| MB150 | fosA7 (LAPJ01000014) | NODE_11 | 137,767 | Chromosome | E. coli | ISL3 family-like transposon |
| MB134 | hugA (AF324468) | NODE_2049 | 928 | Unknown | P. penneri | Unknown |
| MB132 | sul2 (HQ840942) | NODE_391 | 1,708 | Unknown | Enterobacteriaceae | Unknown |
| MB132 | tet(A) (AF534183) | NODE_269 | 3,812 | Plasmid | Enterobacteriaceae | TnAs1-like transposon |
| MB143 | tet(A) (AF534183) | NODE_224 | 8,342 | Plasmid | Enterobacteriaceae | TnAs1-like transposon |
| MB158 | tet(A) (AF534183) | NODE_13 | 140,727 | Plasmid, IncFII/FIA | Enterobacteriaceae | TnAs1-like transposon |
| MB78 | tet(B) (AP000342) | NODE_60 | 6,905 | Unknown | Enterobacteriaceae | Tn10/IS10 transposon |
| MB141 | tet(B) (AF326777) | NODE_22 | 89,530 | Plasmid, IncI1/FII | Enterobacteriaceae | Tn10/IS10 transposon missing IS10L element |
Antimicrobial resistance gene identification was based on reference sequences from the ResFinder database (77).
Schematic representations of mobile genetic elements associated with ARGs are shown in Fig. S1 in the supplemental material.
Genetic features associated with both transposons and integrons were identified in 13 samples within close proximity to ARGs, including blaTEM-1b, dfrA5, fosA7, tet(A), and tet(B) (Table 1; Fig. S1). Specifically, the blaTEM-1b gene, conferring resistance to β-lactams, was located within the Tn2 transposon, the dominant blaTEM-containing transposon in commensal E. coli isolates (41, 42). Among genes conferring resistance to tetracyclines, tet(A) and its repressor, tet(R), were associated with the Tn3-like TnAs1 transposon, whereas tet(B) and tet(R) were flanked by regulation genes tet(C) and tet(D) and Tn10/IS10 transposon elements. The fosfomycin resistance gene, fosA7, was found adjacent to an ISL3 family-like transposase within the E. coli chromosome. Finally, a trimethoprim resistance gene, dfrA5, was adjacent to the clinical class 1 integron integrase, intI1, which was directly upstream of the TnAs1 transposase and resolvase and the Tn21 modulator gene, tnpM.
Both host characteristics and landscape features were important predictors of the ARG spatial distribution.
To better understand the geographical distribution of identified ARGs from owls, we conducted several spatial analyses utilizing information about anthropogenic features surrounding owl recovery locations. First, to determine whether there was any spatial clustering of ARG-positive owls, we performed a purely spatial cluster analysis with SaTScan software (http://www.satscan.org) for each ARG and antimicrobial chemical class. A single high-risk cluster of owls harboring at least one tetracycline resistance gene [i.e., tet(A), tet(B), or tet(J)] was identified in southern Minnesota (relative risk = 21.74, P = 0.014; Fig. 3). No other high- or low-risk clusters were identified for any other antimicrobial chemical class or ARG.
FIG 3.

Map displaying owl recovery locations and the results of spatial-only cluster analyses performed with SaTScan software. Points indicate recovery locations, with red points indicating tetracycline resistance gene-positive owls.
Second, to investigate the role of host characteristics and anthropogenic landscape features on the spatial distribution of ARGs, we used multimodel inference with model averaging to identify important independent variables. Spatial metrics associated with each owl were based on the recovery location and were calculated for both the owl’s potential home range area and the local watershed. Overall, only a few landscape features and host-specific characteristics were identified to be important predictors of ARG-positive owls (Fig. 4; Table S1). The sequencing read count was an important predictor in all models, with the probability of identifying ARGs increasing with the sequencing depth (35). Seasonality and agricultural land cover were identified to be additional important predictors of the likelihood of an owl with at least one ARG conferring resistance to any antimicrobial chemical class, with ARG-positive owls more likely to be recovered during warmer periods of the year and in watershed areas with higher agricultural land use (Fig. 4A). For the likelihood of identifying an owl with at least one β-lactam resistance gene (primarily blaTEM-1b), owl age and domestic cattle density were the most important predictors. Specifically, birds in their hatch year were more likely to possess a β-lactam resistance gene than adult birds, and, somewhat surprisingly, β-lactam resistance gene-positive owls were more common in watershed areas with a lower cattle density than in watershed areas with a higher cattle density (Fig. 4B). The remaining predictors included in the final models (host species and body condition score, poultry density, and point source density) had confidence intervals overlapping zero, which suggests that they had little to no importance for predicting ARG-positive owls. All other antimicrobial chemical classes tested, including tetracyclines, included the null (intercept-only) model in the top model set. This indicated that the observed spatial variation of ARG-positive owls could not be adequately explained by any of the proposed covariates. Using Moran’s I to test for a residual spatial correlation in each regression analysis, only the tetracycline top models suggested an unexplained spatial correlation (Table S2).
FIG 4.
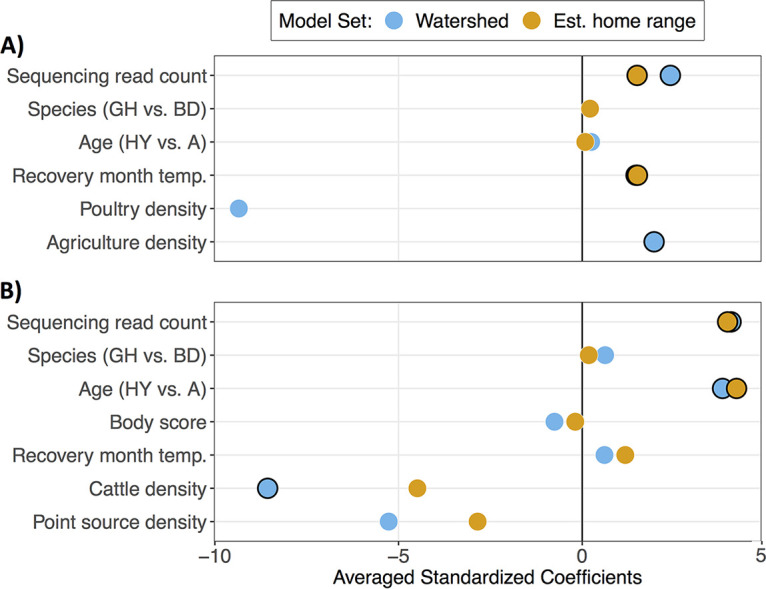
Zero-averaged and standardized coefficients from multimodel inference of the presence of any antimicrobial resistance gene (A) and β-lactam resistance genes (B) identified in owl cloacal swabs. Separate model sets were generated for spatial predictors based on the water catchment (blue points) and estimated home range (orange points) of owl recovery locations. Only the predictors included in the final model sets (ΔAICc < 2) are shown. Points with black outlines indicate predictors where the 95% confidence intervals do not overlap zero. Abbreviations: GH, great horned owl; BD, barred owl; HY, hatch year; A, adult; temp., temperature.
DISCUSSION
The presence of AMR in natural ecosystems, including wild animals, is a widespread and well-documented phenomenon (1, 2). However, to date, we still lack a complete picture of the forces shaping the geographical distribution of AMR in the environment, including the importance of anthropogenic sources of AMR compared to that of other landscape- and host-specific determinants (13, 18, 19). Here we demonstrate how analytical tools from spatial epidemiology, in combination with selective shotgun metagenomic sequencing, can be used to investigate how landscape features and host ecology shape the spatial distribution of ARGs from wild owls.
Overall, the ARG prevalence identified in this study was comparable to that identified in other studies in wildlife (6, 7, 9), with acquired ARGs being identified in 23% of samples. Past studies of resistant Enterobacteriaceae in raptors, including owls, have reported a wide range of resistance levels for various tested antibiotics and identified ARGs (24, 43–46). In part, these differences could be due to variability in sampling, culturing, and AMR detection methods between studies, with some studies reporting the phenotypic resistance profiles of only individual bacterial isolates (24, 43–45) and others including additional information on the specific ARGs identified (21, 46). In the present study, a sequence-based approach was used to identify ARGs, the presence of which, it should be noted, does not necessarily reflect phenotypic resistance. Further, AMR prevalence may be underestimated if resistance is conferred by novel ARGs that are undocumented in reference databases. Additionally, our study focused on antimicrobial resistance in Gram-negative Enterobacteriaceae because they are thought to play an important role in the global spread of ARGs and included a number of medically important ARB (29, 30). However, prior studies of AMR in raptors have also focused on Gram-positive enterococci, in which the levels of resistance detected were similar to or higher than those detected in the Enterobacteriaceae (23, 46, 47), suggesting that we may have missed an important component of the raptor resistome by focusing only on Enterobacteriaceae.
Our sample processing also involved a freeze-thaw step, which may have affected cell viability, resulting in a decreased diversity of bacterial strains and/or ARGs. The two subsequent culture steps, first in nonselective brain heart infusion broth, to aid in bacterial recovery after the thaw, and then in selective lauryl tryptose broth, to enrich for Enterobacteriaceae, also likely impacted our results. Given that some bacterial species are unculturable and that there can be substantial growth variation between different strains of bacteria, the diversity and abundance of the resulting sequenced bacterial subpopulations were likely not representative of those of the true starting community (36). If certain ARG-positive strains did not recover well after freezing or did not adequately grow during either culture step, there may have been additional ARGs in our samples that we were unable to detect. That said, the relatively high cost of metagenomic sequencing of nonenriched samples necessitates a trade-off between the completeness of resistome characterization (i.e., sequencing depth) and the number of samples to be sequenced (35). By using a hybrid of culture enrichment and metagenomic sequencing, we were able to include samples from a broad range of landscape types and generate the larger sample size necessary for statistical analyses.
Heterogeneity in AMR prevalence between studies, as well as between individuals within the same study, may also be partly attributable to host biological and ecological characteristics. While owl species was not identified to be an important predictor in our multimodel regression analyses, both owl age and collection season were associated with the likelihood of detecting ARGs. Specifically, birds in their hatch year were more likely to harbor ARGs conferring resistance to β-lactams than adult birds. While this pattern has been observed in both wild and domestic mammals (48–50), to our knowledge, this is the first report of an age-related distribution of AMR in wild birds. Seasonality was also an important predictor of the presence of ARGs, with birds sampled during warmer months being more likely to harbor at least one ARG than birds sampled during cooler months. A similar association between seasonality and the presence of a resistant E. coli strain has been observed in both wild mammals and birds (51, 52). The specific mechanisms underlying the relationship between both of these variables and AMR still remain unknown, but differential exposures and/or selective pressures or underlying changes in gut microbiomes between ages or seasons may play a role (51, 53, 54). For example, one hypothesis that has been put forward to explain the age-related decline of AMR in domestic mammals proposes that certain resistant bacterial strains in young animals may have a selective advantage over susceptible strains due to a genetic linkage between ARGs and other fitness-enhancing genes (49).
Beyond host-specific determinants of AMR, we also investigated the importance of landscape features, including potential anthropogenic sources of AMR. Overall, we found a limited spatial clustering of ARG-positive owls, and few landscape features were significantly associated with the likelihood that an owl harbored ARGs. This may have been due to our relatively small sample size and low AMR prevalence, which may have impeded our ability to detect all patterns present in the data set. That said, the patterns that we were able to detect may be indicative of robust support. Specifically, agricultural land cover was identified to be an important predictor for the presence of any ARG, with ARG-positive owls more likely to be recovered from water catchments containing a high density of hay, pasture, or row crops. One potential explanation for this is the common practice of spreading animal manure or biosolids on agricultural soils as fertilizer. These materials can act as a reservoir for residual antibiotic compounds, ARB, and ARGs, which may persist in the soil long after application (55–57). Similarly, the use of pesticides on agricultural fields has been shown to coselect for ARGs (57). Together, these agricultural practices may increase the AMR exposure risk for local wild animals, adjacent water bodies, or groundwater (57). Thus, owls may have acquired ARB and ARGs via the consumption of small mammals commonly inhabiting agricultural fields (e.g., rodents) or directly via contaminated drinking water (23, 58). Further, the fact that both cattle density and agricultural land cover were significant predictors when calculated only on the basis of water catchment and not the estimated owl home ranges suggests that water systems may be particularly important drivers of AMR dissemination within natural ecosystems (59, 60).
Interestingly, we also identified a significant high-risk cluster of tetracycline resistance gene-positive owls in southern Minnesota, where the vast majority of food-animal production takes place in the state (61). While there is a lack of data on the usage of tetracyclines in Minnesota (but see reference 62), it is well established that tetracyclines are one of the most extensively used antibiotic classes in most food-producing animals, including cattle, swine, and poultry, which are all present at higher densities in southern Minnesota than in the northern half of the state (63). However, this observed cluster of tetracycline resistance gene-positive owls could not be adequately explained by any of our host or spatial variables, suggesting that our regression analyses may have been underpowered due to a small sample size and/or that there may be unknown factors that we did not account for in our models. Further, because this was a convenience sample of owls, there may have been some geographical areas from which bird submission was more or less likely (i.e., urban versus wilderness areas). While randomized or spatially stratified sampling would have been ideal, that is rarely possible in field studies of wildlife. That being said, we were able to obtain an ample sample representation across a gradient of anthropogenic landscapes and ecoregions. Finally, these results may simply reflect the pervasive nature of many of the ARGs that we identified in natural ecosystems. Specifically, the majority of identified ARGs have similarly been reported in a wide range of wild animals and environmental resources for decades (1, 2), suggesting that even if they were originally of anthropogenic origin, the signal was effectively lost as the genes spread throughout various hosts and environments. For example, in the present study, genes conferring resistance to β-lactams and tetracyclines were the most common ARGs identified. However, the most frequently identified gene groups, blaTEM and tet(A), are both commonly found in natural environments (31, 33), indicating that we would not necessarily expect a higher prevalence of these genes in anthropogenically impacted landscapes than in more pristine environments. Indeed, we observed the reverse association, with β-lactamase ARG-positive owls more likely to be recovered from areas with a low density of domestic cattle (including dairy cattle and cattle used for beef production) than from areas with a high density of domestic cattle. We suspect that had more recently emerged ARGs of clear human origin been identified in our samples (e.g., mcr-1) (64), there may have been a stronger association with anthropogenic landscape features.
Our identification of certain mobile genetic elements does provide compelling evidence that some ARGs identified in this study may be of anthropogenic origin. In particular, the presence in one sample of the trimethoprim resistance gene dfrA5 in association with the clinical class 1 integron integrase gene intI1 suggests a potential anthropogenic source, as intI1 is thought to be a good proxy of anthropogenic pollution (65, 66). Indeed, the complete tnpA-tnpR-tnpM-intI1-dfrA5 region has been identified in E. coli plasmids from both humans and domestic animals (67–69), but there is currently no published record of it in a wild animal. Similarly, all other ARG-MGE sequence regions found in our samples have also been commonly identified in Enterobacteriaceae from a broad range of human and animal hosts. However, few of these records come from wildlife or natural sources, such as water and soil. While this could indicate that novel and recent transmission events led to the presence of these sequences in our wild owl samples, a more likely explanation is that such ARGs-MGEs are present in natural ecosystems but have not yet been identified due to undersampling and a lack of sequencing techniques that provide the genetic context of ARGs. This highlights the ongoing need for studies of AMR in wildlife to go beyond simply identifying resistance phenotypes and ARGs and to start exploring the more complex details of AMR transmission pathways between anthropogenic and natural ecosystems. These necessary next steps will be greatly aided by the wide array of sequencing and analytical tools now available to researchers, with the methodology presented here being one of many possibilities.
MATERIALS AND METHODS
Study population and sample collection.
Great horned owls (Bubo virginianus) and barred owls (Strix varia) are the most common owls in North America and can be found across a broad variety of ecoregions, including wetlands, forests, grasslands, agricultural areas, and urban/suburban areas (27, 28). Great horned and barred owls are nonmigratory, and most individuals have permanent or long-term residencies in a particular region (27, 28). Home ranges are typically small (71 to 560 ha for great horned owls and 84 to 498 ha for barred owls [37]), although they may change in response to owl population density or prey availability (70, 71). Both species are generalist predators with a diet that includes small and medium-sized mammals, birds, and large invertebrates (27, 28).
Samples were opportunistically collected from all great horned owls (n = 47) and barred owls (n = 31) admitted to The Raptor Center (TRC; https://www.raptor.umn.edu) at the University of Minnesota (St. Paul, MN, USA) between December 2016 and July 2017. Samples were taken as part of clinical evaluation and routine care of wild patients undergoing treatment in the medical facility; thus, Institutional Animal Care and Use Committee approval was not required. The owls were recovered by public volunteers throughout Minnesota (n = 69), western Wisconsin (n = 8), and northeastern North Dakota (n = 1) and transported to TRC. Given the opportunistic nature of locating an injured owl, greater numbers of individuals were recovered from more densely human populated areas, particularly Minnesota’s two largest cities, Minneapolis and St. Paul. The latitude and longitude (geographic coordinate system WGS84) of each owl recovery location were determined from the nearest intersection or other prominent landmark.
Immediately upon admission to TRC, before any antimicrobials were administered, a single cloacal swab sample was collected from each owl by rubbing a sterile flocked swab (HydraFlock; Puritan Medical Products, Guilford, ME) against the cloacal mucosa until fecal material was transferred. The swabs were then immediately placed in 1 ml of brain heart infusion broth (Oxoid, ThermoFisher Scientific, Waltham, MA) with 15% glycerol (Fisher Chemical, ThermoFisher Scientific, Waltham, MA), vortexed for 10 s, and stored at −80°C for future use. Information on owl age class (adult or hatch year), sex (male, female, unknown), reason for admittance (e.g., starvation, collision), and body condition score (0.5 to 5.0) as a proxy for health status were also established at the time of admission (see Data Set S2 in the supplemental material).
Sample processing and sequencing.
To enhance the detection of antimicrobial resistance genes in low-abundance species of the Enterobacteriaceae, the samples underwent culture enrichment before sequencing (36). Sample glycerol stocks were thawed at room temperature and gently agitated to resuspend any substrate. One hundred microliters of the sample was then added to 10 ml of brain heart infusion broth (Oxoid, ThermoFisher Scientific, Waltham, MA), and the mixture was incubated at 37°C for 3 h. Lauryl tryptose broth (Becton, Dickinson and Company, Franklin Lakes, NJ), a selective growth medium for coliforms, was then added to achieve a 1× final concentration, and the culture was incubated at 37°C for 18 h. For DNA extraction, 5 ml of the culture was centrifuged at 4,000 rpm for 15 min, the supernatant was removed, and the bacterial pellet was resuspended in 300 μl of sterile 1× phosphate-buffered saline (VWR, Radnor, PA). Total DNA was extracted using a DNeasy PowerSoil kit (Qiagen, Hilden, Germany). Shotgun sequencing library preparation was performed with a Nextera XT kit (v2; Illumina, Inc., San Diego, CA, USA), and the libraries were multiplexed and sequenced on an Illumina MiSeq platform with v3 chemistry (2 × 300 bp).
Bioinformatics.
Figure 1 depicts a flowchart of the bioinformatic steps taken in this study. Raw paired-end reads were trimmed and quality filtered using the Trimmomatic trimmer (v0.33) with the following options: the ILLUMINACLIP command was used to remove adaptors and other Illumina-specific sequences (72); a sliding window of 4 nucleotides was used to clip reads starting at the 5′ end, once the average quality in the window fell below Q15; and reads with a length of less than 36 nucleotides were discarded. Quality assessment of raw and trimmed reads was performed with the FastQC program (v0.11.5) (73).
Taxonomic classification.
To identify the bacterial species present in each sample, taxonomic labels were assigned to each read using the program Kraken (v1.1) with default parameters and the prebuilt MiniKraken 8-GB database (v20171019) (74) (Fig. 1, flowchart section labeled “1) Taxonomic classification”). Since the samples were enriched for coliforms before sequencing, the majority of the reads were expected to be classified to the family Enterobacteriaceae. A custom script was used to calculate the number of reads assigned directly to each taxon using the output from the command kraken-translate–mpa-format. To account for the differential sequencing depth between samples, read counts for each taxon were normalized via cumulative sum scaling with the R package metagenomeSeq (v1.18.0) (75, 76), using the 0.5 default percentile.
Antimicrobial resistance gene identification.
To identify acquired ARGs, trimmed reads were aligned to ARG reference sequences from the ResFinder database (downloaded 9 August 2018) (77), using the BWA-MEM algorithm (v0.7.17) (78) (Fig. 1, flowchart section labeled “2) ARG identification”). To decrease the likelihood of the false-positive identification of resistance genes, the BBmap script (https://sourceforge.net/projects/bbmap/) pileup.sh was used to calculate the percentage of nucleotides in a given reference gene with at least one aligned read (i.e., the gene fraction). Only reference ARGs with a gene fraction of ≥80% were considered to be present in a sample (79). Given the high degree of sequence homology between some ARGs, a small subset of our reads aligned equally well to multiple ARG reference sequences (i.e., multimapping reads). In such situations, we observed that the BWA-MEM algorithm randomly assigned each multimapping read to a single reference sequence, effectively reducing the likelihood that a sufficient number of reads required to meet the ≥80% gene fraction threshold would align to any one of the homologous reference sequences. Thus, to improve the sensitivity of ARG identification, all alternative alignments were included in the BWA-MEM output SAM file’s XA:Z field. The BWA xa2multi.pl script was then used to parse alternative alignments into multimapping alignments (78), and a custom script was used to identify multimapping reads. To avoid double counting, reads that mapped to multiple reference sequences in different gene groups [e.g., blaTEM, tet(A), sul2, etc.] were removed from the SAM file prior to calculating gene fractions. Reference ARGs with a gene fraction of ≥80% in each sample were then aggregated to the gene group level to avoid the double counting of reads mapping to multiple reference sequences within the same ARG group.
Characterization of antimicrobial resistance gene genetic context.
A drawback to using a read mapping approach to identify ARGs is that we lack information on the genetic context of the ARGs (i.e., the genetic environment). Particularly for studies of AMR transmission dynamics, it is important to know whether an ARG is colocalized with other ARGs or whether it is associated with mobile genetic elements. Trimmed paired and unpaired reads were assembled with the metaSPAdes program (v3.10.0), using the default parameters and k values of 21, 33, and 55 (80) (Fig. 1, flowchart section labeled “3) ARG genetic context”). Additional assemblies were run by consecutively adding k values of 77, 99, and 127. Contigs with a length of <500 bp were removed from the assemblies. Assembly quality was assessed with the QUAST program (v4.3) (81), and the assembly with the highest N50 value for each sample was chosen for downstream analysis. To calculate the number of total reads used in the assemblies, paired and unpaired reads were mapped back to contigs with the BWA-MEM algorithm, and aligned reads were identified by use of the SAMtools program (v1.9) (82). Coding sequence (CDS) predictions for each contig were made by use of the Prokka program (v0.7.17) (83). ARGs were identified by aligning CDS features to the ResFinder database using the blastn program (84) with a percent identity of ≥90% and a reference gene coverage of ≥80%. ARG-carrying contigs were manually annotated using the blastx program (84) and the following databases: ISfinder for insertion sequences (85), INTEGRALL for integrons (86), PlasmidFinder for plasmid replicons (87), and the National Center for Biotechnology Information’s (NCBI’s) collection of nonredundant (nr) protein sequences (https://www.ncbi.nlm.nih.gov/). Particular focus was paid to determining whether each ARG-carrying contig was chromosomal or plasmid derived and identifying mobile genetic elements associated with ARGs. The predicted bacterial origin of each ARG-carrying contig was determined using the blastn program and NCBI’s nucleotide collection and noting the taxonomic origin(s) of the top hits.
Data analyses.
Given that the culture enrichment step prohibited the accurate quantification of genes in the original samples (36), only the presence/absence of different ARG groups was considered. Heatmaps displaying the normalized relative abundance of bacterial species and the presence/absence of ARG groups across samples were created with the heatmap.2 function from the R package gplots (v3.0.1) (88). Annotated contigs were viewed with SnapGene Viewer software (v4.2.11) (GSL Biotech).
Spatial cluster analysis.
To detect the geographical areas in which ARG-positive owls occurred at higher or lower frequencies than random expectations, we performed a cluster detection analysis with SaTScan software (v9.6) (http://www.satscan.org), using the purely spatial scan statistic with a Bernoulli model (89). The spatial scan statistic is based on the likelihood ratio test and utilizes a moving circular window where the presence of a cluster is determined by whether the estimated risk within a window is significantly greater than the estimated risk outside of the window (89). A maximum geographical window size of 50% of the sampled population was used, and cluster P values were obtained through Monte Carlo hypothesis testing with 999 replications. Separate cluster detection analyses were performed for the presence/absence of any ARG and for the presence/absence of resistance gene groups associated with particular antimicrobial classes that were identified in at least 5% (4/78) of the owls. Owl recovery locations and statistically significant spatial clusters (P < 0.05) were mapped with ArcGIS desktop software (v10.6.1.9270) (90).
Risk factor analysis.
To assess the relative importance of host and environmental factors on the presence of ARGs recovered from Minnesota owls (n = 69), we performed logistic regression analyses within a multimodel inference framework. Multimodel inference can account for model selection uncertainty and reduces model selection bias, making it more robust and conservative than traditional stepwise model selection analysis (91). Response variables included the presence/absence of any ARG and the presence/absence of ARGs associated with particular antimicrobial classes that were identified in at least 5% (4/78) of the samples. Given the relatively small sample size and the rare number of ARG-positive samples, we used Firth’s penalized likelihood approach implemented in the R package brglm (v0.6.1) (92).
The number of raw sequencing read pairs was included as a covariate to control for the correlation between sequencing depth and the likelihood of identifying ARGs. Host covariates included owl species (great horned owl versus barred owl); age (hatch year versus adult); body condition score; and recovery month temperature, which was a proxy for the recovery season. Spatial covariates included the number of point sources per square kilometer; the number of swine, bovine, and domestic fowl units per square kilometer; the presence of an impaired water body (yes versus no); and the percentage of land cover classified as agricultural. Geospatial data on point sources, animal units, and impaired water bodies were obtained from the Minnesota Pollution Control Agency (MPCA) via the Minnesota Geospatial Commons (https://gisdata.mn.gov; accessed 10 January 2019). Point sources included spatial features associated with wastewater, storm water, hazardous waste, solid waste, and feedlots (93). An “animal unit” was defined as a measure of the relative manure production at feedlots and manure storage areas, accounting for the variation in production by animal species and size (94). Separate animal unit totals were calculated for swine (including all members of the family Suidae, primarily domestic hogs), bovine (subfamily Bovinae, primarily domestic cattle), and domestic fowl (order Galliformes, primarily turkeys and chickens). “Impaired water bodies” were classified by the MPCA as any body of water that did not meet the quality standards defined by the Environmental Protection Agency, including acceptable levels of pollutants and coliforms (95). Agricultural land cover data were obtained from the University of Minnesota’s Remote Sensing and Geospatial Analysis Laboratory (96) (https://rs.umn.edu/mndata; accessed 14 January 2019) and included all areas classified as hay, pasture, or row crops.
Spatial covariates for each owl were calculated in ArcGIS desktop software (v10.6.1.9270) (90) over two different spatial scales: potential home range and water catchment (Fig. S2). Potential home range area was based on an estimated true home range size of 5.6 km2 (diameter ≈ 2.67 km) (37). However, because an owl may have been recovered at any spatial point within its true home range, including an outermost edge, we defined the potential home range area to be a circle with a diameter of 2 × 2.67 km (5.34 km; area [A] = 22.4 km2) with the owl recovery location at the circle’s center. Water catchments were based on level 08 delineations, as defined by the Minnesota Department of Natural Resources (97), and geospatial boundaries were obtained from the Minnesota Geospatial Commons (https://gisdata.mn.gov/dataset/geos-dnr-watersheds; accessed 10 January 2019). Due to the high level of correlation between potential home range and water catchment spatial covariates, separate covariate sets were created for each spatial scale (Table S3). The number of raw sequencing read pairs and all host covariates were included in both covariate sets.
Separate regression analyses and model-averaging procedures were performed for each response variable and covariate set. For each analysis, all possible combinations of covariates, including the null intercept-only model, were used to generate a candidate model set. To account for potential collinearity among covariates, variance inflation factor (VIF) values were calculated for each model using the R package car (v3.0) (98), and models exhibiting VIF values of >2.0 were removed (99). Candidate models were then compared using Akaike’s information criterion corrected for small sample size (AICc), and the top model set included all models with a change in the AICc (ΔAICc) of 2.0 from the lowest AICc, as recommended by Burnham and Anderson (100). Parameter estimates and standard errors were obtained by averaging over all models in the top model set using the zero (or full) average method (100, 101) with the model.avg function in the R package MuMIn (v1.40.4) (102). To make the comparisons between covariates more interpretable, coefficient estimates were standardized using standard deviations of the covariate and response variable (103). Confidence intervals that did not span zero were used to identify important covariates (104). If the null (intercept-only) model was included in the top model set, we concluded that the variation in the response variable could not be explained by any of the proposed covariates.
To test for a spatial autocorrelation in the residuals from each regression analysis, we computed Moran’s I autocorrelation coefficient for the model with the lowest AICc in each model set using the Moran.I function from the R package ape (v5.2) (105, 106). Distances between sample recovery locations were calculated using the distm function from the geosphere package, where the shortest distance between two points was based on a geographic coordinate system WGS84 reference ellipsoid (107).
Data availability.
All Illumina MiSeq sequencing data generated for the current study have been deposited in NCBI’s Sequence Read Archive under BioProject accession number PRJNA605836.
Supplementary Material
ACKNOWLEDGMENTS
This research was supported by the University of Minnesota College of Veterinary Medicine Population Systems grant program.
We thank Jamie Karlin for assistance with sample collections, Bonnie Weber for laboratory work, Jeannette Munoz-Aguayo and Cristian Flores Figueroa for sequencing, Noelle Noyes and Chris Dean for bioinformatics troubleshooting, and Mark Ferrey for help procuring Minnesota landscape data. We also thank the Minnesota Supercomputing Institute and the University of Minnesota U-Spatial for bioinformatic and spatial analysis support, respectively.
K.L.V., M.W., and J.B.P. designed the study. E.A.M. processed the samples, conducted all bioinformatic processing, and analyzed the data, with input from K.L.V. and T.J.J. E.A.M. wrote the manuscript with input from all authors. All authors reviewed and approved the final manuscript.
We declare that we have no conflict of interest.
Footnotes
Supplemental material is available online only.
REFERENCES
- 1.Allen HK, Donato J, Wang HH, Cloud-Hansen KA, Davies J, Handelsman J. 2010. Call of the wild: antibiotic resistance genes in natural environments. Nat Rev Microbiol 8:251–259. doi: 10.1038/nrmicro2312. [DOI] [PubMed] [Google Scholar]
- 2.Vittecoq M, Godreuil S, Prugnolle F, Durand P, Brazier L, Renaud N, Arnal A, Aberkane S, Jean-Pierre H, Gauthier-Clerc M, Thomas F, Renaud F. 2016. Antimicrobial resistance in wildlife. J Appl Ecol 53:519–529. doi: 10.1111/1365-2664.12596. [DOI] [Google Scholar]
- 3.Karkman A, Pärnänen K, Joakim Larsson DG. 2019. Fecal pollution can explain antibiotic resistance gene abundances in anthropogenically impacted environments. Nat Commun 10:80. doi: 10.1038/s41467-018-07992-3. [DOI] [PMC free article] [PubMed] [Google Scholar]
- 4.Dolejska M, Papagiannitsis CC. 2018. Plasmid-mediated resistance is going wild. Plasmid 99:99–111. doi: 10.1016/j.plasmid.2018.09.010. [DOI] [PubMed] [Google Scholar]
- 5.Dolejska M, Literak I. 2019. Wildlife Is overlooked in the epidemiology of medically important antibiotic-resistant bacteria. Antimicrob Agents Chemother 63:e01167-19. doi: 10.1128/AAC.01167-19. [DOI] [PMC free article] [PubMed] [Google Scholar]
- 6.Ahlstrom CA, Bonnedahl J, Woksepp H, Hernandez J, Olsen B, Ramey AM. 2018. Acquisition and dissemination of cephalosporin-resistant E. coli in migratory birds sampled at an Alaska landfill as inferred through genomic analysis. Sci Rep 8:7361. doi: 10.1038/s41598-018-25474-w. [DOI] [PMC free article] [PubMed] [Google Scholar]
- 7.Cole D, Drum DJV, Stalknecht DE, White DG, Lee MD, Ayers S, Sobsey M, Maurer JJ. 2005. Free-living Canada geese and antimicrobial resistance. Emerg Infect Dis 11:935–938. doi: 10.3201/eid1106.040717. [DOI] [PMC free article] [PubMed] [Google Scholar]
- 8.Allen SE, Boerlin P, Janecko N, Lumsden JS, Barker IK, Pearl DL, Reid-Smith RJ, Jardine C. 2011. Antimicrobial resistance in generic Escherichia coli isolates from wild small mammals living in swine farm, residential, landfill, and natural environments in southern Ontario, Canada. Appl Environ Microbiol 77:882–888. doi: 10.1128/AEM.01111-10. [DOI] [PMC free article] [PubMed] [Google Scholar]
- 9.Bondo KJ, Pearl DL, Janecko N, Boerlin P, Reid-Smith RJ, Parmley J, Jardine CM. 2016. Epidemiology of antimicrobial resistance in Escherichia coli isolates from raccoons (Procyon lotor) and the environment on swine farms and conservation areas in southern Ontario. PLoS One 11:e0165303. doi: 10.1371/journal.pone.0165303. [DOI] [PMC free article] [PubMed] [Google Scholar]
- 10.Rybarikova J, Dolejska M, Materna D, Literak I, Cizek A. 2010. Phenotypic and genotypic characteristics of antimicrobial resistant Escherichia coli isolated from symbovine flies, cattle and sympatric insectivorous house martins from a farm in the Czech Republic (2006-2007). Res Vet Sci 89:179–183. doi: 10.1016/j.rvsc.2010.02.016. [DOI] [PubMed] [Google Scholar]
- 11.Nelson M, Jones SH, Edwards C, Ellis JC. 2008. Characterization of Escherichia coli populations from gulls, landfill trash, and wastewater using ribotyping. Dis Aquat Organ 81:53–63. doi: 10.3354/dao01937. [DOI] [PubMed] [Google Scholar]
- 12.White A, Hughes JM. 2019. Critical importance of a One Health approach to antimicrobial resistance. Ecohealth 16:404–409. doi: 10.1007/s10393-019-01415-5. [DOI] [PubMed] [Google Scholar]
- 13.Arnold KE, Williams NJ, Bennett M. 2016. 'Disperse abroad in the land': the role of wildlife in the dissemination of antimicrobial resistance. Biol Lett 12:20160137. doi: 10.1098/rsbl.2016.0137. [DOI] [PMC free article] [PubMed] [Google Scholar]
- 14.Wang J, Ma ZB, Zeng ZL, Yang XW, Huang Y, Liu JH. 2017. The role of wildlife (wild birds) in the global transmission of antimicrobial resistance genes. Zool Res 38:55–80. doi: 10.24272/j.issn.2095-8137.2017.003. [DOI] [PMC free article] [PubMed] [Google Scholar]
- 15.Sacristán I, Esperón F, Acuña F, Aguilar E, García S, López MJ, Cevidanes A, Neves E, Cabello J, Hidalgo-Hermoso E, Poulin E, Millán J, Napolitano C. 2020. Antibiotic resistance genes as landscape anthropization indicators: using a wild felid as sentinel in Chile. Sci Total Environ 703:134900. doi: 10.1016/j.scitotenv.2019.134900. [DOI] [PubMed] [Google Scholar]
- 16.Schaufler K, Semmler T, Wieler LH, Wohrmann M, Baddam R, Ahmed N, Muller K, Kola A, Fruth A, Ewers C, Guenther S. 2016. Clonal spread and interspecies transmission of clinically relevant ESBL-producing Escherichia coli of ST410-another successful pandemic clone? FEMS Microbiol Ecol 92:fiv155. doi: 10.1093/femsec/fiv155. [DOI] [PubMed] [Google Scholar]
- 17.Wang Y, Zhang R, Li J, Wu Z, Yin W, Schwarz S, Tyrrell JM, Zheng Y, Wang S, Shen Z, Liu Z, Liu J, Lei L, Li M, Zhang Q, Wu C, Zhang Q, Wu Y, Walsh TR, Shen J. 2017. Comprehensive resistome analysis reveals the prevalence of NDM and MCR-1 in Chinese poultry production. Nat Microbiol 2:16260. doi: 10.1038/nmicrobiol.2016.260. [DOI] [PubMed] [Google Scholar]
- 18.Wellington EMH, Boxall ABA, Cross P, Feil EJ, Gaze WH, Hawkey PM, Johnson-Rollings AS, Jones DL, Lee NM, Otten W, Thomas CM, Williams AP. 2013. The role of the natural environment in the emergence of antibiotic resistance in Gram-negative bacteria. Lancet Infect Dis 13:155–165. doi: 10.1016/S1473-3099(12)70317-1. [DOI] [PubMed] [Google Scholar]
- 19.Singer RS, Ward MP, Maldonado G. 2006. Can landscape ecology untangle the complexity of antibiotic resistance? Nat Rev Microbiol 4:943–952. doi: 10.1038/nrmicro1553. [DOI] [PubMed] [Google Scholar]
- 20.Steele CM, Brown RN, Botzler RG. 2005. Prevalences of zoonotic bacteria among seabirds in rehabilitation centers along the Pacific Coast of California and Washington, USA. J Wildl Dis 41:735–744. doi: 10.7589/0090-3558-41.4.735. [DOI] [PubMed] [Google Scholar]
- 21.Fuentes-Castillo D, Farfán-López M, Esposito F, Moura Q, Fernandes MR, Lopes R, Cardoso B, Muñoz ME, Cerdeira L, Najle I, Muñoz PM, Catão-Dias JL, González-Acuña D, Lincopan N. 2019. Wild owls colonized by international clones of extended-spectrum beta-lactamase (CTX-M)-producing Escherichia coli and Salmonella Infantis in the Southern Cone of America. Sci Total Environ 674:554–562. doi: 10.1016/j.scitotenv.2019.04.149. [DOI] [PubMed] [Google Scholar]
- 22.Smith WA, Mazet JA, Hirsh DC. 2002. Salmonella in California wildlife species: prevalence in rehabilitation centers and characterization of isolates. J Zoo Wildl Med 33:228–235. [DOI] [PubMed] [Google Scholar]
- 23.Marrow J, Whittington JK, Mitchell M, Hoyer LL, Maddox C. 2009. Prevalence and antibiotic-resistance characteristics of Enterococcus spp. isolated from free-living and captive raptors in central Illinois. J Wildl Dis 45:302–313. doi: 10.7589/0090-3558-45.2.302. [DOI] [PubMed] [Google Scholar]
- 24.Waldenstrom J, Mevius D, Veldman K, Broman T, Hasselquist D, Olsen B. 2005. Antimicrobial resistance profiles of Campylobacter jejuni isolates from wild birds in Sweden. Appl Environ Microbiol 71:2438–2441. doi: 10.1128/AEM.71.5.2438-2441.2005. [DOI] [PMC free article] [PubMed] [Google Scholar]
- 25.Martínez-López E, Romero D, María-Mojica P, Martínez JE, Calvo JF, García-Fernández AJ. 2009. Changes in blood pesticide levels in booted eagle (Hieraaetus pennatus) associated with agricultural land practices. Ecotoxicol Environ Saf 72:45–50. doi: 10.1016/j.ecoenv.2008.02.012. [DOI] [PubMed] [Google Scholar]
- 26.Gómez-Ramírez P, Shore RF, van den Brink NW, van Hattum B, Bustnes JO, Duke G, Fritsch C, García-Fernández AJ, Helander BO, Jaspers V, Krone O, Martínez-López E, Mateo R, Movalli P, Sonne C. 2014. An overview of existing raptor contaminant monitoring activities in Europe. Environ Int 67:12–21. doi: 10.1016/j.envint.2014.02.004. [DOI] [PubMed] [Google Scholar]
- 27.Mazur KM, James PC. 2000. Barred owl (Strix varia) In Rodewald PG. (ed), The birds of North America online. Cornell Lab of Ornithology, Ithaca, NY: https://birdsna.org/Species-Account/bna/species/brdowl. [Google Scholar]
- 28.Artuso CC, Houston CS, Smith DG, Rohner C. 2013. Great horned owl (Bubo virginianus) In Rodewald PG. (ed), The birds of North America online. Cornell Lab of Ornithology, Ithaca, NY: https://birdsna.org/Species-Account/bna/species/grhowl. [Google Scholar]
- 29.Carattoli A. 2009. Resistance plasmid families in Enterobacteriaceae. Antimicrob Agents Chemother 53:2227–2238. doi: 10.1128/AAC.01707-08. [DOI] [PMC free article] [PubMed] [Google Scholar]
- 30.Iredell J, Brown J, Tagg K. 2016. Antibiotic resistance in Enterobacteriaceae: mechanisms and clinical implications. BMJ 352:h6420. doi: 10.1136/bmj.h6420. [DOI] [PubMed] [Google Scholar]
- 31.Nesme J, Cecillon S, Delmont TO, Monier JM, Vogel TM, Simonet P. 2014. Large-scale metagenomic-based study of antibiotic resistance in the environment. Curr Biol 24:1096–1100. doi: 10.1016/j.cub.2014.03.036. [DOI] [PubMed] [Google Scholar]
- 32.Hu YF, Yang X, Qin JJ, Lu N, Cheng G, Wu N, Pan YL, Li J, Zhu LY, Wang X, Meng ZQ, Zhao FQ, Liu D, Ma JC, Qin N, Xiang CS, Xiao YH, Li LJ, Yang HM, Wang J, Yang RF, Gao GF, Wang J, Zhu B. 2013. Metagenome-wide analysis of antibiotic resistance genes in a large cohort of human gut microbiota. Nat Commun 4:2151. doi: 10.1038/ncomms3151. [DOI] [PubMed] [Google Scholar]
- 33.Fitzpatrick D, Walsh F. 2016. Antibiotic resistance genes across a wide variety of metagenomes. FEMS Microbiol Ecol 92:fiv168. doi: 10.1093/femsec/fiv168. [DOI] [PubMed] [Google Scholar]
- 34.Bengtsson-Palme J, Boulund F, Fick J, Kristiansson E, Larsson DG. 2014. Shotgun metagenomics reveals a wide array of antibiotic resistance genes and mobile elements in a polluted lake in India. Front Microbiol 5:648. doi: 10.3389/fmicb.2014.00648. [DOI] [PMC free article] [PubMed] [Google Scholar]
- 35.Zaheer R, Noyes N, Polo RO, Cook SR, Marinier E, Van Domselaar G, Belk KE, Morley PS, McAllister TA. 2018. Impact of sequencing depth on the characterization of the microbiome and resistome. Sci Rep 8:5890. doi: 10.1038/s41598-018-24280-8. [DOI] [PMC free article] [PubMed] [Google Scholar]
- 36.Peto L, Fawcett NJ, Crook DW, Peto TEA, Llewelyn MJ, Walker SA. 2019. Selective culture enrichment and sequencing of faeces to enhance detection of antimicrobial resistance genes. PLoS One 14:e0222831. doi: 10.1371/journal.pone.0222831. [DOI] [PMC free article] [PubMed] [Google Scholar]
- 37.Fuller MR. 1979. Spatiotemporal ecology of four species of sympatric raptor species. PhD dissertation University of Minnesota, Minneapolis, MN. [Google Scholar]
- 38.Rehman MA, Yin X, Persaud-Lachhman MG, Diarra MS. 2017. First detection of a fosfomycin resistance gene, fosA7, in Salmonella enterica serovar Heidelberg isolated from broiler chickens. Antimicrob Agents Chemother 61:e00410-17. doi: 10.1128/AAC.00410-17. [DOI] [PMC free article] [PubMed] [Google Scholar]
- 39.Ito R, Mustapha MM, Tomich AD, Callaghan JD, McElheny CL, Mettus RT, Shanks RMQ, Sluis-Cremer N, Doi Y. 2017. Widespread fosfomycin resistance in Gram-negative bacteria attributable to the chromosomal fosA gene. mBio 8:e00749-17. doi: 10.1128/mBio.00749-17. [DOI] [PMC free article] [PubMed] [Google Scholar]
- 40.Fournier B, Roy PH, Lagrange PH, Philippon A. 1996. Chromosomal beta-lactamase genes of Klebsiella oxytoca are divided into two main groups, blaOXY-1 and blaOXY-2. Antimicrob Agents Chemother 40:454–459. doi: 10.1128/AAC.40.2.454. [DOI] [PMC free article] [PubMed] [Google Scholar]
- 41.Bailey JK, Pinyon JL, Anantham S, Hall RM. 2011. Distribution of the blaTEM gene and blaTEM-containing transposons in commensal Escherichia coli. J Antimicrob Chemother 66:745–751. doi: 10.1093/jac/dkq529. [DOI] [PubMed] [Google Scholar]
- 42.Partridge SR, Kwong SM, Firth N, Jensen SO. 2018. Mobile genetic elements associated with antimicrobial resistance. Clin Microbiol Rev 31:e00088-17. doi: 10.1128/CMR.00088-17. [DOI] [PMC free article] [PubMed] [Google Scholar]
- 43.Guenther S, Grobbel M, Lubke-Becker A, Goedecke A, Friedrich ND, Wieler LH, Ewers C. 2010. Antimicrobial resistance profiles of Escherichia coli from common European wild bird species. Vet Microbiol 144:219–225. doi: 10.1016/j.vetmic.2009.12.016. [DOI] [PubMed] [Google Scholar]
- 44.Giacopello C, Foti M, Mascetti A, Grosso F, Ricciardi D, Fisichella V, Lo Piccolo F. 2016. Antimicrobial resistance patterns of Enterobacteriaceae in European wild bird species admitted in a wildlife rescue centre. Vet Ital 52:139–144. doi: 10.12834/VetIt.327.1374.2. [DOI] [PubMed] [Google Scholar]
- 45.Sala A, Taddei S, Santospirito D, Sandri C, Magnone W, Cabassi CS. 2016. Antibiotic resistance in conjunctival and enteric bacterial flora in raptors housed in a zoological garden. Vet Med Sci 2:239–245. doi: 10.1002/vms3.38. [DOI] [PMC free article] [PubMed] [Google Scholar]
- 46.Radhouani H, Poeta P, Goncalves A, Pacheco R, Sargo R, Igrejas G. 2012. Wild birds as biological indicators of environmental pollution: antimicrobial resistance patterns of Escherichia coli and enterococci isolated from common buzzards (Buteo buteo). J Med Microbiol 61:837–843. doi: 10.1099/jmm.0.038364-0. [DOI] [PubMed] [Google Scholar]
- 47.Poeta P, Costa D, Saenz Y, Klibi N, Ruiz-Larrea F, Rodrigues J, Torres C. 2005. Characterization of antibiotic resistance genes and virulence factors in faecal enterococci of wild animals in Portugal. J Vet Med B Infect Dis Vet Public Health 52:396–402. doi: 10.1111/j.1439-0450.2005.00881.x. [DOI] [PubMed] [Google Scholar]
- 48.Nam HM, Lee HS, Byun JW, Yoon SS, Jung SC, Joo YS, Lim SK. 2010. Prevalence of antimicrobial resistance in fecal Escherichia coli isolates from stray pet dogs and hospitalized pet dogs in Korea. Microb Drug Resist 16:75–79. doi: 10.1089/mdr.2009.0125. [DOI] [PubMed] [Google Scholar]
- 49.Khachatryan AR, Hancock DD, Besser TE, Call DR. 2004. Role of calf-adapted Escherichia coli in maintenance of antimicrobial drug resistance in dairy calves. Appl Environ Microbiol 70:752–757. doi: 10.1128/AEM.70.2.752-757.2004. [DOI] [PMC free article] [PubMed] [Google Scholar]
- 50.Miller EA, Johnson TJ, Omondi G, Atwill ER, Isbell LA, McCowan B, VanderWaal K. 2018. Assessing transmission of antimicrobial resistant Escherichia coli in wild giraffe contact networks. Appl Environ Microbiol 85:e02136-18. doi: 10.1128/AEM.02136-18. [DOI] [PMC free article] [PubMed] [Google Scholar]
- 51.Swift BMC, Bennett M, Waller K, Dodd C, Murray A, Gomes RL, Humphreys B, Hobman JL, Jones MA, Whitlock SE, Mitchell LJ, Lennon RJ, Arnold KE. 2019. Anthropogenic environmental drivers of antimicrobial resistance in wildlife. Sci Total Environ 649:12–20. doi: 10.1016/j.scitotenv.2018.08.180. [DOI] [PubMed] [Google Scholar]
- 52.Williams NJ, Sherlock C, Jones TR, Clough HE, Telfer SE, Begon M, French N, Hart CA, Bennett M. 2011. The prevalence of antimicrobial-resistant Escherichia coli in sympatric wild rodents varies by season and host. J Appl Microbiol 110:962–970. doi: 10.1111/j.1365-2672.2011.04952.x. [DOI] [PubMed] [Google Scholar]
- 53.van Dongen WFD, White J, Brandl HB, Moodley Y, Merkling T, Leclaire S, Blanchard P, Danchin E, Hatch SA, Wagner RH. 2013. Age-related differences in the cloacal microbiota of a wild bird species. BMC Ecol 13:11. doi: 10.1186/1472-6785-13-11. [DOI] [PMC free article] [PubMed] [Google Scholar]
- 54.Taylor MJ, Mannan RW, U’Ren JM, Garber NP, Gallery RE, Arnold AE. 2019. Age-related variation in the oral microbiome of urban Cooper's hawks (Accipiter cooperii). BMC Microbiol 19:47. doi: 10.1186/s12866-019-1413-y. [DOI] [PMC free article] [PubMed] [Google Scholar]
- 55.Heuer H, Schmitt H, Smalla K. 2011. Antibiotic resistance gene spread due to manure application on agricultural fields. Curr Opin Microbiol 14:236–243. doi: 10.1016/j.mib.2011.04.009. [DOI] [PubMed] [Google Scholar]
- 56.Jechalke S, Kopmann C, Rosendahl I, Groeneweg J, Weichelt V, Krogerrecklenfort E, Brandes N, Nordwig M, Ding GC, Siemens J, Heuer H, Smalla K. 2013. Increased abundance and transferability of resistance genes after field application of manure from sulfadiazine-treated pigs. Appl Environ Microbiol 79:1704–1711. doi: 10.1128/AEM.03172-12. [DOI] [PMC free article] [PubMed] [Google Scholar]
- 57.Singer AC, Shaw H, Rhodes V, Hart A. 2016. Review of antimicrobial resistance in the environment and its relevance to environmental regulators. Front Microbiol 7:1728. doi: 10.3389/fmicb.2016.01728. [DOI] [PMC free article] [PubMed] [Google Scholar]
- 58.Guenther S, Grobbel M, Heidemanns K, Schlegel M, Ulrich RG, Ewers C, Wieler LH. 2010. First insights into antimicrobial resistance among faecal Escherichia coli isolates from small wild mammals in rural areas. Sci Total Environ 408:3519–3522. doi: 10.1016/j.scitotenv.2010.05.005. [DOI] [PubMed] [Google Scholar]
- 59.Su H-C, Pan C-G, Ying G-G, Zhao J-L, Zhou L-J, Liu Y-S, Tao R, Zhang R-Q, He L-Y. 2014. Contamination profiles of antibiotic resistance genes in the sediments at a catchment scale. Sci Total Environ 490:708–714. doi: 10.1016/j.scitotenv.2014.05.060. [DOI] [PubMed] [Google Scholar]
- 60.Taylor NG, Verner-Jeffreys DW, Baker-Austin C. 2011. Aquatic systems: maintaining, mixing and mobilising antimicrobial resistance? Trends Ecol Evol 26:278–284. doi: 10.1016/j.tree.2011.03.004. [DOI] [PubMed] [Google Scholar]
- 61.NASS. 2017. Chapter 1: state level data, Minnesota In Census of agriculture, vol 1 U.S. Department of Agriculture, Washington, DC. [Google Scholar]
- 62.Singer RS, Porter L. 2019. Estimates of on-farm antimicrobial usage in broiler chicken and turkey production in the United States, 2013–2017. Mindwalk Consulting Group, LLC, Falcon Heights, MN. [Google Scholar]
- 63.Food and Drug Administration. 2018. Summary report on antimicrobials sold or distributed for use in food-producing animals. U.S. Department of Health and Human Services, Washington, DC. [Google Scholar]
- 64.Shen Y, Zhou H, Xu J, Wang Y, Zhang Q, Walsh TR, Shao B, Wu C, Hu Y, Yang L, Shen Z, Wu Z, Sun Q, Ou Y, Wang Y, Wang S, Wu Y, Cai C, Li J, Shen J, Zhang R, Wang Y. 2018. Anthropogenic and environmental factors associated with high incidence of mcr-1 carriage in humans across China. Nat Microbiol 3:1054–1062. doi: 10.1038/s41564-018-0205-8. [DOI] [PMC free article] [PubMed] [Google Scholar]
- 65.Gillings MR, Gaze WH, Pruden A, Smalla K, Tiedje JM, Zhu YG. 2015. Using the class 1 integron-integrase gene as a proxy for anthropogenic pollution. ISME J 9:1269–1279. doi: 10.1038/ismej.2014.226. [DOI] [PMC free article] [PubMed] [Google Scholar]
- 66.Gillings M, Boucher Y, Labbate M, Holmes A, Krishnan S, Holley M, Stokes HW. 2008. The evolution of class 1 integrons and the rise of antibiotic resistance. J Bacteriol 190:5095–5100. doi: 10.1128/JB.00152-08. [DOI] [PMC free article] [PubMed] [Google Scholar]
- 67.Wagner S, Lupolova N, Gally DL, Argyle SA. 2017. Convergence of plasmid architectures drives emergence of multi-drug resistance in a clonally diverse Escherichia coli population from a veterinary clinical care setting. Vet Microbiol 211:6–14. doi: 10.1016/j.vetmic.2017.09.016. [DOI] [PMC free article] [PubMed] [Google Scholar]
- 68.de Been M, Lanza VF, de Toro M, Scharringa J, Dohmen W, Du Y, Hu J, Lei Y, Li N, Tooming-Klunderud A, Heederik DJJ, Fluit AC, Bonten MJM, Willems RJL, de la Cruz F, van Schaik W. 2014. Dissemination of cephalosporin resistance genes between Escherichia coli strains from farm animals and humans by specific plasmid lineages. PLoS Genet 10:e1004776. doi: 10.1371/journal.pgen.1004776. [DOI] [PMC free article] [PubMed] [Google Scholar]
- 69.Stephens CM, Skerker JM, Sekhon MS, Arkin AP, Riley LW. 2015. Complete genome sequences of four Escherichia coli ST95 isolates from bloodstream infections. Genome Announc 3:e01241-15. doi: 10.1128/genomeA.01241-15. [DOI] [PMC free article] [PubMed] [Google Scholar]
- 70.Rohner C, Krebs CJ. 1998. Response of great horned owls to experimental “hot spots” of snowshoe hare density. Auk 115:694–705. doi: 10.2307/4089417. [DOI] [Google Scholar]
- 71.Mazur KM, Frith SD, James PC. 1998. Barred owl home range and habitat selection in the boreal forest of central Saskatchewan. Auk 115:746–754. doi: 10.2307/4089422. [DOI] [Google Scholar]
- 72.Bolger AM, Lohse M, Usadel B. 2014. Trimmomatic: a flexible trimmer for Illumina sequence data. Bioinformatics 30:2114–2120. doi: 10.1093/bioinformatics/btu170. [DOI] [PMC free article] [PubMed] [Google Scholar]
- 73.Babraham Bioinformatics. 2011. FastQC: a quality control tool for high throughput sequence data. Babraham Institute, Cambridge, United Kingdom. [Google Scholar]
- 74.Wood DE, Salzberg SL. 2014. Kraken: ultrafast metagenomic sequence classification using exact alignments. Genome Biol 15:R46. doi: 10.1186/gb-2014-15-3-r46. [DOI] [PMC free article] [PubMed] [Google Scholar]
- 75.McMurdie PJ, Holmes S. 2014. Waste not, want not: why rarefying microbiome data is inadmissible. PLoS Comput Biol 10:e1003531. doi: 10.1371/journal.pcbi.1003531. [DOI] [PMC free article] [PubMed] [Google Scholar]
- 76.Paulson JN, Stine OC, Bravo HC, Pop M. 2013. Differential abundance analysis for microbial marker-gene surveys. Nat Methods 10:1200–1202. doi: 10.1038/nmeth.2658. [DOI] [PMC free article] [PubMed] [Google Scholar]
- 77.Zankari E, Hasman H, Cosentino S, Vestergaard M, Rasmussen S, Lund O, Aarestrup FM, Larsen MV. 2012. Identification of acquired antimicrobial resistance genes. J Antimicrob Chemother 67:2640–2644. doi: 10.1093/jac/dks261. [DOI] [PMC free article] [PubMed] [Google Scholar]
- 78.Li H, Durbin R. 2009. Fast and accurate short read alignment with Burrows-Wheeler transform. Bioinformatics 25:1754–1760. doi: 10.1093/bioinformatics/btp324. [DOI] [PMC free article] [PubMed] [Google Scholar]
- 79.Noyes NR, Yang X, Linke LM, Magnuson RJ, Dettenwanger A, Cook S, Geornaras I, Woerner DE, Gow SP, McAllister TA, Yang H, Ruiz J, Jones KL, Boucher CA, Morley PS, Belk KE. 2016. Resistome diversity in cattle and the environment decreases during beef production. Elife 5:e13195. doi: 10.7554/eLife.13195. [DOI] [PMC free article] [PubMed] [Google Scholar]
- 80.Nurk S, Meleshko D, Korobeynikov A, Pevzner PA. 2017. metaSPAdes: a new versatile metagenomic assembler. Genome Res 27:824–834. doi: 10.1101/gr.213959.116. [DOI] [PMC free article] [PubMed] [Google Scholar]
- 81.Gurevich A, Saveliev V, Vyahhi N, Tesler G. 2013. QUAST: quality assessment tool for genome assemblies. Bioinformatics 29:1072–1075. doi: 10.1093/bioinformatics/btt086. [DOI] [PMC free article] [PubMed] [Google Scholar]
- 82.Li H, Handsaker B, Wysoker A, Fennell T, Ruan J, Homer N, Marth G, Abecasis G, Durbin R, 1000 Genome Project Data Processing Subgroup. 2009. The Sequence Alignment/Map format and SAMtools. Bioinformatics 25:2078–2079. doi: 10.1093/bioinformatics/btp352. [DOI] [PMC free article] [PubMed] [Google Scholar]
- 83.Seemann T. 2014. Prokka: rapid prokaryotic genome annotation. Bioinformatics 30:2068–2069. doi: 10.1093/bioinformatics/btu153. [DOI] [PubMed] [Google Scholar]
- 84.Camacho C, Coulouris G, Avagyan V, Ma N, Papadopoulos J, Bealer K, Madden TL. 2009. BLAST+: architecture and applications. BMC Bioinformatics 10:421. doi: 10.1186/1471-2105-10-421. [DOI] [PMC free article] [PubMed] [Google Scholar]
- 85.Siguier P, Perochon J, Lestrade L, Mahillon J, Chandler M. 2006. ISfinder: the reference centre for bacterial insertion sequences. Nucleic Acids Res 34:D32–D36. doi: 10.1093/nar/gkj014. [DOI] [PMC free article] [PubMed] [Google Scholar]
- 86.Moura A, Soares M, Pereira C, Leitao N, Henriques I, Correia A. 2009. INTEGRALL: a database and search engine for integrons, integrases and gene cassettes. Bioinformatics 25:1096–1098. doi: 10.1093/bioinformatics/btp105. [DOI] [PubMed] [Google Scholar]
- 87.Carattoli A, Zankari E, Garcia-Fernandez A, Larsen MV, Lund O, Villa L, Aarestrup FM, Hasman H. 2014. In silico detection and typing of plasmids using PlasmidFinder and plasmid multilocus sequence typing. Antimicrob Agents Chemother 58:3895–3903. doi: 10.1128/AAC.02412-14. [DOI] [PMC free article] [PubMed] [Google Scholar]
- 88.Warnes GR, Bolker B, Bonebakker L, Gentleman R, Huber W, Liaw A, Lumley T, Maechler M, Magnusson A, Moeller S, Schwartz M, Venables B. 2014. gplots: various R programming tools for plotting data, v2.14.2. http://CRAN.R-project.org/package=gplots.
- 89.Kulldorff M. 1997. A spatial scan statistic. Commun Stat Theory Methods 26:1481–1496. doi: 10.1080/03610929708831995. [DOI] [Google Scholar]
- 90.Environmental Systems Research Institute. 2011. ArcGIS desktop, release 10. Environmental Systems Research Institute, Redlands, CA. [Google Scholar]
- 91.Johnson JB, Omland KS. 2004. Model selection in ecology and evolution. Trends Ecol Evol 19:101–108. doi: 10.1016/j.tree.2003.10.013. [DOI] [PubMed] [Google Scholar]
- 92.Kosmidis I. 2017. brglm: bias reduction in binary-response generalized linear models, v0.6.1. http://www.ikosmidis.com/software/.
- 93.MPCA. 2016. MPCA agency interests. ESRI file geodatabase. Minnesota Geospatial Commons, St. Paul, MN: https://gisdata.mn.gov/dataset/env-mpca-agency-interests. [Google Scholar]
- 94.MPCA. 2016. Feedlots in Minnesota. ESRI file geodatabase. Minnesota Geospatial Commons, St. Paul, MN: https://gisdata.mn.gov/dataset/env-feedlots. [Google Scholar]
- 95.MPCA. 2014. Impaired waterbodies, Minnesota, 2014 (final). ESRI file geodatabase. Minnesota Geospatial Commons, St. Paul, MN: https://gisdata.mn.gov/dataset/env-impaired-water-2014. [Google Scholar]
- 96.Remote Sensing and Geospatial Analysis Laboratory. 2013. Land cover & impervious: Minnesota 2013 (v2) (raster). University of Minnesota, Minneapolis, MN: https://rs.umn.edu/datalayers. [Google Scholar]
- 97.Minnesota Geospatial Commons. 2018. MNDNR watershed suite. ESRI file geodatabase. Minnesota Geospatial Commons, St. Paul, MN: https://gisdata.mn.gov/dataset/geos-dnr-watersheds. [Google Scholar]
- 98.Fox J, Weisberg S. 2011. An R companion to applied regression, 2nd ed Sage, Thousand Oaks, CA. [Google Scholar]
- 99.Graham MH. 2003. Confronting multicollinearity in ecological multiple regression. Ecology 84:2809–2815. doi: 10.1890/02-3114. [DOI] [Google Scholar]
- 100.Burnham KP, Anderson DR. 2002. Model selection and multimodel inference: a practical information-theoretic approach, 2nd ed Springer-Verlag, New York, NY. [Google Scholar]
- 101.Nakagawa S, Freckleton RP. 2011. Model averaging, missing data and multiple imputation: a case study for behavioural ecology. Behav Ecol Sociobiol 65:103–116. doi: 10.1007/s00265-010-1044-7. [DOI] [Google Scholar]
- 102.Bartoń K. 2018. MuMIn: multi-model inference, v1.40.4. https://CRAN.R-project.org/package=MuMIn.
- 103.Bring J. 1994. How to standardize regression coefficients. Am Stat 48:209–213. doi: 10.2307/2684719. [DOI] [Google Scholar]
- 104.Grueber CE, Nakagawa S, Laws RJ, Jamieson IG. 2011. Multimodel inference in ecology and evolution: challenges and solutions. J Evol Biol 24:699–711. doi: 10.1111/j.1420-9101.2010.02210.x. [DOI] [PubMed] [Google Scholar]
- 105.Paradis E, Schliep K. 2019. ape 5.0: an environment for modern phylogenetics and evolutionary analyses in R. Bioinformatics 35:526–528. doi: 10.1093/bioinformatics/bty633. [DOI] [PubMed] [Google Scholar]
- 106.Gittleman JL, Kot M. 1990. Adaptation: statistics and a null model for estimating phylogenetic effects. Syst Zool 39:227–241. doi: 10.2307/2992183. [DOI] [Google Scholar]
- 107.Hijmans RJ. 2019. geosphere: Spherical Trigonometry, v1.5–10. https://CRAN.R-project.org/package=geosphere.
Associated Data
This section collects any data citations, data availability statements, or supplementary materials included in this article.
Supplementary Materials
Data Availability Statement
All Illumina MiSeq sequencing data generated for the current study have been deposited in NCBI’s Sequence Read Archive under BioProject accession number PRJNA605836.